YouTubeにあるマーケットチュートリアルビデオをご覧ください
ロボットや指標を購入する
仮想ホスティングで
EAを実行
EAを実行
ロボットや指標を購入前にテストする
マーケットで収入を得る
販売のためにプロダクトをプレゼンテーションする方法
MetaTrader 5のための新しいエキスパートアドバイザーとインディケータ - 84

このエキスパートアドバイザーはトレンドウェーブインジケーターを使用し、新しいウェーブトレンドムーブメントの開始と終了を識別できます。 オシレーターとして、インジケーターは買われ過ぎと売られ過ぎのゾーンを識別します。 短期的な価格の逆転をキャッチするのに最適であり、マーチンゲール戦略を使用してすべての利益の取引を閉じます。 より正確な取引のために、任意のペアでm15以上の時間枠のデフォルト設定を使用してください! ヘッジを許可するアカウントが必要です! ここにある私のmqlチャネルここにあ る私の信号と他の製品 ご購入後、ご連絡ください。 パラメーター
Max Buys - トレーディングアドバイザーが開くことができる買い注文の最大数 Max Sells - トレーディングアドバイザーが開くことができる売り注文の最大数。 Comment -注文に関するコメント Lot-コメントコメント。 Use dinamic lot - 動的ロットを使用します。 Martin - ロットを増やす係数 Grid distance - 注文間の距離 Maxlot-最大ロット。 Stop Lo
このトレーディングエキスパートの主な目的は、トレーリングストップの機能を実行することです。ポジションをオープンまたはクローズするのではなく、セットとムーブだけが利益を取り、損失レベルを停止します。テイクプロフィットとストップロスを計算するために、価格変動の統計とD.ベルヌーイの道徳的期待が使用されます。このため、専門家によって設定された新しいレベルは、リスク/報酬の比率に関して(可能な限り)最良のオプションを提供します。トレーディングロボットのパラメータを見てみましょう。
Tracked Symbols -EAによって追跡される通貨ペア。興味のある文字をすべてコンマで区切って入力してください。例:EURUSD、GBPUSD、USDCHF。このフィールドを空のままにすると、アドバイザーはそれがインストールされているシンボルに対してのみ機能します。起動すると、ロボットは監視対象のシンボルを端末の[エキスパート]タブに表示します。 Estimated Timeframe -EAが価格変動統計を収集する時間枠を設定します。利益の少ない多数のエントリを使用する取引戦略(スキャルピングなど)

この指標は、いわゆる「悪」の数値を重み係数として使用します。それらの反対は「いやらしい」数字であり、これもこのインジケーターに表示されます。これらの2つのクラスへの数値の分割は、特定の数値のバイナリ表記の単位数によって決定されるハミングの重みに関連付けられています。 これらの数値を重み係数として使用すると、トレンド追跡インジケーターが得られます。さらに、いやらしい数字はより敏感な指標を与え、邪悪な数字は保守的な指標を与えます。それらの違いはそれほど大きくはなく、市場での急激な価格変動によってのみ顕著になります。このインジケーターの使用は、新しいトレンドの開始を判断するのに役立ちます。これにより、位置を開く瞬間をより正確に決定することが可能になります。 インジケーターパラメーター: Type numbers -番号タイプの選択、EvilまたはOdious; iPeriod -インジケーター期間。インジケーターの感度は、このパラメーターによって異なります。小さいほど、価格の変化や市場動向の変化に対する感度が高くなります。 インジケーターの動作例を図に示します。

MT5のWA_PV_BOX_EFFORTXRESULT WAPV Box Effort x Result Indicatorは、Package Indicatorsグループ(Wyckoff Academy Wave Market)の一部です。 MT5のWAPVボックスエフォートx結果インジケーターは、価格とボリュームを読み取るのに役立ちます。その読みは、努力×結果の特定を支援することで構成されています グラフによって作成された波で。 ボックスが緑色の場合のMT5のWAPVボックスの労力x結果インジケーターは、ボリュームが需要に有利であり、ボックスが赤色の場合を意味します ボリュームは供給に有利です。 ボックスが大きいほど、価格に対するボリュームの変位が大きくなります。価格の上昇波がボックスのサイズに比例しない場合、 努力×結果。 非常に視覚的な方法で、ボリュームと価格の間のこの相違を識別できます。 MT5のWAPVBoxEffort x Result Indicatorを使用すると、インジケーターをゼロ軸の下に配置することで、視覚化を向上させることもできます。 ティックボリュームとリア

黄金の神は機械学習を使用しています。 XAUUSD 1 HRの時間枠、またはOHLCをロジックとして取引する他の時間枠で取引します。 入力のバランスのリスクを設定します。デフォルトは5%です。 取得する最大ロットを制御します。 すべての取引は停止し、利益を上げます。 このEAは積極的に取引されています。 これは指標に基づいていないため、デモで取引してライブを行います。 リアルタイムで試してみてください。インジケーターを使用する多くのEAとは異なります。 このEAはインジケーターを使用しません
黄金の神は機械学習を使用しています。 XAUUSD 1 HRの時間枠、またはOHLCをロジックとして取引する他の時間枠で取引します。 入力のバランスのリスクを設定します。デフォルトは5%です。 取得する最大ロットを制御します。 すべての取引は停止し、利益を上げます。 このEAは積極的に取引されています。 これは指標に基づいていないため、デモで取引してライブを行います。 リアルタイムで試してみてください。インジケーターを使用する多くのEAとは異なります。 このEAはインジケーターを使用しません

他のEAを無料で入手!!!他のEAを無料で入手!!!他のEAを無料で入手!!!他のEAを無料で入手!!!他のEAを無料で入手!!!
USD Scalper MT5は、USDペアのニューラルEAです。この製品はGBPUSD、EURUSD、AUDUSD、NZDUSDのために作られています。将来、新しいペアが追加される可能性があります。
現在のペア:
GBPUSD
EURUSD
AUDUSD
NZDUSD-次のバージョンで追加されます
入力:
ストップロスに基づくリスクのリスク率(1が選択されている場合、取引あたりの最大リスクは1%です)
限定のみ!!!元の価格:999ドル
リスク警告 購入する前に、関連するリスクに注意してください。 過去のパフォーマンスは将来の収益性を保証するものではありません(EAも損失を出す可能性があります)。 示されているバックテスト(スクリーンショットなど)は、最適なパラメーターを見つけるために高度に最適化されていますが、結果をライブ取引に転送することはできません。 この戦略は常にストップロスを

EA Goldlytic use a trend built-in indicator. It's specifically designed for trading the XAUUSD (GOLD) but can be used with other assets (forex, crypto...).
The Expert Advisor opens an order based on a signal from the indicators and fixes the profit at a certain level with the ability to open order basket For best results, it is recommended to cancel the direction of trade on the EA panel on the chart Since this is a trend-following Expert Advisor, we recommend disabling the Expert Advisor in

MT5のWAPV価格と出来高インジケーターは、(Wyckoff Academy Wave Market)および(Wyckoff Academy Price and Volume)ツールセットの一部です。 MT5のWAPV価格および出来高インジケーターは、チャート上の出来高の動きを直感的な方法で簡単に視覚化できるように作成されました。 それを使用すると、ピークボリュームの瞬間と市場が専門家の関心を持たない瞬間を観察することができます 「スマートマネー」の動きではなく、慣性によって市場が動いている瞬間を特定します。 ユーザーが変更できる4色で構成されています。 赤=オファーの増加 緑=需要の増加 灰色のキャンドル=需要と供給の減少 青=スマートマネー演技 上方向への動きは強さを示します。 下向きの動き弱さを示します。 価格の方向に関係なく、最強のボリュームが上がる必要があります。 R.Wyckoffの理論に基づいて作成されたインジケーター

Very powerful indicator! converted from TradingView with upgraded alerts and added notifications. Ideal use in EAs.
Use as a supplementary Indicator to confirm your entries, but it is as good on it's own.
The indicator consists of 3 different Trend Meters and a 2 Trend Bars which are used to confirm trend
How to Use:
The more Trend meters are lit up the better =>>
-more GREEN COLOR at one bar means more confirmation to open buy trade,
- more RED COLOR signals for one bar = more


The WAPV ADH Supply and Demand Forex Indicator is part of a set of Indicators called (Wyckoff Academy Wave Market) The WAPV ADH Forex Supply and Demand Indicator for MT5 is intended to identify the winning side between buyers and sellers. Its reading is very simple, when the green line is above the red line demand is in command, when the red line is above the green line supply is in command. The more positive the green and red lines, the higher the volume input, the closer to zero or negative, t

The Weis Wave Bouble Side Indicator for MT5 is part of the toolkit (Wyckoff Academy Wave Market) The Weis Wave Bouble side Indicator for MT5 was created based on the already established Weis Wave created by David Weis. The Weis Wave Double Side indicator reads the market in waves as it was done by R. Wyckoff in 1900. It helps in the identification of effort x result, cause and effect, and Supply and demand Its differential is that it can be used below the zero axis, further improving plus operat

The Weis Wave Bouble Side Indicator for MT5 is part of the toolkit (Wyckoff Academy Wave Market) The Weis Wave Bouble side Indicator for MT5 was created based on the already established Weis Wave created by David Weis. The Weis Wave Double Side indicator reads the market in waves as R. Wyckoff did in 1900. It helps in the identification of effort x result, cause and effect, and Supply and demand Its differential is that it can be used below the zero axis and has a breakout alert showing Who is s

The VSA Candle Signal for MT5 is part of the toolset (Wyckoff Academy Price and Volume). Its function is to identify the correlation of Price and Volume in the formation of the candle. Its creation is based on the premises of R.Wyckoff , a precursor in the analysis of Price and Volume. VSA Candle Signal for MT5 assists in decision making, leaving your reading clearer and more fluid. See the images below.

The Force and Weakness Indicator for MT5 Real Volume is part of the (Wyckoff Academy Price and Volume) toolset The Force and Weakness Indicator for MT5 Real Volume was developed to identify the Strength and Weakness of volume in an accumulated way. Enabling the vision of a panorama between price and volume. The Indicator can be used as an oscillator and as a histogram. As a fantasy it has all the premises of R. Wyckoff's three laws when put together with the price: Cause and Effect, Effort x Res

User Grid MT5 is a multifunctional grid Expert Advisor designed to fully or partially automate various ideas related to grid trading (on a hedging account) . The Expert Advisor can trade on any timeframe, on any currency pair, on several currency pairs, on any number of signs. It does not interfere with manual trading, trading of other Expert Advisors, or the operation of any indicators. It allows you to adjust your settings on the fly, works only with your own positions and orders. It has a

The Force and Weakness Indicator for MT5 Forex is part of the (Wyckoff Academy Price and Volume) Toolkit The Force and Weakness Indicator for MT5 Forex was developed to identify the Strength and Weakness of volume in an accumulated way. Enabling the vision of a panorama between price and volume. The Indicator can be used as an oscillator and as a histogram. As usual it has all the premises of R. Wyckoff's three laws when put together with the price: Cause and Effect, Effort x Result and Supply a

The indicator plots a trend channel using the technique by Gilbert Raff. The channel axis is a first-order regression. The upper and lower lines show the maximum distance the Close line had moved away from the axis line. Therefore, the upper and lower lines can be considered as resistance and support lines, respectively. A similar version of the indicator for the MT4 terminal
As a rule, most movements of the price occur within a channel, going beyond the support or resistance line only for a s
FREE

This indicator is very useful for day traders or short term traders. (MT5 version) No need to calculate the number of pips manually, just look at the chart and you will see the Virtual Take Profit / Virtual Stop Loss target line and evaluate whether the entry point is feasible to reach the intended target or not.
Enter the intended Take Profit / Stop Loss pips for your trade. The indicator will display Virtual Take Profit / Virtual Stop Loss lines for you to easily see if the target i
FREE

Adds the symbols listed in Binance Future to Metatrader5
With this free file, you can list the entire list right away. You can easily install it on your demo account It is the first file to be uploaded for Binance Future Tick and is offered for free.
Tools menu / Options / Expert Advisors / You need to select Use WebRequest for listed
You can watch videos to add metatrader
FREE

The EA uses a scalping strategy on a breakout, uses innovative advanced technologies using a Neural Network. To create the EA , we used the latest advanced algorithms to find the best moments to enter the market. The EA uses many smart filters to adapt to almost any economic situation. The EA sets a protective stop order, so the trader does not have to worry that the robot will allow significant drawdowns. The adviser is safe and does not require any settings from the user, just install it on th

You can see Binance Futures data instantly in Metatrader 5 and it allows you to use all the features that Metatrader has provided to you.
You can access the data of all symbols listed on Binance Futures. Don't forget to set the timezone. Binance it's 00:00 UTC. You need to fix it according to your own country You need to pre-install the free Binance Future Symbol List plugin. https://www.mql5.com/tr/market/product/82891 After loading, it automatically downloads the data of the cryptos in the

The idea of a Value Chart indicator was presented in the very good book I read back in 2020 , " Dynamic Trading Indicators: Winning with Value Charts and Price Action Profile ", from the authors Mark Helweg and David Stendahl. The idea is simple and the result is pure genius: Present candlestick Price analysis in a detrended way!
HOW TO READ THIS INDICATOR
Look for Overbought and Oversold levels. Of course, you will need to test the settings a lot to find the "correct" one for your approach.
FREE

1. Торговая стратегия Что делает советник: Советник следит за некотоными индикаторами и при определенном условии (или условиях) помещать торговый запрос (на продажу или покупку) в зависимости от условий. Стратегия:
Используем индикатор Moving Average (скользящие средние) с периодом 8 (вы можете выбрать любой период, но в данной стратегии мы будем использовать период 8). Советник покупает, если 8-периодная скользящая средняя (далее для удобства будем называть ее MA-8) возрастает и текущая цена з
FREE
BOOM Killer Pro
Here is an excellent robot that will allow you to trade the Boom with some ease. The strategy used allows through a combination of Buy and Sell to ensure that you are always in blue. The robot is set to stop losses at -150 and this is obviously configurable. This will rarely happen if the following recommendations are followed. Some practical recommendations: Use the robot in clear upward or downward trends. Avoid using the robot in the ranges Boom 1000 recommended for robot Ti

The ADX indicator (average directional index) is a technical tool designed to measure the strength of a market trend. The ADX indicator is used for various purposes such as measuring the strength of a trend, finding a trend and a trading range, and as a filter for various Forex trading strategies.
Some of the best trading strategies are based on following the market trend. There are also strategies through which traders make profit by trading against the trend. In any case, if you can identif
Crash Killer Pro
This robot automatically assists you in trading the Crash index. However, knowledge of reading the trend is necessary to avoid losses. Launch the robot only in clear periods of trends either uphill or downhill. Some recommendations: Check trend with 1h timeframe Crash 1000 recommended for robot Timeframe 1 minute Minimum capital 300 You can use default settings or adjust.

Andrew Pitch fork is one of the most interesting string trend & Channel & Fibo technical analysis , it's like ALL in ONE tool would be very enough for you.
FYI, This indicator will expire by end of July 2022.
Using 2 Andrew pitch Forks with 2 different time frames on same chart is really very hard working and might be impossible , but with this indicator is possible now , moreover , using this method as Candle Volume based analysis give strong trust for your trade.
I assume if you are hav
FREE

What is this indicator? このMT5のインジケーターはメモとして カスタマイズしたテキストオブジェクトをチャート上のクリックした位置に作成可能 です。 メモを作成するには、ホットキーを押した後にチャート上の任意の位置をクリックして、テキストオブジェクトのテキストを変更します。 定型文のテンプレートを設定して、 ワンクリックでよく使用する単語や文章を作成することも可能 です。
How to stick a note 1. ホットキーの"N"を押してスティッキーモードを起動します。 2. メモがマウスに追従するので、適当な位置までマウスを移動します。 3. クリックしてメモの位置を固定します。 4. メモとしてのテキストオブジェクトのテキストを変更します。
How to stick a template note 1. ホットキーの"Shift+N"を押してスティッキーモードを起動します。 2. メモがマウスに追従するので、適当な位置までマウスを移動します。 3. クリックしてメモの位置を固定します。
About sticky mode
チャー

What is this indicator? このインジケーターはMT5のFX検証ソフト「 Knots Compositor 」の チャートをスクリーンショットするための拡張機能 です。 ホットキーを押すだけで、 チャートをスクリーンショットして指定したフォルダーに保存します 。 スクリーンショットを保存するフォルダーやスクリーンショットの効果音、共通の垂直線のタイムスタンプ、スクリーンショットのホットキーなど、インプットタブのパラメーターで設定を変更できます。
Features
- ホットキーを押すことでチャート全体をスクリーンショットできます。 - スクリーンショットを サンドボックスフォルダーの中の 相対パスで指定したフォルダーに保存できます。 - スクリーンショット上に共通の垂直線の日付を表示させられます。 - スクリーンショットの効果音などを設定できます。
How to open the sandbox folder 1. "Ctrl + Shift + D"を押してデータフォルダーを開きます。 2. MQL5フォルダーを開きます。 3. Filesフォ
FREE

What is this indicator? このEAはMT5のFX検証ソフト「 Knots Compositor 」の MT5で裁量トレードをシミュレーションするための拡張機能 です。 専用の注文パネルをクリックすることで、 実際のトレードのように注文して決済できるようになります 。 専用のアカウントにはレパレッジなどの設定やトレード履歴が保存されていて、レバレッジなどの設定はインプットタブのパラメーターで変更できて、トレード履歴は専用の注文パネルから閲覧できます。
How to set up
1. このEAを Knots Compositor がインストールされた全てのチャートにインストールします。 2. 通貨ペアごとにチャートを過去方向へ最後までスクロールして、その通貨ペアのヒストリカルデータを全てダウンロードします。 3. 通貨ペアがクロス通貨ペアの場合、そのペアの決済通貨と米ドルの通貨ペアのチャートでも同様に操作します 。(損益をドル建てで計算するため) 4. EAプロパティー画面のインプットタブの各パラメーターをカスタマイズします。(各パラメーターは全てのTe
FREE
What is this indicator?
このインジケーターはホットキーが押されることにより、 チャート上のオブジェクトの表示・非表示を切り替えることが可能 です。 スイッチがオンになれば、チャート上のオブジェクトが非表示になります。 スイッチがオフになれば、チャート上のオブジェクトが再表示されます。 オブジェクトタイプを指定して、 非表示にするオブジェクトを限定することも可能 です。
List of supported object types - Vertical Line - Horizontal Line - Trendline - Trendl By Angle - Cycle Lines - Arrowed Line - Equidistant Channel - Standard Deviation Channel - Linear Regression Channel - Andrews’ Pitchfork - Gann Line - Gann Fan - Gann Grid - Fibonacci Retracement - Fibonacci T

What is this indicator? このMT5のインジケーターは 作成する番号と同じキー(0–9)を押した後にチャート上をクリックするだけで任意の番号を作成可能 です。 各番号のスタイル等はインプットタブのパラメーターで設定します。 対応するホットキーを押せば、 エリオット波動などの一連の番号をチャートを連続でクリックしていくだけで作成可能 です。
How to stamp any number
1. 作成する番号と同じキー(0–9)を押してスタンプモードを起動します。 2. 番号がマウスに追従するので、適当な位置までマウスを移動します。 3. クリックして番号の作成を完了します。
How to stamp a double top/bottom pattern 1. ホットキーの"Shift+2"を押してドローイングモードを起動します。 2. 番号がマウスに追従するので、適当な位置までマウスを移動します。 3. クリックして番号の作成を完了します。 4. 2.と3.の操作を繰り返します。(バックスペースキーで1つ前に戻れます) 5. 2番を作成した時点で
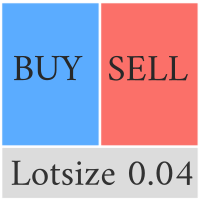
This Pro version of the LotSizePanel let's you set the stoploss with a line. Instantly the ea will calculate the lotsize based on where you drag the line on the chart. Press the "Show Line" button again, and the line dissappears and the ea reverts back to calculating the lot size from an ATR based stoploss again.
I can't see how I would ever trade manually without this panel again.
Remember that autotrading needs to be turned on to place orders with the buttons.

What is this indicator? このMT5のインジケーターは ホットキーを押した後にチャートをクリックするだけで垂直線・水平線・トレンドラインを作成可能 です。 各ラインのスタイル等はインプットタブのパラメーターで設定します。 各ラインの 作成・変更・削除はこのインジケーターがインストールされた他のチャートと同期可能 です。(時間軸を指定して同期しないことも可能です)
How to draw a vertical or horizontal line 1. ホットキーの"V"あるいは"H"を押してドローイングモードを起動します。 2. ラインがマウスに追従するので、適当な位置までマウスを移動します。 3.クリックして垂直線の作成を完了します。
How to draw a trendline 1. ホットキーの"T"を押してドローイングモードを起動します。 2. 起点を決定するために、適当な位置をクリックします。 3. 終点がマウスに追従するので、適当な位置までマウスを移動します。 4. 必要に応じて、起点の位置を矢印キーで調整します。 5. クリックして

What is this indicator? このMT5のインジケーターは ホットキーを押した後にチャートをクリックするだけでフィボナッチリトレースメント・エクスパンションを作成可能 です。 フィボナッチリトレースメント・エクスパンションの スタイルはテンプレートとして各3タイプずつ設定可能 です。 フィボナッチリトレースメント・エクスパンションの 各アンカーポイントはチャート上で最も近い高値か安値にマグネット します。
How to draw a Fibonacci retracement
1. ホットキーの"R"を押してドローイングモードを起動します。 2. 起点にしたいバーの高値か安値のあたりをクリックします。 3. 必要に応じて、2点のアンカーポイントをドラッグアンドドロップで調整します。
How to draw a Fibonacci expansion
1. ホットキーの"E"を押してドローイングモードを起動します。 2. 起点にしたいバーの高値か安値のあたりをクリックします。 3. 必要に応じて、3点のアンカーポイントをドラッグアンドドロップで調

The purpose of the inidcator is to identify the reversal point.
The blue arrow is buy signal and the yellow star is its stop loss. The red arrow is sell signal and the yellow star is its stop loss. Please note that the singal is against trend,it could be continual fail. Alert feature: if there is a signal, the indicator will send alerts of popup window,email or mobile push. Inputs: Popup Window Alert: it is false in default Email Alert : it is false in default Mobile Push Alert: it is false in

40% off. Original price: $50 Ichimoku Trend Finder is a multi symbol multi timeframe trend dashboard that helps traders to monitor and identify potential market trends from one chart. This panel scans the Ichimoku Kinko Hyo indicator in 28 configurable instruments and 9 timeframes for classic Ichimoku trend signals with a deep scan feature to scan all market watch symbols (up to 1000 instruments!).
Download Demo here (Scans only M1 and M6) Settings description here MT4 version here

A ideia do indicador é mudar de cores assim que o candle viole a banda; Caso o candle viole a banda superior, pinta o candle de vermelho, Caso o candle viole a banda inferior , pinta o candle de verde, Se o candle passar em algum momento pela média, ele assume uma cor acinzentada; Os candles que não passem pela média, nem violem a banda, apresentarão cor verde fraca, se for de alta e cor vermelha fraca se for de baixa. Projeto concebido no canal Aprenda a programar, keltner cores.
FREE

Indicator alerts for Dual Relative strength index rsi. Large rsi preset at 14 is below 30 small rsi preset at 4 is below 10 for buy bullish signals .
Large rsi preset are 14 is above 70 small rsi preset at 4 is above 90 for sell bearish signals . Includes mobile and terminal alerts. draws lines when alerts.
This indicator can help identify extremes and then the tops or bottoms of those extremes .
FREE

Starting sale price is 159$ The next price will be 299$. So grab yours now! Stallion expert advisor is the product of years of research, development, and testing. This EA uses two price action strategies for entering a position and recovering the lost trades. Every position has its specific stop-loss and take-profit but by increasing lot-size EA will recover losses. with all that said the drawdown is often fairly low. minimum balance 500$, recommended balance 1000$. minimum leverage: 1:500, rec
Tool converted from tradingview indicator. Modified version with pivot points calculated in a more intuitive way.
This tool displays relative volatility and directional trend. Excellent way to pickup diversions and reversals. Length can be lowered to 11 or 13 in settings to show price range.
Can be used to identify patterns such as parallel channels and likely direction of price action.

I always wondered if I can have multiple time frame Moving average on same chart , it is not possible , now with my Indicator is possible , As you know Moving average is lagging not leading indicator , but how can I predict future levels of it ?
I came with this idea , I hope you will like it , I made a Mirror of Moving average , the other side of specific time will be shown in the other side of the chart where the price didnt reach yet , that will help you to know the levels you can start sel
FREE

Funciona como bandas de bollinger normais. Criado por Joe Ross, é um setup de maior risco por ser contra-tendência. Pode ser usado para Day Trade, Swing Trade e Position. Para identificar, é necessário inserir no gráfico as Bandas de Bollinger, com uma Média Móvel Simples de 20 períodos e largura (desvio) 2. Verifica-se um fechamento de determinado candle abaixo da banda inferior de Bollinger. Se o próximo candle fechar dentro das Bandas, marca-se a máxima dele. O rompimento dessa máxima será o
FREE

Supported currency pairs: EURUSD,USDCAD, GBPUSD, EURGBP Recommended timeframe: M15
The EA should run on a VPS continuously Setting Fixed Lot - fixed frist trading lot StopLoss, in pips - stop loss value TakeProfit, in pips - t ake profit value CCI: averaging period, Averaging period for calculation
CCI: type of price, Use martingale, martingale Mode Martingale coefficient, martingale multiplier Order Maximum number of multiplications
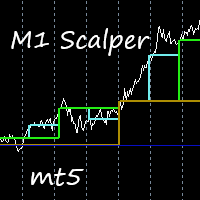
This indicator is excellent for scalping on the M1 or M5 chart. Uses a special algorithm for the lines. No need to set up the indicator. Does not feature any alerts and is best used manually after visually confirming the line displays. NB: Make sure to download M1 history before testing and use.
How to use: Simply attach to M1 or M5 chart. Zoom chart out completely. Sell when all lines above the white line (PriceLine). Sniper line crosses above white line. Buy when all lines below the white li

Optimize before back test or use.
New Wave trades trends. 3 moving averages and trends up and trends down, buying and selling. Finding the optimal parameters for yourself, you will need to optimize in the platform. A set file is in the comments to use in the test to show the Expert. Optimize inputs according to your asset and risk. I optimized this with EURUSD on a 1 hour time frame. Percentage of balance is used to trade by.

This indicator gives you arrows, two SR lines and a golden trend line. Uses a special trend algorithm to plot the arrows, combined with support and resistance inputs. Perfect for channel trading. Features alert functions.
Parameter TrendArrowPeriod. Parameter TrendLinePeriod. (Change to your preference) How to use: Simply attach to any chart with default settings. Zoom in the chart, to see the two blue SR lines and arrows more clearly. When the blue SR line is below the price, golden trend line

The Price Elevator indicator is developed to help you figure out the general long-term trend of the market. If the price is above the Green separator line, this is a clear indication the bulls are in control. Similarly, the bears are in control if the price continues to trend below the red separator line. Download Price Elevator MT4
Trend Re-entry In this case you would plan your buy entries above the green dotted box (make sure to set the Buy / Sell Retracement Floor=30). The SL should be
Este EA foi desenvolvido para o mercado financeiro Brasileiro, porem, com os Parâmetros corretos pode ser aplicado a todos ativos disponíveis na metatrader inclusive forex e metais. Não julgue o resultado com os parâmetros padrão, entenda que os parametros são para validação de diversos ativos, por isso cada ativo tem um valor que se enquadra na realidade do contexto do mercado. Qualquer duvida, pode me chamar no Telegram @andrefonsecaloureiro ou no email vendas.mercadocapital@gmail.com

Supported currency pairs: EURUSD,USDCAD, GBPUSD, EURGBP Recommended timeframe: M15
The EA should run on a VPS continuously Setting Fixed Lot - fixed frist trading lot StopLoss, in pips - stop loss value TakeProfit, in pips - t ake profit value RSI : averaging period, Averaging period for calculation
RSI : type of price RSI :RSI value calculation
Use martingale, martingale Mode Martingale coefficient, martingale multiplier Order Maximum number of multiplications
Equilibro B3 Trader é um robô de negociação versátil projetado para a bolsa de valores brasileira B3, capaz de operar no mini-índice WIN e mini-dólar WDO, bem como em commodities (como milho e boi gordo) e ações (fracionadas ou não). O robô utiliza uma estratégia poderosa baseada em forças e retrações para fazer entradas nos trades, por meio de uma avaliação de 3 médias móveis simples, que podem ser configuradas de acordo com as preferências do usuário. Inclui-se também filtros de entrada por â

The Spots Indicator can be used for Entering and Exiting your trades based on the common candlestick patterns such as: engulfing, hanging man, doji etc. It is designed to publish desktop and mobile notification every time a signal is triggered. However, it is worth noting that this indicator is recommended to be used with other indicator for confirming the entries. It is best to use it with the Investment Castle Trend Lines indicator and the Supply and Demand indicator .
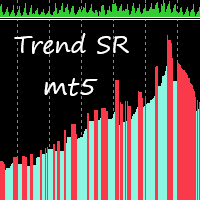
This indicator takes input from Support and Resistance levels, combined with a special trend filter. Easily spot tops and bottoms, and trade with more confidence. Great for scalping. This indicator can be used on all time frames and pairs. Features alert function.
No need to set up the indicator.
How to use: Simply attach to any chart. Zoom chart out completely. Red histogram line color = Selling opportunities. Blue histogram line color = Buying opportunities. See pictures below. To spot high
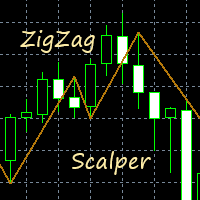
This indicator gives you a modified ZigZag, combined with a trend filter. Great for scalping. Perfect for channel trading. Features alert functions. No need to set up the indicator. How to use: Simply attach to any chart. Buy when the golden line stops below the price. Sell when the golden line stops above the price. It also helps to keep the audible alert set to true. Best results when checking two or more timeframes before entering trades on the lower time frames. Use as you see fit for your

This Expert trades macd crosses , using ADX and AC. Designed for 4hr EURUSD trading but able to trade major pairs. Code is designed for speedy metatrader optimisation using open price testing as ea uses open prices on indicators used. EA identifies trends with specific momentum and exits using the ADX or stop loss. Please optimise using out of sample data. preset at 0.1 lots best to start with 0.01 lots.

中央ピボット範囲レベルは、中央ピボットポイントの周囲に形成されます。
中央ピボットに関連するこれらのレベルは、多数の市場行動と考えられる結果を決定するために使用できます。
中央ピボットからの距離、および前日のレベルと比較して新しいレベルが形成する価格を使用して、次の日のトレンドの方向と強さを決定できます。
セントラルピボットレンジはサポートとレジスタンスとして機能し、ストップロスを置く場所のガイドを提供し、価格の継続的な動き/ブレイクアウトのシグナルを提供します。 グループチャット: https://www.mql5.com/en/users/conorstephenson セットアップのアドバイスと無料のエキスパートアドバイザーについては、購入後に私に連絡してください! 主な機能 追加のピボットポイントとフィボナッチレベルを備えた中央ピボット範囲フォーカスインジケーター。 ピボットポイントを描画します-R1、R2、R3、S1、S2、S3。 フィボナッチレベル-0、0.23、0.38、0.50、0.61、0.78、1を描画します。 アラート機能。 -MT4モバイルアプリを
FREE

DreamCatherEA -米国セッション終了時の高度なスキャルピング戦略です。エキスパートアドバイザーはトレンドスカルパーであり、メイントレンドがロールバックしたときに取引が開始されます。一連のシンプルなアルゴリズムにより、市場のさまざまな段階で長期間にわたって安定した結果を得ることができます。このシステムは長期的な成長に焦点を合わせています。 EAは、グリッドやマーチンゲールなどの危険な資金管理システムを使用していません。位置ごとに固定ストップロスを使用します。 EAは20年以上にわたってデータでテストされており、その間、最も不安定な期間に耐えることができます。コンピューターを24時間年中無休で正常に動作させる機会がない場合は、VPSサーバーサービスを使用することをお勧めします。 ライブシグナル: https://www.mql5.com/en/users/delmare/seller MT4バージョンはこちらから入手できます: https://www.mql5.com/en/market/product/80988 製品の包括的な説明、入力の説明、および FAQ については、

制度レベル/銀行レベル...心理レベル/四半期理論。
このインジケーターは、「000、200、500、800」のレベルで自動的に描画します。私が「機関レベル」と呼んでいるものは、チャートに「000、250、500、750」のレベルを描画することもできます。
機関投資家レベルの取引/四半期理論をどこで学んだかに応じて、それらを異なる名前として知っているかもしれません。本質的にコアアイデアは、これらのレベルがほとんどの外国為替市場で強力なサポートとレジスタンスポイントとして機能することです。
グループチャット: https://www.mql5.com/en/users/conorstephenson ご不明な点がございましたら、ご購入後のセットアップ・操作アドバイスをご連絡ください、よろしくお願いします! 主な機能
現在の価格の上下に「000、200、500、800」または「000、250、500、750」の数字で長方形または線を便利に描画します。 アラート機能。 -MT4モバイルアプリを使用して番号に達したときに通知することができます。 カスタマイズ可能な線の
FREE

McDuckEA MT5 – works on the martingale strategy. It shows good results when trading on Gold, XAUUSD. Martingale orders are opened with a step from each other and only after the opening of a new bar of the set timeframe. During the release of important news, the adviser suspends the opening of new orders. The EA has an internal risk control system and, if the risk is exceeded, it starts to exit the market, closing extreme positions in pairs. The level of loading of the deposit determines the risk

“Practically everyone can forgive us for honesty: and, say, an insufficiently professional game, and even insufficiently professional poetry. There are many examples of this. But when honesty disappears, nothing is forgiven.”
Golden Rings - Forex financial robot offers options for finding profitable trades even in unstable markets when the current trend direction is unclear. It will follow the best trend to maximize profits and reduce the chances of possible losses.
To work in MetaTrader 4

この指標は、価格系列のローカルの高値と安値を使用します。極値を強調表示した後、それらの値は平滑化されます。このおかげで、外部と内部の2つのチャネルが構築されます。価格変動が厳密に線形トレンドに従う場合、内部チャネルは制限を示します。外側のチャネルは、対数トレンドの価格変動の境界を示しています。 チャネルを計算した後、インジケーターは実際の価格変動を分析し、ポジションの開始と終了に関する推奨事項を提供します。青い点-購入ポジションを開く、赤-売りポジションを開く。対応する十字架は、もしあれば、特定の位置を閉じることを推奨しています。すべての信号が同じ強度と精度を持っているわけではないことを覚えておく必要があります。場合によっては、正しい方向への価格変動がすぐに終了するため、大きな利益を得ることができなくなります。信号が損失につながる状況もあります(そのような信号の例は最後の図に示されています)。これらの機能を考慮して、次のことをお勧めします-変動テイク利益を使用します。その値は、現在の市場の状況に応じて変更できます。また、不採算ポジションをクローズする合図が出る前にクローズするようにス

ユーティリティは、マウスホイールをスクロールすることによって、任意のイ このユーティリティをインストールし、標準の端末配信から任意のインジケータのインターフェイスを変更することができます。 カスタム指標や"市場"で購入した指標には、ユニバーサルスクローラーユーティリティがあります。 Universal Scroller
操作の原則 ユーティリティは、マウスホイールをスクロールして変更することにより、選択したパラメータのいずれかを制御します。 スクロールモードの有効化は、ボタンの上にカーソルを置くか、ボタンをクリックすることで有効になります。 ボタンは自動的にチャート上に設定されます。 少なくとも一つの整数パラメータを持つすべての指標は、このユーティリティに適しています。
インストール チャート上にインジケーターをロードし、制御するパラメータの値を覚えておいてください。 整数である必要があります。 "標準スクローラ"をチャートにロードします。 設定ウィンドウで、両方のインジケータを同期します-これを行うには、パラメータフィールドにインジケータの値を入力します。 たとえば、選択し
FREE

ユーティリティは、マウスホイールをスクロールすることによって、任意のイ インジケーターを購入またはレンタルした場合は、このユーティリティを使用してインターフェイスを変更できます。 少なくとも一つの整数パラメータを持つ任意の指標がこれに適しています。
あなたが最初にそれがどのように動作するかを試してみたい場合は、標準的な端末配信からインジケータを制御するために無料の Standart スクローラーインジ
操作の原則 ユーティリティは、マウスホイールをスクロールして変更することにより、選択したパラメータのいずれかを制御します。 スクロールモードの有効化は、ボタンの上にカーソルを置くか、ボタンをクリックすることで有効になります。 ボタンは自動的にチャート上に設定されます。 長いローディングの表示器のために、ボタンを押してスクロールモードを使用して下さい。 このモードでは、インジケータは、ボタンがオフになった後にのみロードされます。
インストール チャート上にインジケーターをロードし、制御するパラメータの値を覚えておいてください。 整数である必要があります。 ユニバーサルスク

このインジケーターは、フィルターされた価格情報を表示します 64色の範囲を使用したローソク足チャートの形式で。 価格変動の方向性の強さを判断するのに最適です。 このインジケーターには設定がありません。 64色すべてがすでにプログラムに含まれています。 青い色が明るいほど、購入する運動の力が強くなります。 そして赤い色が明るいほど、販売する運動の力が強くなります。 /////////////////////////////////////////////////////// /////////////////////////////////////////////////////// この指標が取引の成功に非常に役立つことを願っています。 幸運を。

ROC価格ヒストグラムアラートは、現在の価格と特定の期間前の価格との間の価格の変化率を測定する、勢いに基づく技術指標です。 ROCはゼロに対するヒストグラムでプロットされ、価格の変化が上向きの場合はインジケーターが正の領域に上向きに移動し、価格の変化が下向きの場合は負の領域に移動します。
ROC期間を計算する際の主なステップは、「計算された期間」の入力設定です。短期のトレーダーは、9や12などの小さな値を選択できます。長期投資家は、200などのより高い値を選択できます。「計算された期間」は、現在の価格が比較されている期間の数です。値が小さいほど、ROCは価格の変化により迅速に反応しますが、それはまた、より多くの誤ったシグナルを意味する可能性があります。値が大きいほど、ROCの反応が遅くなりますが、信号が発生したときの方が意味があります。
このタイプの技術指標には、プラス面とマイナス面の両方があります
ポジティブ ROC価格オシレーターは、ゼロレベルの中点に対して設定されたテクニカル分析で使用される無制限のモメンタムインジケーターです。 ゼロを超えるROCの上昇は通常、上昇

The TickCounter indicator counts up and down ticks on each new bar.
The calculation starts from the moment the indicator is placed on the chart.
Histogram bars represent: Yellow bars - total number of ticks; Blue bars - ticks UP; Red bars - ticks DOWN. If the blue bar is not visible, then there are more down ticks and the red bar is displayed on top of the blue one (the red layer is above the blue one). MT4 version: https://www.mql5.com/en/market/product/82548
Each reinitialization of th

Watermark Centralized
Adds a watermark centered with the asset name and chosen period.
It is possible to override the font type, font size, font color and separator character.
The watermark is positioned behind the candles, not disturbing the visualization.
It has automatic re-centering if the window is resized.
Hope this indicator helps you, good trading ;)
FREE

TradeMirrorは、MT4/MT5プラットフォーム用のトレードコピーEAです。 TradeMirrorを選ぶ理由 金融ソフトウェアにはセキュリティ、安定性、プライバシーが重要であることを理解しているため、この3つの要素を細部にわたって固めるために、さらなる努力を重ねています: 操作が簡単なユーザーフレンドリーなグラフィカルインターフェースを提供 プライバシーとセキュリティを重視し、注文の分配にプライバシーが要求される様々な金融シナリオに適していること 注文の正確な複製、ミリ秒単位での配信 フルプラットフォーム、MT4またはMT5をサポート システム状況のインテリジェントな認識、メール通知で取引の安全性をガード コア機能一覧 フォローアップソフトは、機能が多ければ良いというものではないので、厳密な需要分析の後、プログラムを合理化し、最終的に以下のコア機能を保持しました。 マルチコネクション メール通知機能 ロットスケーリング 信号のフィルタリング 逆指値注文 テイクプロフィット/ストップロスのリセット 無料デモ Trademirrorを購入する前に、いつでも無料のデモを試すこと

This EA combines signals from Keltner's channels and other indicators, executes buy and sell against the trend of the selected time frame, great assertiveness with selection of specific parameters for each asset. Ideally, you should test the parameters in the backtest to validate the strategy. Enjoy the best that technology has to offer you. If you are interested in my individual presets please contact us here in the chat or send an email, vendas.mercadocapital@gmail.com.
MetaTraderマーケットは、開発者がトレーディングアプリを販売するシンプルで便利なサイトです。
プロダクトを投稿するのをお手伝いし、マーケットのためにプロダクト記載を準備する方法を説明します。マーケットのすべてのアプリは暗号化によって守られ、購入者のコンピュータでしか動作しません。違法なコピーは不可能です。
取引の機会を逃しています。
- 無料取引アプリ
- 8千を超えるシグナルをコピー
- 金融ニュースで金融マーケットを探索
新規登録
ログイン