YouTubeにあるマーケットチュートリアルビデオをご覧ください
ロボットや指標を購入する
仮想ホスティングで
EAを実行
EAを実行
ロボットや指標を購入前にテストする
マーケットで収入を得る
販売のためにプロダクトをプレゼンテーションする方法
MetaTrader 5のための新しいエキスパートアドバイザーとインディケータ - 77

Optimize for time frame and asset before back test and use, use last year or monthly for parameters. XAU/USD 1 HR recommended. Parabolic works on any asset or time frame. This EA uses parabolic sar as the signal. Percentage of margin is used for entries. So for low risk it would be 1% of margin and for medium risk it would be 5-10% and high risk would be above these amounts. Also taking into account the smaller time frame or larger time frame + asset for risk management assessment.
Risk

Robot Trading Gold is a fully automated trading system that doesn't require any special skills from you. Just fire up this EA and rest. You don't need to set up anything, EA will do everything for you. EA is adapted to work on small deposit over $100 for good work.
Timeframe: 15 Min
Currency pairs: XAUUSD PROFITABILITY AND RISK The expected estimated profitability according to the backtest data is about 300% - 600% per year. The expected maximum drawdown is about 90% or more . Attention!
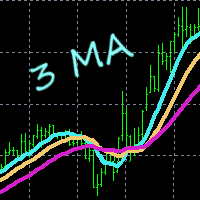
This indicator gives you a modified version of three Moving Averages. Great for scalping. Does not feature any alerts, and is best used manually after confirming multi line displays. Settings: Period1 Period2 Period3 Period4 How to use: Simply attach to any chart with default settings. Buy when the 4 lines converge below the price. Sell when the 4 lines converge above the price. Take note of the slope of Period4. See example pictures below. Best results when looking at three or more time frames

Seven copies left at $99 USD. Next price is 149 USD . set file Smooth Lift is an indicator-based trading system that includes 7 indicators, including trend indicators, volume indicators and indicators of possible price movement strength. They are used to confirm the analysis of the main Smooth Lift trading system. The trading is performed on 24/5. The strategy was developed taking into account the movement of the currency pair USDCHF and the best trading performance is on it.
Recommendations:
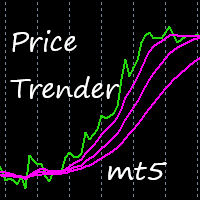
This indicator uses a special algorithm to plot the 4 lines for trading. Great for scalping. Features alerts. Settings for trend filters. How to use: Simply attach to any chart with default settings. Buy when the three pink lines converge below the green line. Sell when the three pink lines converge above the green line. Best results when looking at three or more time frames, and the three blue lines have just converged below or above the green line.
Use as you see fit for your strategy. Best r
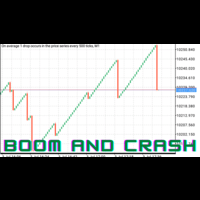
The BoomAndCrashEA , based on vector machine learning, is an advanced trading tool that uses the latest advances in computing technology to analyze the forex market and predict future price movements. The Expert Advisor will use vector machine learning to learn huge amounts of historical data and quickly and efficiently detect patterns in the market. It will use a sophisticated and complex proprietary algorithm which uses advanced mathematical calculations to solve complex problems and optimize
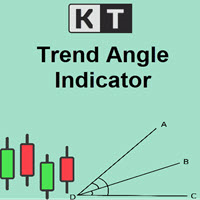
The KT Trend Angle helps to identify ranging and trending markets. The idea is to only enter a trade following the market trend if the slope is steep enough.
An angle is the ratio of the number of bars to the number of points: The bars mean the time offered by standard (M1, M5, etc.) and non-standard time frames. Points represent the unit of price measurement with an accuracy of 4 or 5 decimal places.
Input Parameters Period: An integer value to define the intensity of angled trendlines. A

2 copies left at 49 USD. Next price is 99 USD . set file
- This is a very aggressive trading strategy, based on a modified MACD indicator. It is used to analyze the anomalous zones of the market + author's methodology to restore the critical movement.
The strategy was developed taking into account the movement of the currency pair USDCHF and the best rates of trade just on it.
Recommendations:
- H1 USDCHF - Leverage of 1:500 or higher (ideally 1:1000 or 1:2000) - Minimum deposit 100 uni

KT Forex Blau Balance combines elements of momentum and volatility. It helps you identify entry and exit points.
Blau Balance consists of two moving averages (a slow-moving average and a fast-moving average) intersecting key transition points in market price. The indicator turns green or red when one is above or below the other, signaling to buy or sell trade signals.
It can be used in currency pairs and other markets that your MT4 or MT5 platform supports. Both short-term and long-term tra

The KT De Munyuk is a trend-based indicator that uses Parabolic SAR to identify the market direction. The indicator shows the PSAR in the form of green/red dots using a separate window. Buy Signal: When a green dot appears after a series of at least three red dots. Buy Exit: When a red dot appears on the current or next higher time frame. Sell Signal: When a red dot appears after a series of at least three green dots. Sell Exit: When a green dot appears on the current or next higher

In MetaTrader, plotting multiple horizontal lines and then tracking their respective price levels can be a hassle. This indicator automatically plots multiple horizontal lines at equal intervals for setting price alerts, plotting support and resistance levels, and other manual purposes. This indicator is suitable for Forex traders who are new and looking for chances to make quick profits from buying and selling. Horizontal lines can help traders find possible areas to start trading when the

KT XMaster Formula is a buy & sell signal indicator that works magically on most of the timeframes and currency pairs when used correctly.
The indicator uses calculations based on moving averages, RSI, and MACD. It is usually appropriate for scalping and trend trading - whether you are a novice or an experienced trader, the signals generated by this indicator are simple to understand and implement.
Overview The indicator comprises green and red dots arranged in wavy lines. These dots corre

Overview This expert advisor is based on statistic model created using historical data. Our model lead to prepare parameters to drive Martingale strategy. It plays on USDCAD pair. To work proper with full strategy EA should be able to open total positions of 3.62 lots (sum of all possible open positions at the same time) and some margin for safety. For example it can be approximately at least 1200GBP with 500:1 leverage on account. It must be able to play 0.01 lots positions. Screenshots presen

ボラティリティ アナライザーはモメンタム インジケーターであり、タイトな取引範囲での値固め後に価格が大きく上昇する傾向を利用します。このインジケーターは、スクイーズが発火したときの動きの予想される方向を示すために、運動量オシレーターも使用します。このヒストグラムはゼロ ラインの周りで振動し、ゼロ ラインより上のモメンタムの増加はロングを購入する機会を示し、ゼロ ラインを下回るモメンタムはショートの機会を示す可能性があります。
期間限定オファー : インジケーターは、わずか 50 $ で無期限でご利用いただけます。 ( 元の価格 125$ )
主な機能 横向きトレンド検出器。 低揮発性検出器。 強気の高値と弱気の高値のボラティリティ検出器。 すべての時間枠とすべてのペアで作業します。 ポップアップ アラートとプッシュ通知アラートを提供します。
コンタクト 質問がある場合、またはサポートが必要な場合は、プライベート メッセージでご連絡ください。
警告 すべてのインジケーターとツールは、公式のメタトレーダー ストア (MQL5 マーケット) からのみ入手できます

SHOCK DEAL! --> VERY LIMITED COPIES AT THIS PRICE !!! + BONUS -> PREMIUM EA! For Settings, Instructions and LIVE Results Click Here! Forex Trend Detector is an automated trading strategy which is developed to follow the money… or "follow the market impulse" resulting in reliable and consistent performance. I built Forex Trend Detector on a trading strategy that works!
I didn't use exotic or speculative techniques – instead i examined the strategies that professional fund managers…or what ins

ピン バー ディテクターは、チャート上のピン バーの価格行動パターンを見つけるインジケーターです。ピン バーは、「ピノキオ バー」のショートカットです。これは、ドラゴン フライ童子、墓石童子、ハンマー、倒立ハンマー、ハンギング マン、シューティング スターなど、上部または下部に高い影と非常に小さなボディを持つ、日本のローソク足に代わる古典的なバー パターンです。 .
期間限定オファー : インジケーターは、わずか 50 $ で生涯ご利用いただけます。 ( 元の価格 125$ )
主な機能 強気のピンバー検出器。 弱気ピンバー検出器. 100% 無料インジケーター。 すべての時間枠で作業します。 すべてのペアで作業します。
コンタクト 質問がある場合、またはサポートが必要な場合は、プライベート メッセージでご連絡ください。
警告 すべてのインジケーターとツールは、公式のメタトレーダー ストア (MQL5 マーケット) からのみ入手できます。
プレミアム指標 MQL5 プロファイルにアクセスすると、すべての無料およびプレミアム インジケーターを見つけることがで
FREE

About the indicator: DALA Forecast is a universal tool for predicting the dynamics of time series of any nature. For prediction, modified methods of nonlinear dynamics analysis are used, on the basis of which a predictive model is built using machine learning methods. To get the trial version of the indicator, you can contact me in private messages.
How to use the indicator: Apply the indicator to your chosen financial instrument or indicator with the settings you need. The prediction will b
FREE

トレーダーは、取引を開始するたびに、自分が得たリスクと利益の機会を判断できるように、自分が行った取引の利益とリスクを知らなければなりません。 この計算を手動で決定することは、特に多くのオープン トレードを行う場合、非常に面倒な場合があります。
Trading Panel Katana は、トレーダーがこれらのニーズを満たすのに本当に役立つユーティリティ ツールです。 市場または保留中の取引を開始し、ロット、ピップ、価格ポジション、米ドルの金額、リスクの割合を自動的に設定できるようにします。
このユーティリティは、正確で使いやすいように設計されています。
トレーディングパネルカタナの主な特徴: - 市場でのオープントレードと保留中 (買いストップ/買いリミット/売りストップ/売り保留中) - ロットサイズ、ピップ、価格、米ドルでの利益損失、および残高からのパーセンテージの決定を自動的に設定できます - 始値、SL、TP の線引きオプション - ラインをドラッグして、価格、SL、または TP を設定します - ペア、スプレッド、ピップバリュー、バランス、エクイティに関する

Índico Tech のコピー トレーダー: MQL5 市場で最高のコピー トレーディング ツール!
独自の機能:
- マジック ナンバーを使用して EA をコピーするための管理。マスター アカウントが複数の戦略をロードできるようにします。 これにより、接続されたスレーブ アカウントが受信シグナルと取引量を個別に処理できるようになります。 - 固定バッチまたはマスター アカウントの乗数係数でシステムをコピーします。 - 注文乗数: エキゾチック CFD の流動性制限を解決します。 - ストップロスを隠す機能とテイクプロフィット機能を隠す: 品質と価格執行を大幅に改善します。 - シンボル コレクター: B3 から Forex に、またはその逆に取引をコピーします。30 シンボルを制限します。 - ローカル コピー トレーダー。 ---> バージョン 1.03 アップデート ノート: - プログラムのレイアウトの変更。 - 「配列」のバグ修正。 - ネッティング アカウント ロック。
Índico Tech の Copy Trader v1.0 MT5 は、MT5 アカウ

Violence Great WallはMT 5知能取引ロボットです。それは価格の支持と圧力位置を考慮して、将来の段階化予測、正確な開倉ポイント、および安定した止損位置を提供しています。 主な取引品目は金!念のため、3000ドル以上の資金を提供することをお勧めします。レバレッジは1:500以上をお勧めします。 開倉は極めて正確であるが、開倉要素が複雑であるため、EAの長時間安定した運行を維持しなければならない。 下図には倉庫開きの利益状況、多要素多周期結合の考慮、同時に一定のボリンジャーバンド指標要素があり、ボリンジャーバンド指標は随意に変更可能なオプションを提供し、ユーザーは自分の利益目標、カスタムボリンジャーバンドを結合することができ、ユーザーも変更をしないことができ、本EAも同様に高精度に請求し、特定の相場に遭遇すると大量の利益を奪うことができる。 本EAはMT 5上でのみ動作する権限を持ち、他のサードパーティ製ソフトウェアの動作は提供しません。 強い変動相場に遭遇した場合は、手数を下げることをお勧めします。

Orion は、まったく新しいアルゴリズムで更新されました。今のオリオンは野獣だと胸を張って言えます!あなたが今日できる最も賢明な決定は、オリオンを手に入れることです。後で私に感謝します.
Orion は、比類のないリスクと報酬の比率を含む、実績のある戦略を使用する最適な自動化システムを運用する多通貨 Expert Advisor です。それは、時間と詳細、そしてそれを作成するためにかかった専門家の数により、アルゴリズム取引に革命をもたらす AI の 1 つです。最大出力を得るために4ペアを中心にトレードし集中するようにしました。
MT4 バージョン: https://www.mql5.com/en/market/product/86366
EA の入力と FAQ の詳細な説明については、こちらをクリックしてください: https://www.mql5.com/en/blogs/post/750491
特徴:
1 時間足のチャート ローソク足に基づいて、4 つの異なる通貨ペアを取引します。 このアルゴリズムは、マーチンゲールやグリッドなどの危険な資金管理方

The Roll the Field indicator displays signals in a simple and accessible way in two colors (when to buy and when to sell is determined by changing the color). Knowing the entry point of each currency is very important for every forex trader. The intelligent algorithm of the indicator accurately determines the trend, filters out market noise and generates entry signals.

Point discussion is a fundamental technical indicator - an algorithm that allows you to obtain data on future prices using quotes data for a certain period of time specified in the indicator settings. The technical analysis indicator Point discussion is based on a special formula. It is with its help that the calculation takes place. The indicator is well suited for determining a reversal or a large sharp jerk to one side, thanks to it you will know when this happens, it will notify you by the a

A professional tool for trading - the divergence indicator between the AO and the price, which allows you to receive a signal about a trend reversal in a timely manner or catch price pullback movements (depending on the settings). The indicator settings allow you to adjust the strength of the divergence due to the angle of the AO peaks and the percentage change in price, which makes it possible to fine-tune the signal strength. The indicator code is optimized and is tested very quickly as part
FREE

A professional tool for trading - the divergence indicator between the AC and the price, which allows you to receive a signal about a trend reversal in a timely manner or catch price pullback movements (depending on the settings). The indicator settings allow you to adjust the strength of the divergence due to the angle of the AC peaks and the percentage change in price, which makes it possible to fine-tune the signal strength. The indicator code is optimized and is tested very quickly as part
FREE

the fundamental technical indicator Informative Trend, which allows you to assess the current market situation in order to enter the market of the selected currency pair in a trend and with minimal risk. It basically uses the process of identifying the rate of change in price growth and allows you to find entry and exit points from the market.
The indicator was created on the basis of the original indicators for searching for extreme points and is well suited for determining a reversal or a l

The effectiveness of the adviser is confirmed by trading on real accounts. Signal https://www.mql5.com/ru/signals/1714293 The Invest Time Classic uses many different strategies, including mean reversion, trend following, and a smart grid system with variable take profit levels that adapt to market conditions. Unlike conventional grid systems, where the risk is very high compared to the potential profit, Invest Time Classic will only open trades under suitable market conditions, which is confirme

Core SCB this bot works without indicators , the principle of trading is for buying and selling at the same time .
It should be noted that no matter how well the indicators show, there is always a moment when the indicator can give a signal to enter at the peak of the beginning of the trend in the other direction. Thus, the essence of using the indicator is completely reset. Therefore, one of the options for getting out of the situation is to completely abandon indicators and constantly work

This indicator paints any Inside Bar found on the attached chart in a Dark Gray Colour with Black Borders and Wicks. If there are multiple consecutive Inside Bars, then they would also be successively painted Dark Grey with Black Borders and Wicks as well. You may opt to change the colours set by default in order to better contrast with your chosen background and chart colours. I made this Indicator out of necessity as my trading required it. But I know there may be others out there who may need

The movement exhaustion is a color rule that helps indicate when the movement will revert its direction. The darker the color, the greater the probability to revert. The indicator is based on the price statistic. Works on every timeframe, every instrument. Five color options: 0. Natural movement. (Gray) 1 - 4. Movement exhaustion (Yellow to maroon) The trader can use it as reversal or exhaustion signal. In a trend following trade it can be used as an exhaustion signal, indicating the movement ca

Here’s the problem: the default zigzag indicator given in MT5 trading platform does not really capture the most of the highs and lows on chart do draw zigzags. On chart below, notice that some of ther high, low of price have been missed to draw zigzags by this default zigzag indicator (picture 1). It is not so apparent until you compare default zigzag indicator to this SwingZZ indicator. Have a look on picture 2 and 3. The swing zigzag indicator is best because it captures most of the swing high
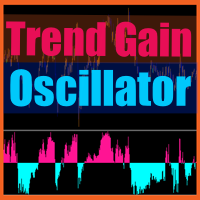
Trend Gain Oscillator - is the manual system for defining trend phase(bullish/bearish). When histogramm is pink - market is up/bullish and when histogramm is blue - market is down/bearish. Arrows is plotted on zero cross, in case if additionally market has power for future movement. Main inputs are : trendPeriod- main indicator's period for trend calculation; trendPowerPeriod - period for market's power(volatility+volume) calculation ; trendPowerTrigger - arrows is not plotted if market's power
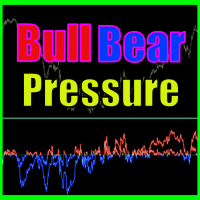
Bull bear pressure indicator - is the manual system which defines bull/bear market. When lines is above zero level - market is strong bullish, and when lines below zero level - market is bearish. First line represents global trend and second one are smoothed and shows local market's mood. Main inputs are : MainPeriod- main indicator's period for global trend calculation; SignalPeriod - period for smoothed and shows local market's trend; Main Indicator's Features Signals are not repaint,non-late

ROC acceleration-deceleration is the manual system for medium-term scalping. Indicator based on custom ROC system which defines bullish/bearish market and especially acceleration-deceleration of tendention in the market's main direction. Buy arrow is plotted during bearish market when current trend decelerates and sell arrow is plotted during bullish market when current trend decelerates. Main Indicator's Features Signals are not repaint,non-late or disappear(exept cases when system recalculat

ASI fractals with DPO filter - is the manual trend-following system. ASI fractals are the base of every trend. System plots an arrow when fractal pattern appears on ASI indcator and DPO direction is same as incomming signal. System has several ways of usage : simply indicator, indicator with suggested arrows, arrows with single targets and arrows with common profit targets. User can simply switch indicator's modes directly from chart. Main Indicator's Features Signals are not repaint,non-late or
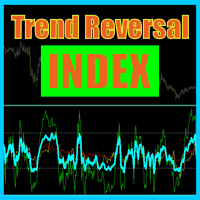
Trend reversal index - is the manual trading system that works with overbought , oversold levels and reversal patterns. Sell arrow is plotted when indicator is higher than overbought level and here forms reversal pattern, all pattern points located higher than overbought level. Opposite with buy arrow : ndicator is lower than oversold level and here forms reversal pattern, all pattern points located lower than overbought level. Main Indicator's Features Signals are not repaint, late or disapp

Theoretical Foundation The Keltner Channels are channels ploted using volatility deviations above and bellow a moving average. The indicator is an excellent tool to help the trader build trend and mean-reversion strategies. Parameters The Orion Dynamic Keltner allows the user to select the Volatility Calculation Type, being ATR or Average Range (not considering price gaps). Also, the user can select the Calculation Period, Number of Deviations, Moving Average Mode and the Moving Average Ca

Theoretical Foundation Similar to the well-known Average True Range (ATR), the Average Range indicator is a volatility measure that is calculated using only the range of the bars (high – low), not considering the Gaps, as with the ATR. The Average Range can be very useful for day traders as it allows one to get the measure of the volatility of the last N bars. Parameters You can select the calculation period of the indicator.

In this indicator, Heiken Ashi candles are calculated with the most optimal method. You can also customize the results by adjusting the amount of period and method input. But the most important advantage of this indicator is the adjustment of the time frame value. You can use this to calculate the Heiken Ashi chandels to See in time frames with lottery in the lower time chart. In this case, you get the best signal to buy or sell using two or more Heiken Ashi indicators with different timeframes
FREE

Early WPR divergence - is the manual system to define trend reverse. Green histogram shows main trend, Orange one - shows "short"/local trend. System is looking for clear divergence between both trends and pick up position(plot buy/sell arrows). When main trend is up, but local trend reverses to bearish trend and get's big power - sell arrow is plotted; When main trend is down, but local trend reverses to bullish trend and get's big power - buy arrow is plotted; Main inputs are : mediumTrendPe

Optimized from 2004 to 2022. Optimize further after this date, use monthly or yearly. Experts need optimizing as markets develop new ranges. New Age Bot trades XAU/USD on 5 minute charts. Entry - Bollinger bands and trend trading reversals is used for entries. Stops - Trailing stops are used with ATR. Money - lots Bollinger band period - 20 MA period - 100 Deviation - 2.0 Symbol for build - XAU/USD Time frame for build - 5 minute charts Risk Disclaimer Trading foreign exchange on margin carri
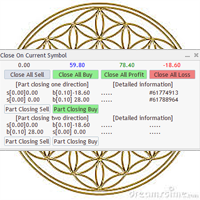
Utility / EA to simplify the exit from the drawdown. Allows you to gradually exit the drawdown correctly, reducing the volume of losing trades. At the same time, profitable trades opened on the same symbol cover losing trades in whole or in part. The volume of partial closing of a losing trade is calculated automatically. Trades opened both in one direction and in the opposite direction are supported. Position Management Closing positions only for purchase, only for sale, only profitable, only

Robô Davi I by Êxodo Capital is a professional system for traders created for the MT5 platform and optimized to work with MINI FUTURE INDEX (WIN) at B3 in BRAZIL.
The system uses bias algorithms. After identifying the trend, the position is opened and the robot conducts the trade through a trailing stop that will be driven by the 13-period average. Maximum GAIN of 2200 pts.
Main features Our setup has the option to use martingale, the EA has the option to customize. Presentation in the

Normal Parabolic SAR with label of long or short state. Tells also "Parabolic long" and "short". Can be used in multitimeframe layouts together with Swiss HolyGrail indicator or in different timeframes. So, if all the indicators show "long" or "short" you can be sure that the risk of a wrong direction is small. The standard values for Parabolic SAR are 0.02 for step and 0.2 for maximum. You may experiment with changing the maximum to get smother curves. Note that changes in parabolic SAR are la
FREE
Индикатор отображает изменение баланса В правом нижнем углу окна.
Отображаются следующие периоды Сегодня Вчера 3 дня Неделя 10 дней Месяц 3 месяца Полгода Год Все время Есть возможность выставить расчетное время. Удобно пользоваться для расчетов прибыли/убытков с определенного часа.
Будет полезен например ночным скальперам. Данные совпадают с расчетами отчета в терминалее.
FREE

Happy Summer EA is Powefull Expert Advisor base on trend following strategy. This expert using dynamical algorithm to cathching the market trend. With this EA orders that are made seem to be happy in the market in tune with the trend signal. This EA have a good performance that has been tested more than 1 years with real ticks history data.
Although this EA can be use on any pairs, but please Use this EA on EURUSD Pair at M15 timeframe. Account type : HEDGE.
Happy Summer EA design for E

Boleta para operações Long & Short na bolsa Brasileira B3 exclusiva para o mercado A VISTA com lotes padrão. A boleta calcula automaticamente as quantidades dos ativos (compra/venda) da operação baseado no capital informado. É possível determinar os horários de início e término das operações quando selecionado opção para Day Trade. A boleta pode iniciar e terminar as operações automaticamente baseado em horários. Podem ser definidos altos de Ganho (TP) e perdas (SL) em percentual (%). Basta cli
You need to optimize before back test and use Last Month or Last Year Option in Tester. This is part of this EA, which has more advanced aspects to it: https://www.mql5.com/en/market/product/87051 This Expert work towards a positive expectancy. It take positions in a hedging fashion buy and sell on both sides. A hedge account is needed in order for this EA to do as intended. The EA is based on taking both sides, the random nature of the market and the capability of one side being in a positi

OPTIMIZE BEFORE BACKTEST AND TRADING Day trade the markets. Any market, any time frame but its recommended to trade 5 minutes for some inputs but experiment with time frames and assets to see the best . It is important to optimize the inputs of the EA before back testing and using. Last month option to a year is recommended.
Parameters for intraday trading are: Weight Weight of signal of the module in the interval 0 to 1. GoodHourOfDay Number of the only hour of day (from 0 to 23) when tra

reguired set file Live Siqnal - is a trading system based on the correlation of several classical indicators with certain parameters to achieve the necessary goals of market entry and exit control. The minimum number of parameters greatly simplifies the work with the Expert Advisor. The strategy is based on a classic overbought/oversold system with the possible influence of market strength on the price movement in a certain direction. Recommendations for trading: - TF H1GBPUSD - leverage 1:500
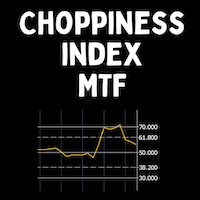
The Choppiness Index was created by Australian commodity trader E.W. Dreiss. It is designed to determine if the market is choppy (trading sideways) or not choppy (trading within a trend in either direction). A basic understanding of the indicator would be; higher values equal more choppiness, while lower values indicate directional trending. The values operate between 0 and 100. The closer the value is to 100, the higher the choppiness (sideways movement) levels. The closer the value is to 0,

Meet the new generation ichimoku cloud. You can develop hundreds of strategies on it. Or you can open a trade directly by looking at whether it is above or below the cloud.
Now it is much easier to know the trend...
Once you get used to this cloud, you won't be able to look at the graphics without it.
The calculation logic is completely different and you will experience the privilege of looking at the market from a different perspective.
By looking at the chart, set the appropriate para

Expert advisor は 、 資産 を 監視 し 、 パラメーター の 入力 に 従っ て ルール に こと で 、 予期 し ない 損失 アカウント アカウント を ます ルール に 違反 と 、 、 は 取引 を し ます。 特定 の または 金銭 金銭 金銭 金銭 金銭 金銭 金銭 金銭 金銭 金銭 HIP損失ですべての取引をクローズするか、特定のパーセンテージまたは金銭的利益でクローズするように EA を設定できます。 このユーティリティは、プロップ トレーディング チャレンジでドローダウンを低く抑え、エクイティを保護するのに非常に役立ちます。
私の信号と他の製品はここにあります 応援、プレゼントは購入後ご連絡ください。 パラメーター: 1ペア限定:運用したいペアにEquity Guardを貼る アカウントのすべてのペアについて: Equity Shield TPアットマネー(0:OFF):TPインマネー SL アット マネー (0: オフ): SL アット マネー TP at % at account Equity: TP は、口座の X SL at % acc
The product will copy all Discord signal to MT5 ( which you are member ) , also it can work as remote copier. Easy to set up. Work with almost signal formats, support to translate other language to English Work with multi channel, multi MT5. Work with Image signal. Copy order instant, auto detect symbol. Work as remote copier: with signal have ticket number, it will copy exactly via ticket number.
How to setup and guide: Let read all details about setup and download Discord To MetaTrade

MT5インジケーター。
この指標は、任意のチャート、任意の時間枠、任意のブローカーで需要と供給のゾーンを検出し、ゾーン化します。 テクニカル分析に最適です。
デフォルトでは、赤い線は強い売りゾーンを示し、緑の線は強い買いゾーンを示しています。 線が引かれると (緑または赤)、99% の確率で価格がそのゾーンに戻って線を閉じます。
入力:
(bool) Four_candle = false : 内部計算に 4 ローソク ルールを使用するオプション。 デフォルトは false に設定されています。 (bool) Five_candle = false : 内部計算に 5 つのローソク足ルールを使用するオプション。 デフォルトは true に設定されています。 (色) Buy_color = Green : BUY シグナル線の色を選択するオプション。 デフォルトは緑に設定されています。 (色) Sell_color = 赤 : SELL シグナル線の色を選択するオプション。 デフォルトは赤に設定されています。 添付のビデオは、インジケーターがこれらのゾーンをユー

Live broadcast of the indicator on YouTube. Please click on the link below for more credibility. There are also videos of the indicator that you can watch. Note that the broadcast is late, do not rely on it. Only a review of the indicator is only a review of the indicator’s accuracy, which does not lose almost and the profit rate reaches 95%. I will work with great accuracy on the CRASH coin 1000 INDICES

次世代の自動化された需要と供給のゾーン。どのチャートでも機能する新しい革新的なアルゴリズム。すべてのゾーンは、市場の価格行動に従って動的に作成されています。
2種類のアラート --> 1) 価格がゾーンに達したとき 2) 新しいゾーンが形成されたとき
もう 1 つの役に立たない指標はありません。実績のある完全な取引戦略を手に入れることができます。
新機能:
価格が需給ゾーンに達したときにアラートを出す
新しい需給ゾーンが作成されたときにアラートを発します
プッシュ通知アラート
ピップ単位のゾーン幅ラベル
MTF のもう 1 つのタイムフレーム。したがって、現在より 2 時間足高いのではなく、現在より 3 時間足し上に見えるようになります。
アラート/ゾーン/MTF 機能を有効/無効にするボタン
あなたが得る利点:
取引から感情を取り除きます。
取引エントリをオブジェクト化します。
確率の高いセットアップで利益
DESCRIPTION
The EasyFollowerTrader-Bot3-DayTrade indicator only trades with the trend. Thus, the indicator will, at first, observe the trend of three averages synchronous with the selected time-frame. Then the indicator observes the trend of the daily chart. When these two charts are moving in the same direction, we have the highest probability of winnings. We will call this region the region of high probability of gain.
In the region of high probability of gain, the indicator will indicate

DESCRIPTION
The EasyFollowerTrader Bot4 DayTrade indicator always trades with the trend. Thus, the indicator, at first, observes the trend of the average of the highs and lows of the candles of the selected time-frame. Then see if this trend is in line with the trend of the daily chart to operate in favor of the major trend. When these two charts are moving in the same direction, we have the highest probability of winnings. We will call this region the region of high probability of gain.
In
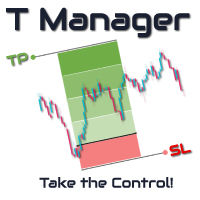
T Manager, the ultimate trade management solution designed by traders for traders. If you are searching for a simple and efficient trade panel, trade manager, or trade assistant, you are at the right place. The market contains a diverse number of those tools , but this one is designed by traders for traders . I designed this tool, and I am using it daily.
Take my advice and stop buying tools blended with un-useful features that you will never use, T Manager provides you with the essential

DESCRIÇÃO O indicador EasyFollowerTrader-Bot2-DayTrade opera apenas a favor da tendência. Assim, o indicador, em primeiro momento, observar a tendência de três médias síncrona com o time-frame selecionado. Em seguida, o indicador observar a tendência do gráfico diário. Quando estes dois gráficos estiverem se movimentando na mesma direção, teremos a maior probabilidade de ganhos. Chamaremos esta região como região de alta probabilidade de ganho. Na região de alta probabilidade de ganho, o ind

このプログラムを使用すると、MetaTrader 4 (MT4) と MetaTrader 5 (MT5) の間でトランザクションを任意の方向に簡単にコピーできます。このプログラムは、「Windows PC」および「Windows VPS」で動作するように設計されています。 あらゆる種類のコピーが可能
MT4 - MT4 MT5 - MT5 MT5 - MT4 MT4 - MT5 *The copier works only on forex and only with currency pairs
※MT4~MT5端末間のコピーには、Trade Copier for MT4 + Trade Copier for MT5の2つのバージョンが必要です。
MT4 - https://www.mql5.com/en/market/product/85792
パラメーター:
WORKING_MODE - 動作モード、信号の受信または送信。 FILE_ID - enter the file name identifier, for example 12345;
P

マーチンゲール。 「Oberon iMA」 は15の個別のブロック(ミニエキスパートアドバイザー)で構成されており、利益を合計し、時間の経過とともにドローダウンを分配します。
特殊性: 各文字の個別の入力データ。 シンボルは繰り返すことができます(15個の同一のシンボルでさえ互いに別々に取引されます)。 1つの取引口座に、異なる設定で複数の「Oberon iMA」をインストールできます(条件を観察:Magic [i + 1]> Magic [i] +15)。 任意の1つのチャートにインストールされます。 ソフトウェアの処理能力が低い場合、「Every_tick_based_on_real_tick」モード (15 個のシンボルすべてを有効にする) でのテストは困難になるか、メモリ不足のために通貨ペアのクオートの履歴をロード中に終了する可能性があります。 この場合、入力データ(「Trade」パラメーター)の文字数を減らすか、テスト期間を短縮することができます。 しかし、最も正しいオプションは、より強力な仮想サーバー (VPS) をレンタルすることです。 ヘッジ口座の種類。 4 桁の

お得な情報printscreenは、さらなる分析のための口座取引と画像の保存を自動化するために設計されたスクリプトです。 パネルを使用すると、履歴内のトランザクションの検索に関連する技術的な作業の時間を大幅に短縮し、すべての操作パラメータの表示と描画を
このスクリプトはどのようなタスクを解決しますか?:
期間を選択するだけで、スクリプトは指定した期間のすべての取引取引を検索し、価格レベルの表示と取引パラメータを含むパネルを持つ各画像を保 1つの取引のみの情報を保存する場合は、入力パラメータで適切なオプションを選択し、必要な取引のチケット(ID)を入力します。 スクリプトは、/"ターミナルディレクトリ"/MQL5/Files/"ブローカー名"/"アカウント番号"/"ポジションチケット"/"選択したファイルの数はここにあります"の原則に従って、各ファ スクリプトは、あなたのためのトランザクションに必要な情報を収集し、印刷画面上の別のパネルに記録します
スクリプトの操作の順序
スクリプトの実行
端末が取引口座に接続されていることを確認してください。 アカウン

この EA は、売買取引のエントリを狙撃し、移動平均、確率的指標を使用して取引を実行します。
バケットオーダーのスキャルピングEAです。一度に5つのエントリを開き、プログラムされたロットサイズは0.01、TPは30ピップ、SLは15ピップです。ただし、ロットサイズ、TP/SL、エントリー数はお好みで変更できます。
この EA の推奨通貨ペアと TP ピップ: * ウソイル * XAUUSD、US30。しかし、TP/SL ピップの計算方法は異なります。 * すべての通貨ペア。
TP/SL 設定: XAUUSD: 300 PIPS = 30 PIPS USOIL: 300 PIPS = 30 PIPS 通貨ペア (GBPUSD、EURUSD、ETC) : 30 PIPS = 30 PIPS
私の電報グループに参加してください: https://t.me/tradswithkay

WavePulse EA uses Price Action strategies and a built-in indicator to look for reliable signals with high winrate and low risk. The EA provides a very balanced risk-reward ratio and survives all market circumstances easily - even the most critical ones like Covid-19, Brexit, etc. It uses a martingale strategy to close all trades in profit. For more accurate trades, it is recommended to use the EA on M15 or higher timeframe. Recommend: Time frame: M15, H1. Use VPS with low latency (< 20ms). Use

Colors generated according to the Height and Depth parameter.
The analysis is carried out following the direction of the price and volume traded if the traded value exceeds the calculation base the system changes the color to green, informing you that the price direction is strong to buy, if the traded value is less than the calculation base the system changes to red, indicating that the price is strong for sale.
FREE

Hundred Egg EA は完全に自動化された取引システムであり、特に外国為替市場での取引に効果的です。 市場を分析し、エントリ ポイントを見つけるために、いくつかの取引分析手法が適用されました。 また、資本を保護するために特別に設計された市場フィルターと統合されています。 AUDCAD、AUDNZD、NZDCAD を対象としており、非常に優れた結果を達成しています。 元の価格: $350
ライブ信号:
クレイジーモード (USD300スタート): https://www.mql5.com/en/signals/987229 クレイジーモード (USD700スタート): https://www.mql5.com/en/signals/1524884 アグレッシブモード (USD2000 スタート): https://www.mql5.com/en/signals/1114889 アグレッシブ モード + その他Egg EAs (USD870 スタート): https://www.mql5.com/en/signals/1359890
特別ポイント

FractalanMT5 – a moderately aggressive EA who works on a martingale strategy with a partial hedging system. With reasonable money management, the EA can withstand significant price corrections against open positions! The first order in the series can be opened manually by both the EA and the trader. Subsequent orders are opened when the fractal level of the specified timeframe is broken. The guide to the FractalanMT5 EA, the set files can be found in the "Comments" section. Benefits types of ord

A professional tool for trading - the divergence indicator between the RSI and the price, which allows you to receive a signal about a trend reversal in a timely manner or catch price pullback movements (depending on the settings). The indicator settings allow you to adjust the strength of the divergence due to the angle of the RSI peaks and the percentage change in price, which makes it possible to fine-tune the signal strength. The indicator code is optimized and is tested very quickly as par
FREE
MetaTraderマーケットは、開発者がトレーディングアプリを販売するシンプルで便利なサイトです。
プロダクトを投稿するのをお手伝いし、マーケットのためにプロダクト記載を準備する方法を説明します。マーケットのすべてのアプリは暗号化によって守られ、購入者のコンピュータでしか動作しません。違法なコピーは不可能です。
取引の機会を逃しています。
- 無料取引アプリ
- 8千を超えるシグナルをコピー
- 金融ニュースで金融マーケットを探索
新規登録
ログイン