Trendy Stocks
- インディケータ
- バージョン: 1.1
- アップデート済み: 8 2月 2022

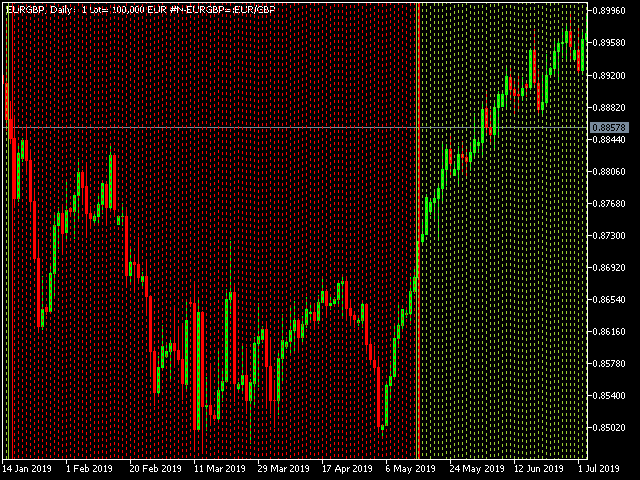
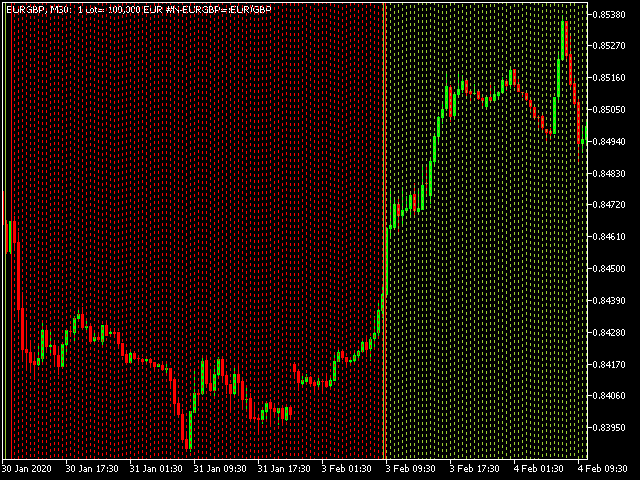
Trendy Stock is a price following indicator that uses Stochastic to show when the price is out of the oversold or overbought areas.
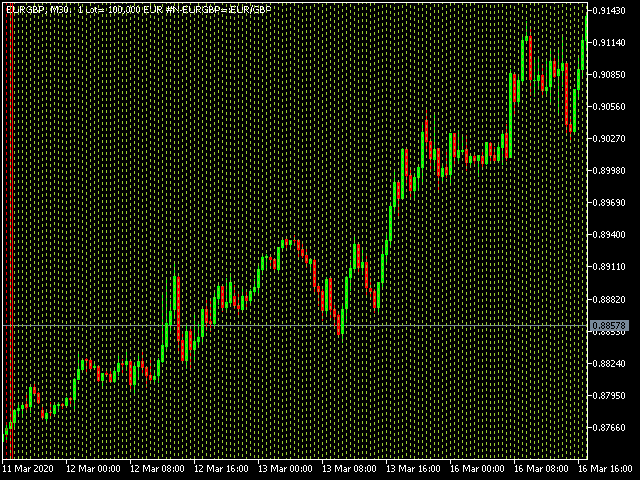
The algorithm allows you to stay longer in a trend where the bulls or bears are in control.
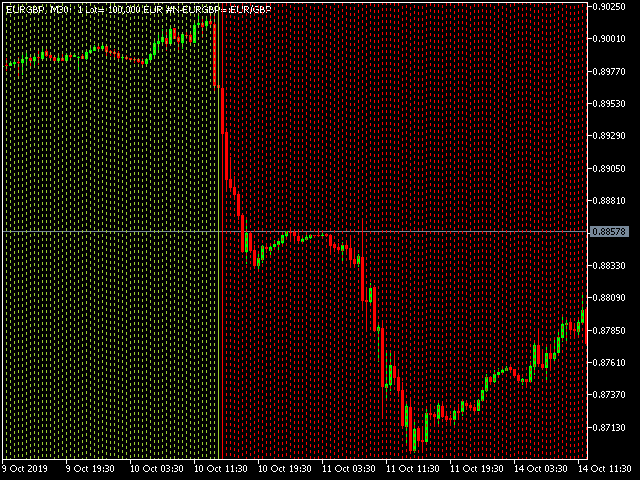
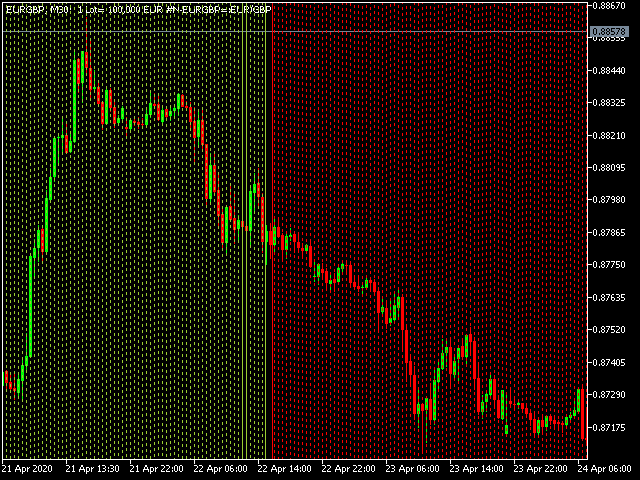
The indicator changes color immediately the price exits oversold/overbought state.
In short, the downtrend [red] bars start to paint when the buying pressure decreases while the uptrend [green] bars form as the buy pressure kicks in.
For MT4 version, follow :: https://www.mql5.com/en/market/product/68129
Advantages
- Allows you to stay longer in a trend
- Does not repaint closed bars.
- Works with any timeframe
- Not oversensitive to medium price fluctuations.
- Works with any broker
How to use
- Buy when first Green bar closes. Re-enter the trend when price deeps and starts to retreat during the green state.
- Sell when first Red bar closes. Re-enter the trend when price deeps and starts to retreat during the red state.
Ideal for the following:
EURUSD
GBPUSD
USDCAD
USDCHF
GBPCHF
EURGBP
AUDUSD
CADCHF
NZDCHF
AUDNZD
AUDCAD
NZDCAD
EURNZD
GBPAUD
EURAUD
EURCAD
Other instruments where it works.HEATING_OIL
GASOLINE
_TELCOM_IT
XRUSD
XLMUSD
MIOTASUSD
NOTE: The indicator works ONLY with the instruments whose quote is below 5 such as the ones that are listed above, otherwise, the indicator WILL NOT display.
- K% Period. For Best results, use values between 25 - 100.
- D% Period. Use values between 1 - 3
- Slowing. Use values between 1 - 3
- Method. Any works fine
- Applied Price. Any works fine


Thank you very much for this awesome indicator for free. I love it so much. And it do help to be profitable. Sorry for my bad English.