
MQL5で自己最適化エキスパートアドバイザーを構築する(第6回):自己適応型取引ルール(II)

前回の「自己適応型取引ルール」に関する議論(リンクはこちら)では、RSIインジケーターに従おうとするアルゴリズムトレーダーが直面する問題について考察しました。
私たちは、RSIインジケーターが常に標準化された結果を生み出すわけではないことを発見しました。これは、期間や時間枠、さらには対象市場によって異なるためです。
この問題を解決するために、アルゴリズムトレーダーはRSIインジケーターの「実際の範囲」を調べるべきだという仮説を立てました。これにより、インジケーターの中間点を理論的な範囲(0~100)ではなく、観測された範囲の中心に再調整できます。このようにすることで、従来のRSIルールでは得られない売買シグナルの発生に関して、一定の信頼性が得られます。また、新しいシグナルに対して、ミッドポイントからの平均的な乖離を記録し、その平均乖離の倍数に該当するシグナルのみを採用することで、さらなる制御が可能になりました。
ここからは、前回の試みに続いて、より実践的なソリューションを構築するために前進していきます。前回の取り組みから改善できる点はいくつかありますが、最も重要な改善点は、RSIのレベルそのものの価値を推定できるようにすることです。
前回は、平均乖離を大きく超えるような値が、より利益につながる可能性があるという仮定を置いただけでした。しかし、それが本当に有効かどうかを検証することはしませんでした。新しく提案するRSIレベルの価値を定量化し、従来の70や30といったレベルと比較することもしていませんでした。
加えて、前回の議論では、RSIの期間を固定した単純化ケースのみを扱いました。これはフレームワークを理解しやすくする上では有効でしたが、今回はより実践的な課題、すなわち「最適な期間がわからない場合」に焦点を当てていきます。
問題を可視化する
新たな読者がいらっしゃるかもしれませんので、以下の図1では、2期間RSIを適用したEURUSDの日足チャートのスクリーンショットを掲載しています。

図1:短期RSIによって生成されるシグナルの質を可視化する
図1の下に表示されたチャートと同じ期間を対象に、図2では70期間のRSIを適用しています。ご覧のとおり、RSIのシグナルは徐々にフラットな線となり、RSIの50近辺に集中しています。では、この2つの図を比較するとどのようなことが言えるのでしょうか。注目すべき点のひとつは、図1・図2の期間中、EURUSDの為替レートが一貫して下落していることです。2024年9月18日時点の1.121という価格から、2024年12月2日には1.051の安値に達しています。しかしながら、2期間RSIは同じ期間中に頻繁にレベルを変化させており、それに対して70期間RSIはほとんど変動せず、レベルの変化が見られませんでした。
では、これは、RSIを使用する際に、トレーダーが常に限られた期間設定しか使えないことを意味するのでしょうか。人間の手を借りずに、適切なRSI期間を自動で選択するアルゴリズムを設計するには、何が必要でしょうか。さらに、初期の期間設定に関係なく、有効な取引レベルを見つけ出すためのアルゴリズムを、どのように作るべきなのでしょうか。

図2:長期間のRSIインジケーターの動作を可視化する
MQL5の始め方
この問題に取り組む方法は多岐にわたります。たとえば、Pythonのライブラリを使って異なる期間のRSIを計算し、期間やRSIレベルを最適化することも可能です。しかし、それにはいくつかの欠点があります。最大の制約は、テクニカル指標の計算方法に微妙な違いがある可能性がある点です。これを避けるために、今回はMQL5でソリューションを実装します。RSIクラスを構築することで、複数のRSI値を一つのCSVファイルに素早く記録でき、そのデータをPythonで分析し、最適なRSI期間や70・30以外の代替レベルを推定することができます。
まずは、RSI値を手動で取得し、RSIレベルの変化を計算するスクリプトを作成します。その後、必要な機能をカプセル化したクラスを作成します。具体的には、期間を5から70まで5刻みで増やしながらRSI値を取得するグリッドを作りたいと考えています。しかし、その前にクラスを実装してテストする必要があります。
スクリプト内でクラスを作成すると、クラスの出力が手動で取得したインジケーターの標準出力と一致するかを素早く検証できます。クラスが正しく設計されていれば、両者の出力は同じになるはずです。これにより、異なる期間の14個のRSIインジケーターを生成しつつ、任意の銘柄で各RSIの変化を追跡できる有用なクラスが完成します。
このRSIクラスの利用目的を考えると、バッファを設定する前にインジケーターの値を読み取ることを防ぐ仕組みをクラスに組み込むのが理にかなっています。まずはこの部分からクラスの構築を始めましょう。クラスのprivateメンバーとして、インジケーターのバッファからコピーする前にRSI値の読み取りを防ぐためのブール型フラグを宣言します。
//+------------------------------------------------------------------+
//|                                                      ProjectName |
//|                                      Copyright 2020, CompanyName |
//|                                       http://www.companyname.net |
//+------------------------------------------------------------------+
#property copyright "Copyright 2024, MetaQuotes Ltd."
#property link      "https://www.mql5.com"
#property version   "1.00"
#property script_show_inputs

//--- The RSI class will manage our indicator settings and provide useful transformations we need
class RSI
  {
   //--- Private members
private:
   //--- Have the indicator values been copied to the buffer?
   bool              indicator_values_initialized;
   bool              indicator_differenced_values_initialized;
また、オブジェクト内で何が起きているのか、問題をどのように解決すればよいかをユーザーに知らせるための文字列を返すメソッドも追加しました。このメソッドは整数型のパラメーターを受け取り、エラーが発生したコード上の位置を知らせます。したがって、通常は端末に表示されるメッセージとして、簡単に解決策を提示できます。
//--- Give the user feedback
string            user_feedback(int flag)
  {
   string message;

   //--- Check if the RSI indicator loaded correctly
   if(flag == 0)
     {
      //--- Check the indicator was loaded correctly
      if(IsValid())
         message = "RSI Indicator Class Loaded Correcrtly \n";
      return(message);
      //--- Something went wrong
      message = "Error loading RSI Indicator: [ERROR] " + (string) GetLastError();
      return(message);
     }

   //--- User tried getting indicator values before setting them
   if(flag == 1)
     {
      message = "Please set the indicator values before trying to fetch them from memory";
      return(message);
     }

   //--- We sueccessfully set our differenced indicator values
   if(flag == 2)
     {
      message = "Succesfully set differenced indicator values.";
      return(message);
     }

   //--- Failed  to set our differenced indicator values
   if(flag == 3)
     {
      message = "Failed to set our differenced indicator values: [ERROR] " + (string) GetLastError();
      return(message);
     }

   //--- The user is trying to retrieve an index beyond the buffer size and must update the buffer size first
   if(flag == 4)
     {
      message = "The user is attempting to use call an index beyond the buffer size, update the buffer size first";
      return(message);
     }

   //--- No feedback
   else
      return("");
  }
次に、クラスのprotectedメンバーを定義します。これらのメンバーは、iRSIクラスのインスタンスを初期化し、インジケーターバッファとやり取りするために必要な可動部分を構成します。
   //--- Protected members
protected:
   //--- The handler for our RSI
   int               rsi_handler;
   //--- The Symbol our RSI should be applied on
   string            rsi_symbol;
   //--- Our RSI period
   int               rsi_period;
   //--- How far into the future we wish to forecast
   int               forecast_horizon;
   //--- The buffer for our RSI indicator
   double            rsi_reading[];
   vector            rsi_differenced_values;
   //--- The current size of the buffer the user last requested
   int               rsi_buffer_size;
   int               rsi_differenced_buffer_size;
   //--- The time frame our RSI should be applied on
   ENUM_TIMEFRAMES   rsi_time_frame;
   //--- The price should the RSI be applied on
   ENUM_APPLIED_PRICE rsi_price;
続いて、クラスのpublicメンバーです。最初に必要な関数は、インジケーターのハンドラが有効かどうかを教えてくれるものです。インジケーターハンドラが正しく設定されていない場合、すぐにユーザーに知らせることができます。
//--- Now, we can define public members:
public:

   //--- Check if our indicator handler is valid
   bool              IsValid(void)
     {
      return((this.rsi_handler != INVALID_HANDLE));
     }
デフォルトコンストラクタは、EURUSDの日足チャートで期間5日のiRSIオブジェクトを作成します。 ユーザーの意図した設定であることを確認するために、クラスはどの市場のどの期間で動作しているかを表示します。さらに、デフォルトコンストラクタによって作成されたRSIオブジェクトのインスタンスであることも明示的にユーザーに通知します。
//--- Our default constructor
void              RSI(void):
                  indicator_values_initialized(false),
                  rsi_symbol("EURUSD"),
                  rsi_time_frame(PERIOD_D1),
                  rsi_period(5),
                  rsi_price(PRICE_CLOSE),
                  rsi_handler(iRSI(rsi_symbol,rsi_time_frame,rsi_period,rsi_price))
  {
   //--- Give the user feedback on initilization
   Print(user_feedback(0));
   //--- Remind the user they called the default constructor
   Print("Default Constructor Called: ",__FUNCSIG__," ",&this);
  }
それ以外の場合は、ユーザーがRSIオブジェクトのパラメータ付きコンストラクタを呼び出し、必要なすべてのパラメータを指定することを想定しています。
//--- Parametric constructor
   void              RSI(string user_symbol,ENUM_TIMEFRAMES user_time_frame,int user_period,ENUM_APPLIED_PRICE user_price)
     {
      indicator_values_initialized = false;
      rsi_symbol                   = user_symbol;
      rsi_time_frame               = user_time_frame;
      rsi_period                   = user_period;
      rsi_price                    = user_price;
      rsi_handler                  = iRSI(rsi_symbol,rsi_time_frame,rsi_period,rsi_price);
      //--- Give the user feedback on initilization
      Print(user_feedback(0));
     }
不要になったシステムリソースを解放し、後片付けをおこなうために、デストラクタも必要です。
//--- Destructor
void             ~RSI(void)
  {
   //--- Free up resources we don't need and reset our flags
   if(IndicatorRelease(rsi_handler))
     {
      indicator_differenced_values_initialized = false;
      indicator_values_initialized = false;
      Print("RSI System logging off");
     }
  }
次に、インジケーターバッファとやり取りするために必要なメソッドが、クラスの重要な要素となります。ユーザーには、バッファからいくつの値をコピーするか、そして値を時系列として並べるかどうかを指定してもらいます。その後、メソッドの終了前に、RSIの値がnullとして返されていないことを確認するテストをおこないます。
//--- Copy readings for our RSI indicator
bool              SetIndicatorValues(int buffer_size,bool set_as_series)
  {
   rsi_buffer_size = buffer_size;
   CopyBuffer(this.rsi_handler,0,0,buffer_size,rsi_reading);
   if(set_as_series)
      ArraySetAsSeries(this.rsi_reading,true);
   indicator_values_initialized = true;

   //--- Did something go wrong?
   vector rsi_test;
   rsi_test.CopyIndicatorBuffer(rsi_handler,0,0,buffer_size);
   if(rsi_test.Sum() == 0)
      return(false);

   //--- Everything went fine.
   return(true);
  }
現在のRSI値を取得するシンプルな関数。
//--- Get the current RSI reading
double            GetCurrentReading(void)
  {
   double temp[];
   CopyBuffer(this.rsi_handler,0,0,1,temp);
   return(temp[0]);
  }
最新の値だけでなく、特定のインデックスの値を取得する必要がある場合もあります。この機能を提供するのが、GetReadingAt関数です。まず、この関数は指定されたインデックスが、インジケーターからコピーしたバッファのサイズを超えていないかを確認します。正しく使用されれば、指定したインデックスのインジケーター値を返します。そうでなければ、エラーメッセージが表示されます。
//--- Get a specific RSI reading
double            GetReadingAt(int index)
  {
   //--- Is the user trying to call indexes beyond the buffer?
   if(index > rsi_buffer_size)
     {
      Print(user_feedback(4));
      return(-1e10);
     }

   //--- Get the reading at the specified index
   if((indicator_values_initialized) && (index < rsi_buffer_size))
      return(rsi_reading[index]);

   //--- User is trying to get values that were not set prior
   else
    {
      Print(user_feedback(1));
      return(-1e10);
     }
  }
私たちが関心を持っているのは、RSIの値そのものだけでなく、その変化量です。現在のRSI値にアクセスできるだけでは不十分で、指定した任意の期間内でのRSIレベルの変化も知りたいのです。これまで同様、ユーザーに見えないところでCopyBuffer関数を呼び出してRSIレベルの増減を計算しますが、クラスには計算結果がすべて0のベクトルになっていないかを確認する追加のチェックも含まれています。そして、問題がなければ、その結果をユーザーに返します。
//--- Let's set the conditions for our differenced data
 bool              SetDifferencedIndicatorValues(int buffer_size,int differencing_period,bool set_as_series)
   {
    //--- Internal variables
    rsi_differenced_buffer_size = buffer_size;
    rsi_differenced_values = vector::Zeros(rsi_differenced_buffer_size);

    //--- Prepare to record the differences in our RSI readings
    double temp_buffer[];
    int fetch = (rsi_differenced_buffer_size + (2 * differencing_period));
    CopyBuffer(rsi_handler,0,0,fetch,temp_buffer);
    if(set_as_series)
       ArraySetAsSeries(temp_buffer,true);

    //--- Fill in our values iteratively
    for(int i = rsi_differenced_buffer_size;i > 1; i--)
      {
       rsi_differenced_values[i-1] = temp_buffer[i-1] - temp_buffer[i-1+differencing_period];
      }

    //--- If the norm of a vector is 0, the vector is empty!
    if(rsi_differenced_values.Norm(VECTOR_NORM_P) != 0)
      {
       Print(user_feedback(2));
       indicator_differenced_values_initialized = true;
       return(true);
      }

    indicator_differenced_values_initialized = false;
    Print(user_feedback(3));
    return(false);
   }
最後に、特定のインデックスでの差分RSI値を取得するメソッドが必要です。この関数も同様に、ユーザーがコピーしたバッファの範囲外を呼び出そうとしていないかどうかを確認します。もし範囲外の場合は、まずバッファサイズを更新し、その後に目的のインデックスの値をコピーするようユーザーに促します。
//--- Get a differenced value at a specific index
double            GetDifferencedReadingAt(int index)
  {
   //--- Make sure we're not trying to call values beyond our index
   if(index > rsi_differenced_buffer_size)
     {
      Print(user_feedback(4));
      return(-1e10);
     }

   //--- Make sure our values have been set
   if(!indicator_differenced_values_initialized)
     {

      //--- The user is trying to use values before they were set in memory
      Print(user_feedback(1));
      return(-1e10);
     }

   //--- Return the differenced value of our indicator at a specific index
   if((indicator_differenced_values_initialized) && (index < rsi_differenced_buffer_size))
      return(rsi_differenced_values[index]);

   //--- Something went wrong.
   return(-1e10);
  }
};
テストの残りの部分を構築するのは簡単です。同じ設定で初期化したRSIインジケーターの類似インスタンスを手動で操作します。両方の読み取り値を同じファイルに書き出せば、情報が重複していることが確認できるはずです。もしそうでなければ、クラスの実装に誤りがあるということになります。
//--- How far we want to forecast
#define HORIZON 10

//--- Our handlers for our indicators
int rsi_5_handle;

//--- Data structures to store the readings from our indicators
double rsi_5_reading[];

//--- File name
string file_name = Symbol() + " Testing RSI Class.csv";

//--- Amount of data requested
input int size = 3000;
スクリプトの残りの部分では、RSIクラスを初期化し、手動で操作する複製版のRSIと同じパラメータで設定するだけで十分です。
//+------------------------------------------------------------------+
//| Our script execution                                             |
//+------------------------------------------------------------------+
void OnStart()
  {
//--- Testing the RSI Class
//--- Initialize the class
   RSI my_rsi(Symbol(),PERIOD_CURRENT,5,PRICE_CLOSE);
   my_rsi.SetIndicatorValues(size,true);
   my_rsi.SetDifferencedIndicatorValues(size,10,true);

//---Setup our technical indicators
   rsi_5_handle  = iRSI(Symbol(),PERIOD_CURRENT,5,PRICE_CLOSE);
   int fetch = size + (2 * HORIZON);

//---Set the values as series
   CopyBuffer(rsi_5_handle,0,0,fetch,rsi_5_reading);
   ArraySetAsSeries(rsi_5_reading,true);

//---Write to file
   int file_handle=FileOpen(file_name,FILE_WRITE|FILE_ANSI|FILE_CSV,",");

   for(int i=size;i>=1;i--)
     {
      if(i == size)
        {
         FileWrite(file_handle,"Time","RSI 5","RSI 5 Class","RSI 5 Difference","RSI 5 Class Difference");
        }

      else
        {
         FileWrite(file_handle,
                   iTime(_Symbol,PERIOD_CURRENT,i),
                   rsi_5_reading[i],
                   my_rsi.GetReadingAt(i),
                   rsi_5_reading[i]  - rsi_5_reading[i + HORIZON],
                   my_rsi.GetDifferencedReadingAt(i)
                  );
        }
     }
//--- Close the file
   FileClose(file_handle);
  }
//+------------------------------------------------------------------+
#undef  HORIZON
クラスが正しく実装されていれば、テストスクリプトは「EURUSD Testing RSI Class」というファイルを生成し、重複したRSIの読み取り値を含みます。図3からもわかるように、私たちのRSIクラスはテストに合格しました。このクラスを使用すれば、多くのプロジェクトで同じメソッドを繰り返し実装する手間を省けます。単にRSIクラスをインポートし、必要なメソッドを呼び出せばよいのです。
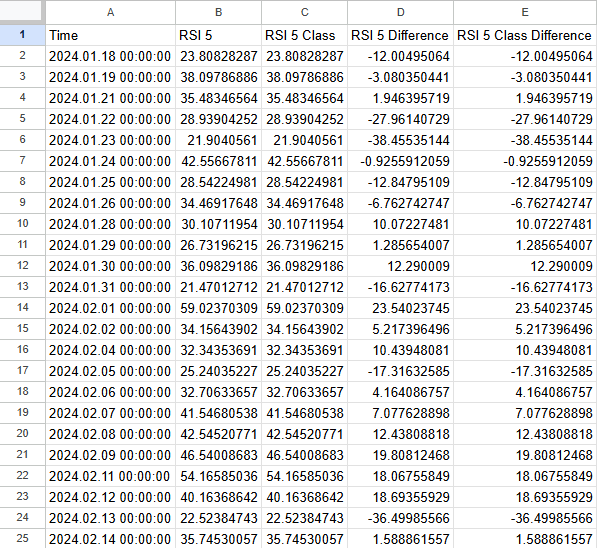
図3:RSIクラスはテストに合格しており、これを使うことはRSIインジケータークラスを手動で操作するのと同じである
クラスの実装に自信が持てたので、専用のインクルードファイルにクラスを記述しましょう。そうすることで、EAや今後おこなう他の演習でも、同じ機能セットが必要な場合にクラスを共有できます。現時点での完成形は、以下のようなクラス構成となっています。
//+------------------------------------------------------------------+
//|                                                          RSI.mqh |
//|                                               Gamuchirai Ndawana |
//|                    https://www.mql5.com/ja/users/gamuchiraindawa |
//+------------------------------------------------------------------+
#property copyright "Gamuchirai Ndawana"
#property link      "https://www.mql5.com/ja/users/gamuchiraindawa"
#property version   "1.00"

//+------------------------------------------------------------------+
//| This class will provide us with usefull functionality            |
//+------------------------------------------------------------------+
class RSI
  {
private:
   //--- Have the indicator values been copied to the buffer?
   bool              indicator_values_initialized;
   bool              indicator_differenced_values_initialized;

   //--- Give the user feedback
   string            user_feedback(int flag);

protected:
   //--- The handler for our RSI
   int               rsi_handler;
   //--- The Symbol our RSI should be applied on
   string            rsi_symbol;
   //--- Our RSI period
   int               rsi_period;
   //--- How far into the future we wish to forecast
   int               forecast_horizon;
   //--- The buffer for our RSI indicator
   double            rsi_reading[];
   vector            rsi_differenced_values;
   //--- The current size of the buffer the user last requested
   int               rsi_buffer_size;
   int               rsi_differenced_buffer_size;
   //--- The time frame our RSI should be applied on
   ENUM_TIMEFRAMES   rsi_time_frame;
   //--- The price should the RSI be applied on
   ENUM_APPLIED_PRICE rsi_price;

public:
                     RSI();
                     RSI(string user_symbol,ENUM_TIMEFRAMES user_time_frame,int user_period,ENUM_APPLIED_PRICE user_price);
                    ~RSI();
   bool              SetIndicatorValues(int buffer_size,bool set_as_series);
   bool              IsValid(void);
   double            GetCurrentReading(void);
   double            GetReadingAt(int index);
   bool              SetDifferencedIndicatorValues(int buffer_size,int differencing_period,bool set_as_series);
   double            GetDifferencedReadingAt(int index);
  };
//+------------------------------------------------------------------+
//| Our default constructor for our RSI class                        |
//+------------------------------------------------------------------+
void RSI::RSI()
  {
   indicator_values_initialized = false;
   rsi_symbol                   = "EURUSD";
   rsi_time_frame               = PERIOD_D1;
   rsi_period                   = 5;
   rsi_price                    = PRICE_CLOSE;
   rsi_handler                  = iRSI(rsi_symbol,rsi_time_frame,rsi_period,rsi_price);
//--- Give the user feedback on initilization
   Print(user_feedback(0));
//--- Remind the user they called the default constructor
   Print("Default Constructor Called: ",__FUNCSIG__," ",&this);
  }

//+------------------------------------------------------------------+
//| Our parametric constructor for our RSI class                     |
//+------------------------------------------------------------------+
void RSI::RSI(string user_symbol,ENUM_TIMEFRAMES user_time_frame,int user_period,ENUM_APPLIED_PRICE user_price)
  {
   indicator_values_initialized = false;
   rsi_symbol                   = user_symbol;
   rsi_time_frame               = user_time_frame;
   rsi_period                   = user_period;
   rsi_price                    = user_price;
   rsi_handler                  = iRSI(rsi_symbol,rsi_time_frame,rsi_period,rsi_price);
//--- Give the user feedback on initilization
   Print(user_feedback(0));
  }

//+------------------------------------------------------------------+
//| Our destructor for our RSI class                                 |
//+------------------------------------------------------------------+
void RSI::~RSI()
  {
//--- Free up resources we don't need and reset our flags
   if(IndicatorRelease(rsi_handler))
     {
      indicator_differenced_values_initialized = false;
      indicator_values_initialized = false;
      Print(user_feedback(5));
     }
  }

//+------------------------------------------------------------------+
//| Get our current reading from the RSI indicator                   |
//+------------------------------------------------------------------+
double RSI::GetCurrentReading(void)
  {
   double temp[];
   CopyBuffer(this.rsi_handler,0,0,1,temp);
   return(temp[0]);
  }

//+------------------------------------------------------------------+
//| Set our indicator values and our buffer size                     |
//+------------------------------------------------------------------+
bool              RSI::SetIndicatorValues(int buffer_size,bool set_as_series)
  {
   rsi_buffer_size = buffer_size;
   CopyBuffer(this.rsi_handler,0,0,buffer_size,rsi_reading);
   if(set_as_series)
      ArraySetAsSeries(this.rsi_reading,true);
   indicator_values_initialized = true;

//--- Did something go wrong?
   vector rsi_test;
   rsi_test.CopyIndicatorBuffer(rsi_handler,0,0,buffer_size);
   if(rsi_test.Sum() == 0)
      return(false);

//--- Everything went fine.
   return(true);
  }
//+--------------------------------------------------------------+
//| Let's set the conditions for our differenced data            |
//+--------------------------------------------------------------+
bool              RSI::SetDifferencedIndicatorValues(int buffer_size,int differencing_period,bool set_as_series)
  {
//--- Internal variables
   rsi_differenced_buffer_size = buffer_size;
   rsi_differenced_values = vector::Zeros(rsi_differenced_buffer_size);

//--- Prepare to record the differences in our RSI readings
   double temp_buffer[];
   int fetch = (rsi_differenced_buffer_size + (2 * differencing_period));
   CopyBuffer(rsi_handler,0,0,fetch,temp_buffer);
   if(set_as_series)
      ArraySetAsSeries(temp_buffer,true);

//--- Fill in our values iteratively
   for(int i = rsi_differenced_buffer_size;i > 1; i--)
     {
      rsi_differenced_values[i-1] = temp_buffer[i-1] - temp_buffer[i-1+differencing_period];
     }

//--- If the norm of a vector is 0, the vector is empty!
   if(rsi_differenced_values.Norm(VECTOR_NORM_P) != 0)
     {
      Print(user_feedback(2));
      indicator_differenced_values_initialized = true;
      return(true);
     }

   indicator_differenced_values_initialized = false;
   Print(user_feedback(3));
   return(false);
  }

 //--- Get a differenced value at a specific index
   double            RSI::GetDifferencedReadingAt(int index)
     {
      //--- Make sure we're not trying to call values beyond our index
      if(index > rsi_differenced_buffer_size)
        {
         Print(user_feedback(4));
         return(-1e10);
        }

      //--- Make sure our values have been set
      if(!indicator_differenced_values_initialized)
        {

         //--- The user is trying to use values before they were set in memory
         Print(user_feedback(1));
         return(-1e10);
        }

      //--- Return the differenced value of our indicator at a specific index
      if((indicator_differenced_values_initialized) && (index < rsi_differenced_buffer_size))
         return(rsi_differenced_values[index]);

      //--- Something went wrong.
      return(-1e10);
     }

//+------------------------------------------------------------------+
//| Get a reading at a specific index from our RSI buffer            |
//+------------------------------------------------------------------+
double            RSI::GetReadingAt(int index)
  {
//--- Is the user trying to call indexes beyond the buffer?
   if(index > rsi_buffer_size)
     {
      Print(user_feedback(4));
      return(-1e10);
     }

//--- Get the reading at the specified index
   if((indicator_values_initialized) && (index < rsi_buffer_size))
      return(rsi_reading[index]);

//--- User is trying to get values that were not set prior
   else
     {
      Print(user_feedback(1));
      return(-1e10);
     }
  }

//+------------------------------------------------------------------+
//| Check if our indicator handler is valid                          |
//+------------------------------------------------------------------+
bool RSI::IsValid(void)
  {
   return((this.rsi_handler != INVALID_HANDLE));
  }

//+------------------------------------------------------------------+
//| Give the user feedback on the actions he is performing           |
//+------------------------------------------------------------------+
string RSI::user_feedback(int flag)
  {
   string message;

//--- Check if the RSI indicator loaded correctly
   if(flag == 0)
     {
      //--- Check the indicator was loaded correctly
      if(IsValid())
         message = "RSI Indicator Class Loaded Correcrtly \nSymbol: " + (string) rsi_symbol + "\nPeriod: " + (string) rsi_period;
      return(message);
      //--- Something went wrong
      message = "Error loading RSI Indicator: [ERROR] " + (string) GetLastError();
      return(message);
     }

//--- User tried getting indicator values before setting them
   if(flag == 1)
     {
      message = "Please set the indicator values before trying to fetch them from memory, call SetIndicatorValues()";
      return(message);
     }

//--- We sueccessfully set our differenced indicator values
   if(flag == 2)
     {
      message = "Succesfully set differenced indicator values.";
      return(message);
     }

//--- Failed  to set our differenced indicator values
   if(flag == 3)
     {
      message = "Failed to set our differenced indicator values: [ERROR] " + (string) GetLastError();
      return(message);
     }

//--- The user is trying to retrieve an index beyond the buffer size and must update the buffer size first
   if(flag == 4)
     {
      message = "The user is attempting to use call an index beyond the buffer size, update the buffer size first";
      return(message);
     }

//--- The class has been deactivated by the user
   if(flag == 5)
     {
      message = "Goodbye.";
      return(message);
     }

//--- No feedback
   else
      return("");
  }
//+------------------------------------------------------------------+
それでは、RSIクラスの複数のインスタンスを使って必要な市場データを取得しましょう。定義したカスタム型の配列に各クラスインスタンスへのポインタを格納します。MQL5では、必要に応じてオブジェクトを動的に生成することが可能です。しかし、この柔軟性には、メモリリークを防ぐために必ず後片付けをおこなわなければならないという代償があります。
//+------------------------------------------------------------------+
//|                                                      ProjectName |
//|                                      Copyright 2020, CompanyName |
//|                                       http://www.companyname.net |
//+------------------------------------------------------------------+
#property copyright "Copyright 2024, MetaQuotes Ltd."
#property link      "https://www.mql5.com"
#property version   "1.00"
#property script_show_inputs

//+------------------------------------------------------------------+
//| System constants                                                 |
//+------------------------------------------------------------------+
#define HORIZON 10

//+------------------------------------------------------------------+
//| Libraries                                                        |
//+------------------------------------------------------------------+
#include <VolatilityDoctor\Indicators\RSI.mqh>

//+------------------------------------------------------------------+
//| Global variables                                                 |
//+------------------------------------------------------------------+
RSI *my_rsi_array[14];
string file_name = Symbol() + " RSI Algorithmic Input Selection.csv";

//+------------------------------------------------------------------+
//| Inputs                                                           |
//+------------------------------------------------------------------+
input int size = 3000;

//+------------------------------------------------------------------+
//| Our script execution                                             |
//+------------------------------------------------------------------+
void OnStart()
  {
//--- How much data should we store in our indicator buffer?
   int fetch = size + (2 * HORIZON);

//--- Store pointers to our RSI objects
   for(int i = 0; i <= 13; i++)
     {
      //--- Create an RSI object
      my_rsi_array[i] = new RSI(Symbol(),PERIOD_CURRENT,((i+1) * 5),PRICE_CLOSE);
      //--- Set the RSI buffers
      my_rsi_array[i].SetIndicatorValues(fetch,true);
      my_rsi_array[i].SetDifferencedIndicatorValues(fetch,HORIZON,true);
     }

//---Write to file
   int file_handle=FileOpen(file_name,FILE_WRITE|FILE_ANSI|FILE_CSV,",");

   for(int i=size;i>=1;i--)
     {
      if(i == size)
        {
         FileWrite(file_handle,"Time","True Close","Open","High","Low","Close","RSI 5","RSI 10","RSI 15","RSI 20","RSI 25","RSI 30","RSI 35","RSI 40","RSI 45","RSI 50","RSI 55","RSI 60","RSI 65","RSI 70","Diff RSI 5","Diff RSI 10","Diff RSI 15","Diff RSI 20","Diff RSI 25","Diff RSI 30","Diff RSI 35","Diff RSI 40","Diff RSI 45","Diff RSI 50","Diff RSI 55","Diff RSI 60","Diff RSI 65","Diff RSI 70");
        }

      else
        {
         FileWrite(file_handle,
                   iTime(_Symbol,PERIOD_CURRENT,i),
                   iClose(_Symbol,PERIOD_CURRENT,i),
                   iOpen(_Symbol,PERIOD_CURRENT,i) - iOpen(Symbol(),PERIOD_CURRENT,i + HORIZON),
                   iHigh(_Symbol,PERIOD_CURRENT,i) - iHigh(Symbol(),PERIOD_CURRENT,i + HORIZON),
                   iLow(_Symbol,PERIOD_CURRENT,i) - iLow(Symbol(),PERIOD_CURRENT,i + HORIZON),
                   iClose(_Symbol,PERIOD_CURRENT,i) - iClose(Symbol(),PERIOD_CURRENT,i + HORIZON),
                   my_rsi_array[0].GetReadingAt(i),
                   my_rsi_array[1].GetReadingAt(i),
                   my_rsi_array[2].GetReadingAt(i),
                   my_rsi_array[3].GetReadingAt(i),
                   my_rsi_array[4].GetReadingAt(i),
                   my_rsi_array[5].GetReadingAt(i),
                   my_rsi_array[6].GetReadingAt(i),
                   my_rsi_array[7].GetReadingAt(i),
                   my_rsi_array[8].GetReadingAt(i),
                   my_rsi_array[9].GetReadingAt(i),
                   my_rsi_array[10].GetReadingAt(i),
                   my_rsi_array[11].GetReadingAt(i),
                   my_rsi_array[12].GetReadingAt(i),
                   my_rsi_array[13].GetReadingAt(i),
                   my_rsi_array[0].GetDifferencedReadingAt(i),
                   my_rsi_array[1].GetDifferencedReadingAt(i),
                   my_rsi_array[2].GetDifferencedReadingAt(i),
                   my_rsi_array[3].GetDifferencedReadingAt(i),
                   my_rsi_array[4].GetDifferencedReadingAt(i),
                   my_rsi_array[5].GetDifferencedReadingAt(i),
                   my_rsi_array[6].GetDifferencedReadingAt(i),
                   my_rsi_array[7].GetDifferencedReadingAt(i),
                   my_rsi_array[8].GetDifferencedReadingAt(i),
                   my_rsi_array[9].GetDifferencedReadingAt(i),
                   my_rsi_array[10].GetDifferencedReadingAt(i),
                   my_rsi_array[11].GetDifferencedReadingAt(i),
                   my_rsi_array[12].GetDifferencedReadingAt(i),
                   my_rsi_array[13].GetDifferencedReadingAt(i)
                  );
        }
     }
//--- Close the file
   FileClose(file_handle);

//--- Delete our RSI object pointers
   for(int i = 0; i <= 13; i++)
     {
      delete my_rsi_array[i];
     }
  }
//+------------------------------------------------------------------+
#undef HORIZON
Pythonでデータを分析する
それでは、MetaTrader 5端末から収集したデータの分析を始めましょう。最初のステップは、必要な標準ライブラリを読み込むことです。
import pandas as pd
import numpy as np
import seaborn as sns
import matplotlib.pyplot as plt
import plotly
次に、市場データを読み込みましょう。また、現在の価格レベルが10日前の価格より高いのか低いのかを示すフラグも作成します。ここで思い出していただきたいのは、「10日間」という期間は、RSIの変化量を計算する際にスクリプト内で使用したものと同じであるという点です。
#Let's read in our market data
data = pd.read_csv("EURUSD RSI Algorithmic Input Selection.csv")
data['Bull'] = np.NaN

data.loc[data['True Close'] > data['True Close'].shift(10),'Bull'] = 1
data.loc[data['True Close'] < data['True Close'].shift(10),'Bull'] = 0

data.dropna(inplace=True)
data.reset_index(inplace=True,drop=True)
実際の市場収益も計算する必要があります。
#Estimate the market returns
#Define our forecast horizon
HORIZON = 10
data['Target'] = 0

data['Return'] = data['True Close'].shift(-HORIZON) - data['True Close']
data.loc[data['Return'] > 0,'Target'] = 1

#Drop missing values
data.dropna(inplace=True)
最も重要なのは、意図しているバックテスト期間と重複するすべてのデータを削除することです。
#No cheating boys.
_ = data.iloc[((-365 * 3) + 95):,:]
data = data.iloc[:((-365 * 3) + 95),:]
data
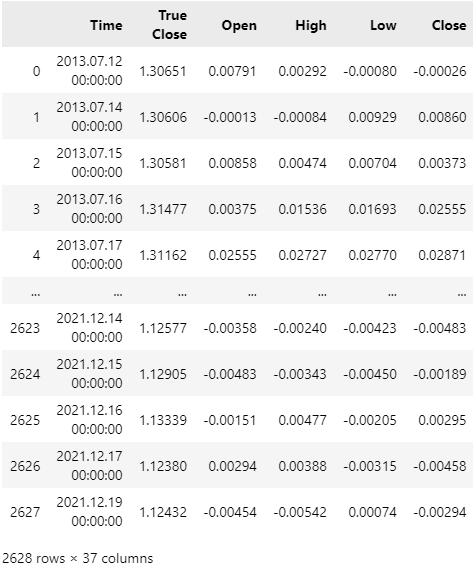
図4:データセットには、バックテスト期間と重複する日付は含まれなくなった
EURUSDの10日間リターンの分布を視覚化すると、市場リターンがおおよそ0を中心に分布していることがすぐにわかります。このような分布の形は特に驚くべきものではなく、EURUSDに特有のものでもありません。
plt.title('Distribution of EURUSD 10 Day Returns')
plt.grid()
sns.histplot(data['Return'],color='black') 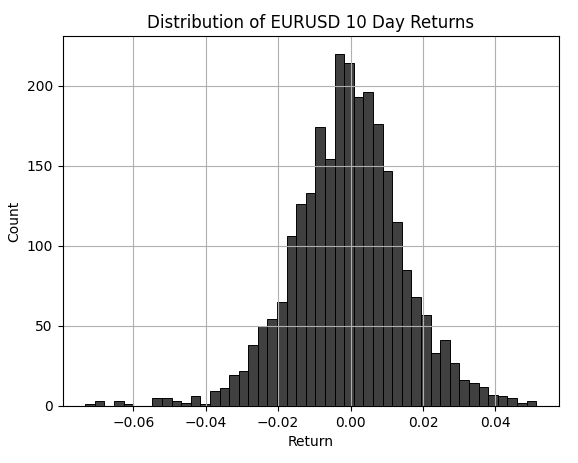
図5:10日間のEURUSDリターン分布
この演習では、短期間のRSIレベルと長期間のRSIレベルの分布の違いを視覚的に確認できる、貴重な機会を提供しています。赤い破線は、標準的な30および70のRSIレベルを示しています。黒いバーは、RSIの期間を5に設定した場合のRSIレベルの分布を表しています。ご覧のとおり、5期間RSIでは、標準レベルを超えるシグナルが数多く生成されることがわかります。一方で、白いバーはRSIの期間を70に設定した場合の分布を示しており、視覚的に確認できる通り、ほとんどシグナルが発生しないことが分かります。この分布形状の変化こそが、アルゴリズムトレーダーにとって、インジケーターを常に「ベストプラクティス」に従って使用することを困難にしている要因です。
plt.title('Comapring The Distribution of RSI Changes Across Different RSI Periods')
sns.histplot(data['RSI 5'],color='black')
sns.histplot(data['RSI 70'],color='white')
plt.xlabel('RSI Level')
plt.legend(['RSI 5','RSI 70'])
plt.axvline(30,color='red',linestyle='--')
plt.axvline(70,color='red',linestyle='--')
plt.grid() 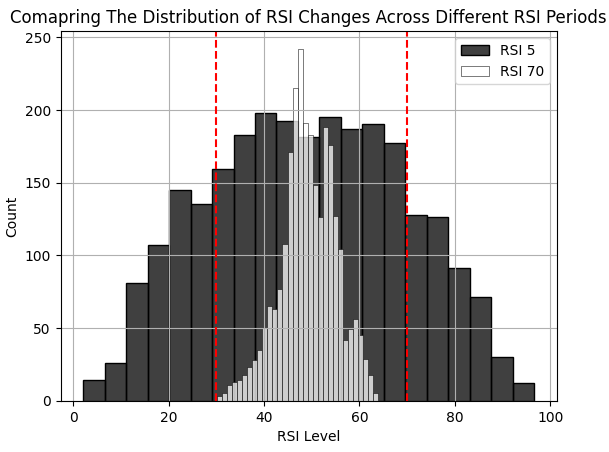
図6:異なるRSI期間にわたるRSIレベルの分布の比較
60期間RSIにおける10期間の変化を、X軸とY軸の両方にプロットした散布図を作成することで、インジケーターの変化とターゲットとの間に関係性があるかどうかを視覚的に確認できます。この図から読み取れるのは、RSIが10レベル変化した場合、それが有効な売買シグナルとなり得る可能性があるということです。たとえば、RSIの値が10ポイント下落した場合にはショートポジションを、逆に10ポイント上昇した場合にはロングポジションを検討するのが妥当かもしれません。
plt.title('Scatter Plot of 10 Day Change in 50 Period RSI & EURUSD 10 Day Return')
sns.scatterplot(data,y='Diff RSI 60',x='Diff RSI 60',hue='Target')
plt.xlabel('50 Period RSI')
plt.ylabel('50 Period RSI')
plt.grid()
plt.axvline(-10,color='red',linestyle='--')
plt.axvline(10,color='red',linestyle='--') 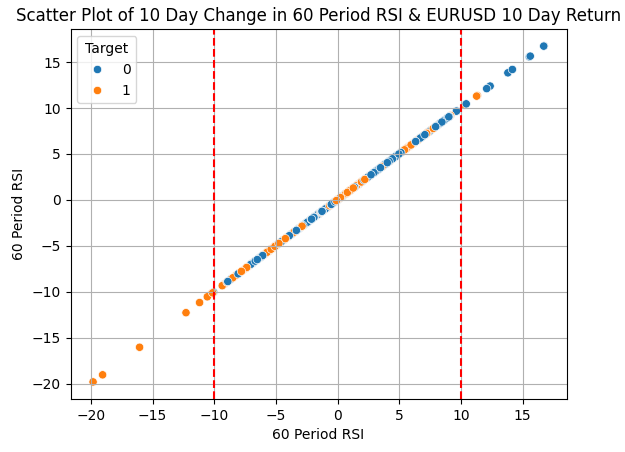
図7:60期間RSIの変化と目標の関係
異なる期間のRSI変化によって生成されたシグナルを組み合わせることは、一見もっともらしいアイデアに思えるかもしれません。しかし実際には、私たちが注目している2つのクラス(たとえば上昇と下降など)をより明確に分離するという点においては、あまり効果がないように見受けられます。
plt.title('Scatter Plot of 10 Day Change in 5 Period RSI & EURUSD 10 Day Return')
sns.scatterplot(data,y='Diff RSI 60',x='Diff RSI 5',hue='Target')
plt.xlabel('5 Period RSI')
plt.ylabel('5 Period RSI')
plt.grid()
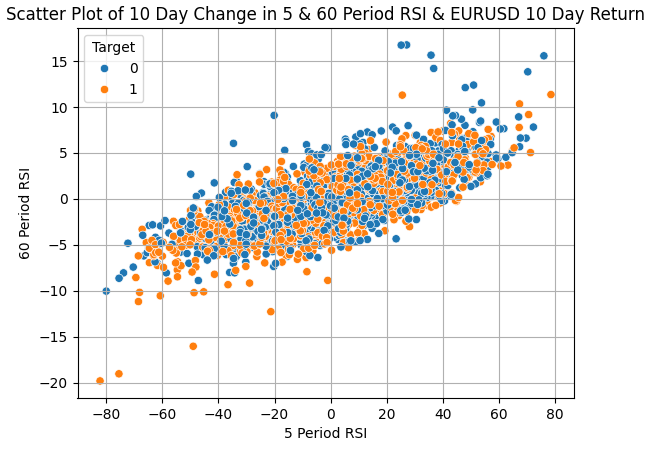
図8:異なる期間のRSIインジケーターを単に使用するのは、確認手段として不十分のようである
14種類の異なるRSIインジケーターから選択することができます。しかし、どの期間が最も有効かを判断するために14回もバックテストを実行する代わりに、すべてのRSIインジケーターを入力としたモデルを一つ構築し、そのモデルが学習した特徴量の重要度を評価することで、最適な期間を推定することができます。
ここで注目すべきは、統計モデルを「予測精度のために使う」のか、「解釈や洞察のために使う」のかという選択肢が常にあるという点です。今回は後者、すなわち解釈を目的として分析をおこないます。具体的には、14種類すべてのRSIインジケーターの変化量を入力として、リッジ回帰モデルを適合させます。リッジ回帰モデルにはチューニングパラメータがあり、それらを調整するためにグリッドサーチをおこないます。特に以下のパラメータをチューニングします:
- Alpha:モデルの係数にペナルティを加えるための正則化項。モデルの過学習を防ぐ役割があります。
- Tolerance:収束判定などに用いられる、数値計算中の最小変化量。選択したソルバーによって意味が変わることがあります。
今回の分析では、リッジ回帰モデルのソルバーとしてsparse_cgを使用します。ご自分で別のソルバーやパラメータチューニングを試してみるのも良いでしょう。
リッジ回帰モデルが私たちにとって特に有用である理由は、モデルの損失を最小化するために重要でない係数を0に近づけてくれる点です。したがって、私たちは広い範囲で初期設定を試し、最も誤差が小さかった設定に注目します。そして、その最良のモデルにおける係数の構成を調べることで、どのRSI期間にモデルが最も依存していたのかを把握することができます。今回の例では、最も良好なパフォーマンスを示したモデルが、「55期間RSIにおける10期間の変化」に最も大きな係数を割り当てていたことが分かりました。
#Set the max levels we wish to check
ALPHA_LEVELS = 10
TOL_LEVELS   = 10

#DataFrame labels
r_c = 'TOL_LEVEL_'
r_r = 'ALHPA_LEVEL_'

results_columns = []
results_rows = []

for c in range(TOL_LEVELS):
    n_c = r_c + str(c)
    n_r = r_r + str(c)
    results_columns.append(n_c)
    results_rows.append(n_r)

#Create a DataFrame to store our results
results = pd.DataFrame(columns=results_columns,index=results_rows)

#Cross validate our model
for i in range(TOL_LEVELS):
    tol = 10 ** (-i)
    error = []
    for j in range(ALPHA_LEVELS):
        #Set alpha
        alpha = 10 ** (-j)

        #Its good practice to generally check the 0 case
        if(i == 0 & j == 0):
            model = Ridge(alpha=j,tol=i,solver='sparse_cg')

        #Otherwise use a float
        model = Ridge(alpha=alpha,tol=tol,solver='sparse_cg')

        #Store the error levels
        error.append(np.mean(np.abs(cross_val_score(model,data.loc[:,['Diff RSI 5',
       'Diff RSI 10', 'Diff RSI 15', 'Diff RSI 20', 'Diff RSI 25',
       'Diff RSI 30', 'Diff RSI 35', 'Diff RSI 40', 'Diff RSI 45',
       'Diff RSI 50', 'Diff RSI 55', 'Diff RSI 60', 'Diff RSI 65',
       'Diff RSI 70',]],data['Return'],cv=tscv))))

    #Record the error levels
    results.iloc[:,i] = error

results
以下の表は結果をまとめたものです。これを見ると、モデルの初期パラメータを両方とも0に設定したときに、最も低い誤差率が得られたことがわかります。
| チューニングパラメータ | モデルエラー |
|---|---|
| ALHPA_LEVEL_0 | 0.053509 |
| ALHPA_LEVEL_1 | 0.056245 |
| ALHPA_LEVEL_2 | 0.060158 |
| ALHPA_LEVEL_3 | 0.062230 |
| ALHPA_LEVEL_4 | 0.061521 |
| ALHPA_LEVEL_5 | 0.064312 |
| ALHPA_LEVEL_6 | 0.073248 |
| ALHPA_LEVEL_7 | 0.079310 |
| ALHPA_LEVEL_8 | 0.081914 |
| ALHPA_LEVEL_9 | 0.085171 |
結果は、等高線プロットを使って可視化することも可能です。誤差が低い領域、すなわち青い部分のモデルを利用したいと考えています。これらがこれまでのところ最も優れたモデルです。次に、モデル内の各係数の大きさを視覚化してみましょう。最も大きな係数は、モデルが最も依存していた入力に割り当てられます。
import plotly.graph_objects as go

fig = go.Figure(data =
    go.Contour(
        z=results,
        colorscale='bluered'
    ))

fig.update_layout(
    width = 600,
    height = 400,
    title='Contour Plot Of Our Error Forecasting EURUSD Using Grid Search '
)

fig.show()
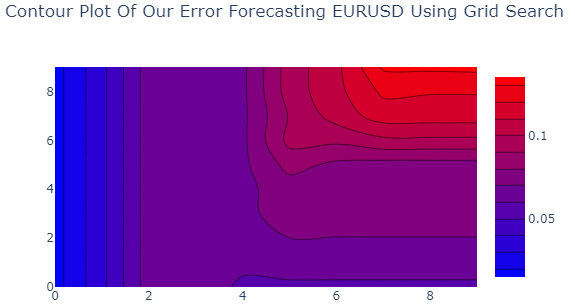
図9:リッジ回帰モデルが10日間のEURUSDリターンを予測するための最適な入力設定を見つけた
データを視覚的にプロットすると、55期間RSIに対応する係数が最も大きな絶対値を持っていることが一目で分かります。これにより、特定のRSI設定に注目を絞る自信が持てます。
#Let's visualize the importance of each column
model = Ridge(alpha=0,tol=0,solver='sparse_cg')

model.fit(data.loc[:,['Diff RSI 5',
       'Diff RSI 10', 'Diff RSI 15', 'Diff RSI 20', 'Diff RSI 25',
       'Diff RSI 30', 'Diff RSI 35', 'Diff RSI 40', 'Diff RSI 45',
       'Diff RSI 50', 'Diff RSI 55', 'Diff RSI 60', 'Diff RSI 65',
       'Diff RSI 70',]],data['Return'])

#Clearly our model relied on the 25 Period RSI the most, from all the data it had available at training
sns.barplot(np.abs(model.coef_),color='black')
plt.title('Rleative Feature Importance')
plt.ylabel('Coefficient Value')
plt.xlabel('Coefficient Index')
plt.grid()
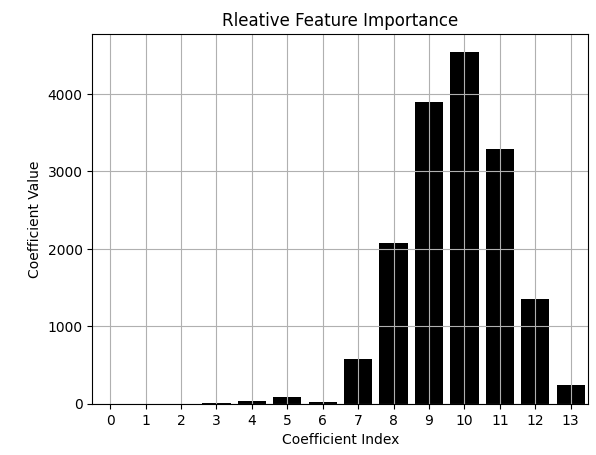
図10:55期間RSIの差分に関連する係数に最も大きな値が割り当てられた
関心のある期間が特定できたので、次にRSIレベルを10ずつ増やしていく中で、モデルの誤差がどのように変化するかを評価しましょう。データフレームに3つの追加列を作成します。1つ目の列には、RSIの値が最初にチェックしたい値より大きい場合に「1」を設定します。2つ目の列には、RSIの値が特定の値より小さい場合に「1」を設定します。それ以外の場合は、3つ目の列に「1」を設定します。
def objective(x):
    data = pd.read_csv("EURUSD RSI Algorithmic Input Selection.csv")
    data['0'] = 0
    data['1'] = 0
    data['2'] = 0
    HORIZON = 10
    data['Return'] = data['True Close'].shift(-HORIZON) - data['True Close']
    data.dropna(subset=['Return'],inplace=True)
    data.iloc[data['Diff RSI 55'] > x[0],12] = 1
    data.iloc[data['Diff RSI 55'] < x[1],13] = 1
    data.iloc[(data['Diff RSI 55'] < x[0]) & (data['RSI 55'] > x[1]),14] = 1
    #Calculate or RMSE When using those levels
    model = Ridge(alpha=0,tol=0,solver='sparse_cg')
    error = np.mean(np.abs(cross_val_score(model,data.iloc[:,12:15],data['Return'],cv=tscv)))
    return(error)
基準値を0に設定した場合に、モデルがどのような誤差を出すか評価してみましょう。
#Bad rules for using the RSI
objective([0,0])
0.026897725573317266
70と30のレベルを関数に入力すると、誤差が増加しました。そこで、55期間RSIにより適したRSI変化レベルを見つけるために、10刻みでグリッドサーチをおこないます。その結果、最適な変化レベルはおよそ10RSIレベル付近であることが分かりました。
#Bad rules for using the RSI
objective([70,30])
0.031258730612736006
LEVELS  = 10
results = []

for i in np.arange(0,(LEVELS)):
    results.append(objective([i * 10,-(i * 10)]))

plt.plot(results,color='black')
plt.ylabel('Error Rate')
plt.xlabel('Change in RSI as multiples of 10')
plt.grid()
plt.scatter(results.index(min(results)),min(results),color='red')
plt.title('Measuring The Strength of Changes In RSI Levels')
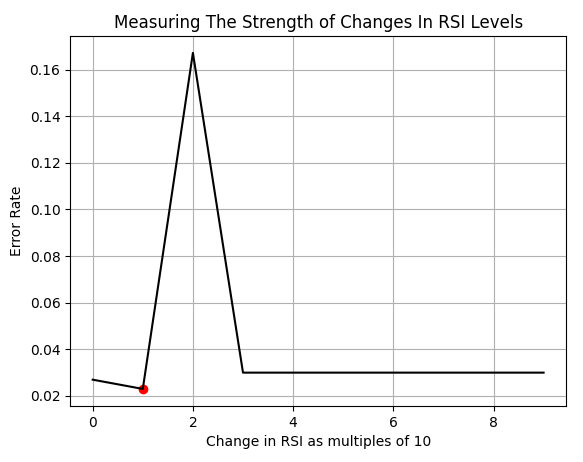
図11:RSIインジケーターの最適な変化レベル
次に、RSI変化の範囲を0から20の間でより細かく探索してみましょう。詳しく調べたところ、真の最適値は9付近にあるように見えます。しかし、私たちは過去のデータに完璧に適合させるためにこうした分析をおこなっているわけではありません。それは過学習と呼ばれ、望ましくない手法です。私たちの目的は単なるカーブフィッティングではありません。最適値が歴史的データの分析で示される場所にぴったり合うことを目指すのではなく、最適値の位置は変わる可能性があることを前提に、その最適値の両側で標準偏差の一定の範囲内に入ることを信頼区間として捉えることを目標としています。
LEVELS  = 20
coef = 0.5
results = []

for i in np.arange(0,(LEVELS),1):
    results.append(objective([i,-(i)]))

plt.plot(results)
plt.ylabel('Error Rate')
plt.xlabel('Change in RSI')
plt.grid()
plt.scatter(results.index(min(results)),min(results),color='red')
plt.title('Measuring The Strength of Changes In RSI Levels')


plt.axvline(results.index(min(results)),color='red')
plt.axvline(results.index(min(results)) - (coef * np.std(data['Diff RSI 55'])),linestyle='--',color='red')
plt.axvline(results.index(min(results)) + (coef * np.std(data['Diff RSI 55'])),linestyle='--',color='red')
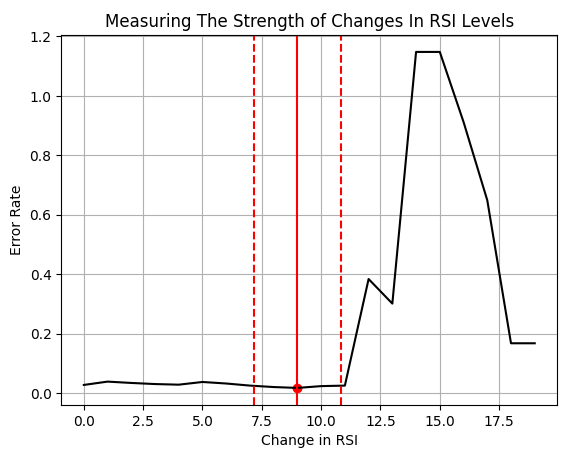
図12:RSIレベルの変化に対して異なる閾値を設定することに関連する誤差率
RSI変化の過去の分布の上に、私たちが最適と考える領域を重ねて視覚的に確認することができます。
sns.histplot(data['Diff RSI 55'],color='black')
coef = 0.5
plt.axvline((results.index(min(results))),linestyle='--',color='red')
plt.axvline(results.index(min(results)) - (coef * np.std(data['Diff RSI 55'])),color='red')
plt.axvline(results.index(min(results)) + (coef * np.std(data['Diff RSI 55'])),color='red')
plt.axvline(-(results.index(min(results))),linestyle='--',color='red')
plt.axvline(-(results.index(min(results)) - (coef * np.std(data['Diff RSI 55']))),color='red')
plt.axvline(-(results.index(min(results)) + (coef * np.std(data['Diff RSI 55']))),color='red')
plt.title("Visualizing our Optimal Point in The Distribution")
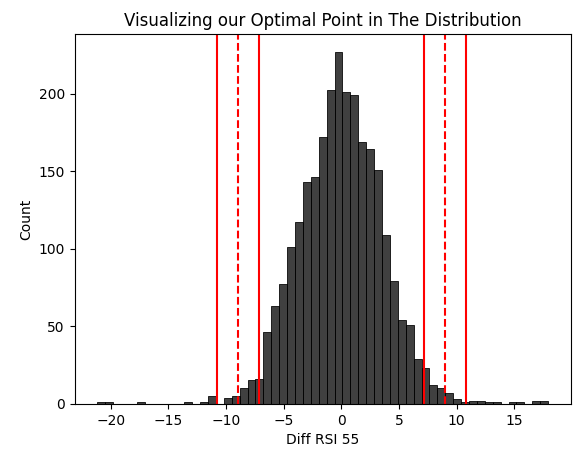
図13:RSI取引シグナル用に選択した最適な領域
良好な信頼区間の推定値を取得しましょう。これらの値が、EAにおけるロングおよびショートのシグナルを発生させる重要な基準値として機能します。
results.index(min(results)) + ( coef * np.std(data['Diff RSI 55']))
10.822857254027287
そして、下限値です。
results.index(min(results)) - (coef * np.std(data['Diff RSI 55']))
7.177142745972713
リッジ回帰モデルから説明を得て、これまで直感的には考えなかった方法でRSIインジケーターを解釈してみましょう。
def explanation(x):
    data = pd.read_csv("EURUSD RSI Algorithmic Input Selection.csv")
    data['0'] = 0
    data['1'] = 0
    data['2'] = 0
    HORIZON = 10
    data['Return'] = data['True Close'].shift(-HORIZON) - data['True Close']
    data.dropna(subset=['Return'],inplace=True)
    data.iloc[data['Diff RSI 55'] > x[0],12] = 1
    data.iloc[data['Diff RSI 55'] < x[1],13] = 1
    data.iloc[(data['Diff RSI 55'] < x[0]) & (data['RSI 55'] > x[1]),14] = 1
    #Calculate or RMSE When using those levels
    model = Ridge(alpha=0,tol=0,solver='sparse_cg')
    model.fit(data.iloc[:,12:15],data['Return'])
    return(model.coef_.copy())
RSIインジケーターの変化が最適値である9を超えた場合、モデルは正の係数を学習しており、これはロングポジションを取るべきことを示唆しています。それ以外の場合は、モデルは売り(ショート)を推奨しています。
opt = 9

print(explanation([opt,-opt]))
[ 1.97234840e-04 -1.64215118e-04 -7.55222156e-05]
EAの構築
過去の知見が将来の良いモデルになると仮定すると、今まで学んだ市場の知識を活かしてEURUSDを利益的に取引するアプリケーションを構築できるでしょうか。まずはじめに、プログラム全体および今後作成する可能性のある他のバージョンでも必要となる重要なシステム定数を定義します。
//+------------------------------------------------------------------+
//|                                  Algorithmic Input Selection.mq5 |
//|                                               Gamuchirai Ndawana |
//|                    https://www.mql5.com/ja/users/gamuchiraindawa |
//+------------------------------------------------------------------+
#property copyright "Gamuchirai Ndawana"
#property link      "https://www.mql5.com/ja/users/gamuchiraindawa"
#property version   "1.00"

//+------------------------------------------------------------------+
//| System constants                                                 |
//+------------------------------------------------------------------+
#define RSI_PERIOD 55
#define RSI_TIME_FRAME PERIOD_D1
#define SYSTEM_TIME_FRAME PERIOD_D1
#define RSI_PRICE  PRICE_CLOSE
#define RSI_BUFFER_SIZE 20
#define TRADING_VOLUME SymbolInfoDouble(Symbol(),SYMBOL_VOLUME_MIN)
ライブラリを読み込みます。
//+------------------------------------------------------------------+
//| Load our RSI library                                             |
//+------------------------------------------------------------------+
#include <VolatilityDoctor\Indicators\RSI.mqh>
#include <Trade\Trade.mqh>
いくつかのグローバル変数が必要になります。
//+------------------------------------------------------------------+
//| Global variables                                                 |
//+------------------------------------------------------------------+
CTrade Trade;
RSI    rsi_55(Symbol(),RSI_TIME_FRAME,RSI_PERIOD,RSI_PRICE);
double last_value;
int    count;
int    ma_o_handler,ma_c_handler;
double ma_o[],ma_c[];
double trade_sl;
各イベントハンドラは、それぞれの処理を完了するために必要なサブプロセスを扱う専用のメソッドを呼び出します。
//+------------------------------------------------------------------+
//| Expert initialization function                                   |
//+------------------------------------------------------------------+
int OnInit()
  {
//---
   setup();
//---
   return(INIT_SUCCEEDED);
  }
//+------------------------------------------------------------------+
//| Expert deinitialization function                                 |
//+------------------------------------------------------------------+
void OnDeinit(const int reason)
  {
//---
   IndicatorRelease(ma_c_handler);
   IndicatorRelease(ma_o_handler);
  }
//+------------------------------------------------------------------+
//| Expert tick function                                             |
//+------------------------------------------------------------------+
void OnTick()
  {
//---
   update();
  }
//+------------------------------------------------------------------+
update関数は、システムのすべての変数を更新し、新たにポジションを開くべきか、または既存のポジションを管理すべきかをチェックします。
//+------------------------------------------------------------------+
//| Update our system variables                                      |
//+------------------------------------------------------------------+
void update(void)
  {
   static datetime time_stamp;
   datetime current_time = iTime(Symbol(),SYSTEM_TIME_FRAME,0);

   if(time_stamp != current_time)
     {
      time_stamp = current_time;
      CopyBuffer(ma_c_handler,0,0,1,ma_c);
      CopyBuffer(ma_o_handler,0,0,1,ma_o);

      if((count == 0) && (PositionsTotal() == 0))
        {
         rsi_55.SetIndicatorValues(RSI_BUFFER_SIZE,true);
         last_value = rsi_55.GetReadingAt(RSI_BUFFER_SIZE - 1);
         count = 1;
        }

      if(PositionsTotal() == 0)
         check_signal();

      if(PositionsTotal() > 0)
         manage_setup();
     }
  }
可能な限りリスクレベルを下げるために、ポジションのストップロスを継続的に調整する必要があります。
//+------------------------------------------------------------------+
//| Manage our open trades                                           |
//+------------------------------------------------------------------+
void manage_setup(void)
  {
   double bid = SymbolInfoDouble(Symbol(),SYMBOL_BID);
   double ask = SymbolInfoDouble(Symbol(),SYMBOL_ASK);

   if(PositionSelect(Symbol()))
     {
      double current_sl = PositionGetDouble(POSITION_SL);
      double current_tp = PositionGetDouble(POSITION_TP);
      double new_sl = (current_tp > current_sl) ? (bid-trade_sl) : (ask+trade_sl);
      double new_tp = (current_tp < current_sl) ? (bid+trade_sl) : (ask-trade_sl);
      //--- Buy setup
      if((current_tp > current_sl) && (new_sl < current_sl))
         Trade.PositionModify(Symbol(),new_sl,new_tp);

      //--- Sell setup
      if((current_tp < current_sl) && (new_sl > current_sl))
         Trade.PositionModify(Symbol(),new_sl,new_tp);
     }
  }
setup関数は、システムを最初から起動する役割を担っています。必要なインジケーターを準備し、カウンタをリセットします。
//+------------------------------------------------------------------+
//| Setup our global variables                                       |
//+------------------------------------------------------------------+
void setup(void)
  {
   ma_c_handler = iMA(Symbol(),SYSTEM_TIME_FRAME,2,0,MODE_EMA,PRICE_CLOSE);
   ma_o_handler = iMA(Symbol(),SYSTEM_TIME_FRAME,2,0,MODE_EMA,PRICE_OPEN);
   count        = 0;
   last_value   = 0;
   trade_sl     = 1.5e-2;
  }
最後に、私たちの取引ルールは、モデルが学習データから得た係数の値によって生成されました。これは、プログラムの冒頭で作成したシステム変数を解除する前に定義する最後の関数です。
//+------------------------------------------------------------------+
//| Check if we have a trading setup                                 |
//+------------------------------------------------------------------+
void check_signal(void)
  {
   double current_reading = rsi_55.GetCurrentReading();
   Comment("Last Reading: ",last_value,"\nDifference in Reading: ",(last_value - current_reading));
   double bid = SymbolInfoDouble(Symbol(),SYMBOL_BID);
   double ask = SymbolInfoDouble(Symbol(),SYMBOL_ASK);
   double cp_lb = 7.17;
   double cp_ub = 10.82;

   if((((last_value - current_reading) <= -(cp_lb)) && ((last_value - current_reading) > (cp_ub)))|| ((((last_value - current_reading) > -(cp_lb))) && ((last_value - current_reading) < (cp_lb))))
     {
      if(ma_o[0] > ma_c[0])
        {
         if(PositionsTotal() == 0)
           {
            Trade.Sell(TRADING_VOLUME,Symbol(),bid,(ask+trade_sl),(ask-trade_sl));
            count = 0;
           }
        }
     }

   if(((last_value - current_reading) >= (cp_lb)) < ((last_value - current_reading) < cp_ub))
     {
      if(ma_c[0] < ma_o[0])
        {
         if(PositionsTotal() == 0)
           {
            Trade.Buy(TRADING_VOLUME,Symbol(),ask,(bid-trade_sl),(bid+trade_sl));
            count = 0;
           }
        }
     }
  }
//+------------------------------------------------------------------+

#undef RSI_BUFFER_SIZE
#undef RSI_PERIOD
#undef RSI_PRICE
#undef RSI_TIME_FRAME
#undef SYSTEM_TIME_FRAME
#undef TRADING_VOLUME
//+------------------------------------------------------------------+
それでは、取引システムのバックテストを始めましょう。図4で、バックテスト期間と重複するデータをすべて削除したことを思い出してください。したがって、これはリアルタイムでの戦略のパフォーマンスに近い近似値として機能するでしょう。2022年1月1日から2025年3月までの約3年間の日足データを使ってバックテストを実施します。

図14:取引戦略のバックテストに使用する日付
最良の結果を得るために、常に[実ティックに基づく全ティック]を使用します。これは、MetaTrader 5端末がブローカーから収集した過去のティックデータに基づき、市場の過去の状況を最も正確にシミュレーションするためです。
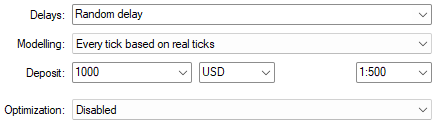
図15:テストを実行する条件は非常に重要であり、戦略の収益性を変える
ストラテジーテスターによって生成された資産曲線は有望に見えます。しかし、戦略のパフォーマンスを完全に把握するために、詳細な統計情報を一緒に解釈していきましょう。
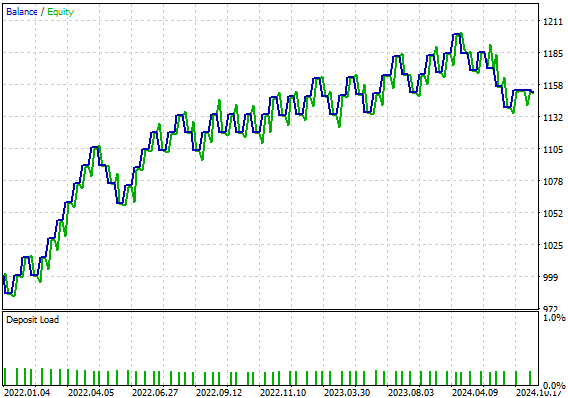
図16:EURUSDの55期間RSI取引戦略によって生成された資産曲線
戦略を実行すると、ストラテジーテスターで次の統計が生成されました。
- シャープレシオ:0.92
- 期待ペイオフ:2.49
- 総純利益:151.87ドル
- 勝率:57.38%
しかし、合計61回の取引のうち、ロング取引はわずか4回である点に注意してください。なぜ私たちの戦略はこれほどまでに売りに偏っているのでしょうか。この偏りをどのように修正できるでしょうか。もう一度EURUSDのチャートを見ながら、一緒にこの理由を考えてみましょう。

図17:EAによるEURUSD日足為替レートでの過去のパフォーマンスに関する詳細な統計
EAの改善
図18には、月足のEURUSD為替レートのスクリーンショットを添付しました。赤い縦線2本は、それぞれ2009年の始まりと2021年の終わりを示しています。緑の縦線は、私たちの統計モデルで使用した学習データの開始時点を表しています。2008年から続く強いベアトレンドの影響で、モデルがショートポジションに偏った学習をした理由が一目でわかります。
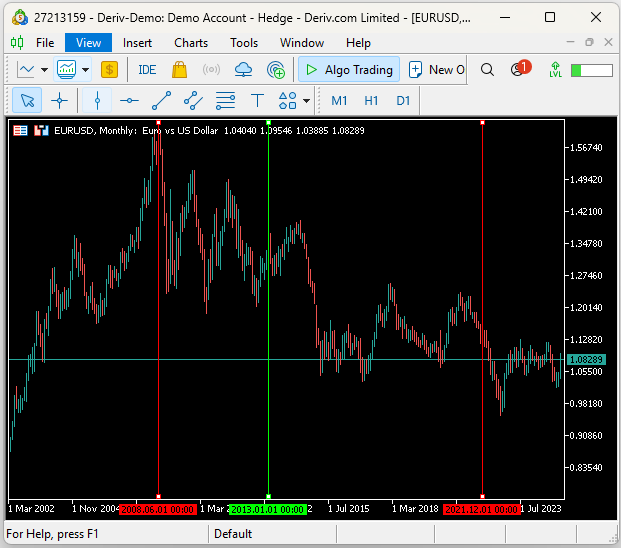
図18:モデルがなぜそのような弱気な感情を学習したのかを理解する
この偏りを修正するために必ずしもより多くの過去データが必要というわけではありません。むしろ、最初に使ったリッジ回帰モデルよりも柔軟性の高いモデルを適合させることで対応できます。より強力な学習モデルが、戦略に追加のロングシグナルをもたらしてくれます。
また、EAに対して、今後10日間で為替レートが上昇する確率の合理的な推定を与えることも可能です。ランダムフォレスト回帰モデルを用いて、強気の価格変動が起こる確率を予測し、その期待確率が0.5を超えた場合にはロングポジションを取るようにします。それ以外の場合は、リッジ回帰モデルから学んだ戦略に従います。
Pythonで確率をモデリングする
修正を始めるにあたり、まずいくつかのライブラリをインポートします。
from sklearn.metrics import accuracy_score
from sklearn.ensemble import RandomForestRegressor
次に、従属変数と独立変数を定義します。
#Independent variable
X = data[['Diff RSI 55']]
#Dependent variable
y = data['Target']
モデルを適合します。
model = RandomForestRegressor()
model.fit(X,y)
ONNXにエクスポートする準備をします。
import onnx
from skl2onnx import convert_sklearn
from skl2onnx.common.data_types import FloatTensorType
入力形状を定義します。
inital_params = [("float_input",FloatTensorType([1,1]))]
ONNXプロトタイプを作成し、ディスクに保存します。
onnx_proto = convert_sklearn(model=model,initial_types=inital_params,target_opset=12)
onnx.save(onnx_proto,"EURUSD Diff RSI 55 D1 1 1.onnx")
netronライブラリを使ってモデルを可視化することもできます。これにより、ONNXモデルに正しい入力および出力属性が設定されているかを確認できます。
import netron
netron.start("EURUSD Diff RSI 55 D1 1 1.onnx")
これは、私たちのランダムフォレスト回帰モデルとその属性をグラフィカルに表現したものです。Netronはニューラルネットワークやその他多くの種類のONNXモデルの可視化にも利用できます。

図19:ONNXランダムフォレスト回帰モデル
入力および出力の形状はONNXによって正しく指定されているため、次にランダムフォレスト回帰モデルを適用して、EAが今後10日間の強気の価格変動が起こる確率を予測できるように進めます。

図20:ONNXモデルの詳細は、確認したい予想仕様と一致している
EAの改善
EURUSD市場の確率モデルをエクスポートできたので、ONNXモデルをEAにインポートしましょう。
//+------------------------------------------------------------------+
//|                                  Algorithmic Input Selection.mq5 |
//|                                               Gamuchirai Ndawana |
//|                    https://www.mql5.com/ja/users/gamuchiraindawa |
//+------------------------------------------------------------------+
#property copyright "Gamuchirai Ndawana"
#property link      "https://www.mql5.com/ja/users/gamuchiraindawa"
#property version   "1.00"

//+------------------------------------------------------------------+
//| System resources                                                 |
//+------------------------------------------------------------------+
#resource "\\Files\\EURUSD Diff RSI 55 D1 1 1.onnx" as uchar onnx_model_buffer[];
ONNXモデルの形状を指定するための新しいマクロもいくつか必要になります。
#define ONNX_INPUTS 1
#define ONNX_OUTPUTS 1
さらに、ONNXモデルにはいくつかのグローバル変数が必要です。コードの複数の箇所で素早くアクセスする可能性があるためです。
long   onnx_model;
vectorf onnx_output(1);
vectorf onnx_input(1);
以下のコードスニペットでは、変更のない部分は省略し、ONNXモデルの初期化とパラメータ形状の設定に関する変更点のみを示しています。
//+------------------------------------------------------------------+
//| Setup our global variables                                       |
//+------------------------------------------------------------------+
bool setup(void)
  {
//--- Setup our technical indicators
  ...

//--- Create our ONNX model
   onnx_model = OnnxCreateFromBuffer(onnx_model_buffer,ONNX_DATA_TYPE_FLOAT);

//--- Validate the ONNX model
   if(onnx_model == INVALID_HANDLE)
     {
      return(false);
     }

//--- Define the I/O signature
   ulong onnx_param[] =  {1,1};

   if(!OnnxSetInputShape(onnx_model,0,onnx_param))
      return(false);

   if(!OnnxSetOutputShape(onnx_model,0,onnx_param))
      return(false);

   return(true);
  }
さらに、有効な取引判定のチェック部分は、追加されたコードのみを強調し、同じコードの重複を避けるために簡略化しています。
//+------------------------------------------------------------------+
//| Check if we have a trading setup                                 |
//+------------------------------------------------------------------+
void check_signal(void)
  {
   rsi_55.SetDifferencedIndicatorValues(RSI_BUFFER_SIZE,HORIZON,true);
   onnx_input[0] = (float) rsi_55.GetDifferencedReadingAt(RSI_BUFFER_SIZE - 1);

//--- Our Random forest model
   if(!OnnxRun(onnx_model,ONNX_DATA_TYPE_FLOAT,onnx_input,onnx_output))
      Comment("Failed to obtain a forecast from our model!");

   else
     {
      if(onnx_output[0] > 0.5)
         if(ma_o[0] < ma_c[0])
            Trade.Buy(TRADING_VOLUME,Symbol(),ask,(bid-trade_sl),(bid+trade_sl));
      Print("Model Bullish Probabilty: ",onnx_output);
     }
}
まとめると、これが完全に組み上げた取引戦略の第2バージョンの全体像です。
//+------------------------------------------------------------------+
//|                                  Algorithmic Input Selection.mq5 |
//|                                               Gamuchirai Ndawana |
//|                    https://www.mql5.com/ja/users/gamuchiraindawa |
//+------------------------------------------------------------------+
#property copyright "Gamuchirai Ndawana"
#property link      "https://www.mql5.com/ja/users/gamuchiraindawa"
#property version   "1.00"

//+------------------------------------------------------------------+
//| System resources                                                 |
//+------------------------------------------------------------------+
#resource "\\Files\\EURUSD Diff RSI 55 D1 1 1.onnx" as uchar onnx_model_buffer[];

//+------------------------------------------------------------------+
//| System constants                                                 |
//+------------------------------------------------------------------+
#define RSI_PERIOD 55
#define RSI_TIME_FRAME PERIOD_D1
#define SYSTEM_TIME_FRAME PERIOD_D1
#define RSI_PRICE  PRICE_CLOSE
#define RSI_BUFFER_SIZE 20
#define TRADING_VOLUME SymbolInfoDouble(Symbol(),SYMBOL_VOLUME_MIN)
#define ONNX_INPUTS 1
#define ONNX_OUTPUTS 1
#define HORIZON 10

//+------------------------------------------------------------------+
//| Load our RSI library                                             |
//+------------------------------------------------------------------+
#include <VolatilityDoctor\Indicators\RSI.mqh>
#include <Trade\Trade.mqh>

//+------------------------------------------------------------------+
//| Global variables                                                 |
//+------------------------------------------------------------------+
CTrade Trade;
RSI    rsi_55(Symbol(),RSI_TIME_FRAME,RSI_PERIOD,RSI_PRICE);
double last_value;
int    count;
int    ma_o_handler,ma_c_handler;
double ma_o[],ma_c[];
double trade_sl;
long   onnx_model;
vectorf onnx_output(1);
vectorf onnx_input(1);

//+------------------------------------------------------------------+
//| Expert initialization function                                   |
//+------------------------------------------------------------------+
int OnInit()
  {
//---
   setup();
//---
   return(INIT_SUCCEEDED);
  }
//+------------------------------------------------------------------+
//| Expert deinitialization function                                 |
//+------------------------------------------------------------------+
void OnDeinit(const int reason)
  {
//---
   IndicatorRelease(ma_c_handler);
   IndicatorRelease(ma_o_handler);
  }
//+------------------------------------------------------------------+
//| Expert tick function                                             |
//+------------------------------------------------------------------+
void OnTick()
  {
//---
   update();
  }
//+------------------------------------------------------------------+

//+------------------------------------------------------------------+
//| Update our system variables                                      |
//+------------------------------------------------------------------+
void update(void)
  {
   static datetime time_stamp;
   datetime current_time = iTime(Symbol(),SYSTEM_TIME_FRAME,0);

   if(time_stamp != current_time)
     {
      time_stamp = current_time;
      CopyBuffer(ma_c_handler,0,0,1,ma_c);
      CopyBuffer(ma_o_handler,0,0,1,ma_o);

      if((count == 0) && (PositionsTotal() == 0))
        {
         rsi_55.SetIndicatorValues(RSI_BUFFER_SIZE,true);
         rsi_55.SetDifferencedIndicatorValues(RSI_BUFFER_SIZE,HORIZON,true);
         last_value = rsi_55.GetReadingAt(RSI_BUFFER_SIZE - 1);
         count = 1;
        }

      if(PositionsTotal() == 0)
         check_signal();

      if(PositionsTotal() > 0)
         manage_setup();
     }
  }

//+------------------------------------------------------------------+
//| Manage our open trades                                           |
//+------------------------------------------------------------------+
void manage_setup(void)
  {
   double bid = SymbolInfoDouble(Symbol(),SYMBOL_BID);
   double ask = SymbolInfoDouble(Symbol(),SYMBOL_ASK);

   if(PositionSelect(Symbol()))
     {
      double current_sl = PositionGetDouble(POSITION_SL);
      double current_tp = PositionGetDouble(POSITION_TP);
      double new_sl = (current_tp > current_sl) ? (bid-trade_sl) : (ask+trade_sl);
      double new_tp = (current_tp < current_sl) ? (bid+trade_sl) : (ask-trade_sl);
      //--- Buy setup
      if((current_tp > current_sl) && (new_sl < current_sl))
         Trade.PositionModify(Symbol(),new_sl,new_tp);

      //--- Sell setup
      if((current_tp < current_sl) && (new_sl > current_sl))
         Trade.PositionModify(Symbol(),new_sl,new_tp);
     }
  }

//+------------------------------------------------------------------+
//| Setup our global variables                                       |
//+------------------------------------------------------------------+
bool setup(void)
  {
//--- Setup our technical indicators
   ma_c_handler = iMA(Symbol(),SYSTEM_TIME_FRAME,2,0,MODE_EMA,PRICE_CLOSE);
   ma_o_handler = iMA(Symbol(),SYSTEM_TIME_FRAME,2,0,MODE_EMA,PRICE_OPEN);
   count        = 0;
   last_value   = 0;
   trade_sl     = 1.5e-2;

//--- Create our ONNX model
   onnx_model = OnnxCreateFromBuffer(onnx_model_buffer,ONNX_DATA_TYPE_FLOAT);

//--- Validate the ONNX model
   if(onnx_model == INVALID_HANDLE)
     {
      return(false);
     }

//--- Define the I/O signature
   ulong onnx_param[] =  {1,1};

   if(!OnnxSetInputShape(onnx_model,0,onnx_param))
      return(false);

   if(!OnnxSetOutputShape(onnx_model,0,onnx_param))
      return(false);

   return(true);
  }

//+------------------------------------------------------------------+
//| Check if we have a trading setup                                 |
//+------------------------------------------------------------------+
void check_signal(void)
  {
   rsi_55.SetDifferencedIndicatorValues(RSI_BUFFER_SIZE,HORIZON,true);
   last_value = rsi_55.GetReadingAt(RSI_BUFFER_SIZE - 1);

   double current_reading = rsi_55.GetCurrentReading();
   Comment("Last Reading: ",last_value,"\nDifference in Reading: ",(last_value - current_reading));
   double bid = SymbolInfoDouble(Symbol(),SYMBOL_BID);
   double ask = SymbolInfoDouble(Symbol(),SYMBOL_ASK);
   double cp_lb = 7.17;
   double cp_ub = 10.82;
   onnx_input[0] = (float) rsi_55.GetDifferencedReadingAt(RSI_BUFFER_SIZE - 1);

//--- Our Random forest model
   if(!OnnxRun(onnx_model,ONNX_DATA_TYPE_FLOAT,onnx_input,onnx_output))
      Comment("Failed to obtain a forecast from our model!");

   else
     {
      if(onnx_output[0] > 0.5)
         if(ma_o[0] < ma_c[0])
            Trade.Buy(TRADING_VOLUME,Symbol(),ask,(bid-trade_sl),(bid+trade_sl));
      Print("Model Bullish Probabilty: ",onnx_output);
     }

//--- The trading rules we learned from our Ridge Regression Model
//--- Ridge Regression Sell
   if((((last_value - current_reading) <= -(cp_lb)) && ((last_value - current_reading) > (cp_ub)))|| ((((last_value - current_reading) > -(cp_lb))) && ((last_value - current_reading) < (cp_lb))))
     {
      if(ma_o[0] > ma_c[0])
        {
         if(PositionsTotal() == 0)
           {
            Trade.Sell(TRADING_VOLUME,Symbol(),bid,(ask+trade_sl),(ask-trade_sl));
            count = 0;
           }
        }
     }
//--- Ridge Regression Buy
   else
      if(((last_value - current_reading) >= (cp_lb)) < ((last_value - current_reading) < cp_ub))
        {
         if(ma_c[0] < ma_o[0])
           {
            if(PositionsTotal() == 0)
              {
               Trade.Buy(TRADING_VOLUME,Symbol(),ask,(bid-trade_sl),(bid+trade_sl));
               count = 0;
              }
           }
        }
  }
//+------------------------------------------------------------------+

#undef RSI_BUFFER_SIZE
#undef RSI_PERIOD
#undef RSI_PRICE
#undef RSI_TIME_FRAME
#undef SYSTEM_TIME_FRAME
#undef TRADING_VOLUME
#undef ONNX_INPUTS
#undef ONNX_OUTPUTS
//+------------------------------------------------------------------+
図14および図15で示したのと同じ条件下で、戦略のテストをおこないます。こちらが取引戦略の第2バージョンで得られた結果です。第2バージョンで生成された資産曲線は、最初に作成した資産曲線とほぼ同じように見えます。
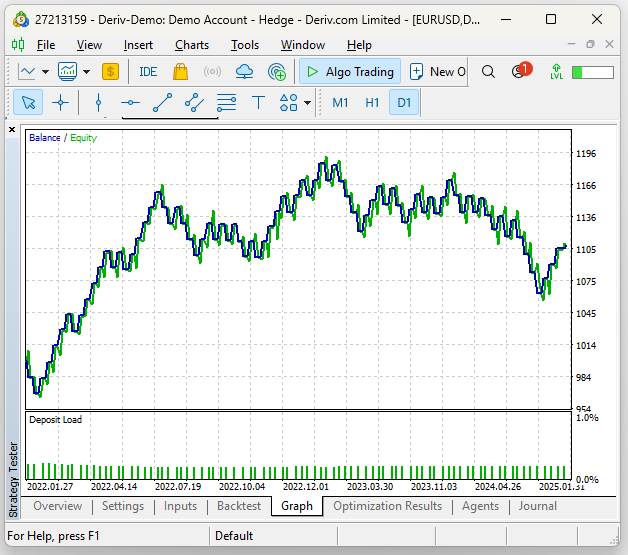
図21:2番目の取引戦略の収益性
詳細な統計を見て初めて、2つの戦略の違いが明らかになってきます。シャープレシオと期待ペイオフは下がりました。新しい戦略は85回の取引をおこない、これは初期の戦略の61回より39%多くなっています。さらに、ロングポジションの総数は初期テストのわずか4回から第2回のテストでは42回に増加し、950%の増加となりました。つまり、取っている追加リスクはかなり大きいにもかかわらず、精度と収益性の統計はわずかにしか低下していません。これにより、この戦略を使うことに対して前向きな期待を持ち始めることができます。前回のテストでは全取引の57.38%が利益を出していましたが、今回は56.47%となり、精度は約1.59%の減少です。
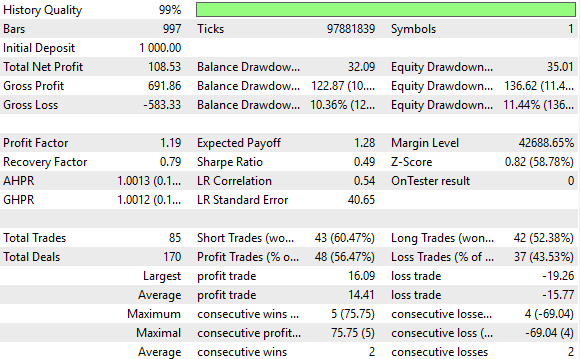
図22:取引戦略の改訂版のパフォーマンスに関する詳細な統計
結論
この記事を読み終えた読者は、複数回のバックテストを行い手作業で全ての期間を調査することなく、グリッドサーチ技法と統計モデルを組み合わせて最適なインジケーター期間を選択する方法を理解できるようになります。さらに、読者は従来の70と30のRSIレベルと比較して、新たに取引したいRSIレベルの価値を推定・比較する一つの方法も学び、対立的な市場環境でも自信を持って取引をおこなうことができるようになります。
| ファイル名 | 説明 |
|---|---|
| Algorithmic Inputs Selection.ipynb | Pythonを使用して数値解析を実行するために使用したJupyter Notebook |
| EURUSD Testing RSI Class.mql5 | カスタムRSIクラスの実装をテストするために使用した MQL5スクリプト |
| EURUSD RSI Algorithmic Input Selection.mql5 | 過去の市場データを取得するために使用したスクリプト |
| Algorithmic Input Selection.mql5 | 私たちが構築した取引戦略の初期バージョン |
| Algorithmic Input Selection 2.mql5 | 最初の取引戦略によって学習されたバイアスを修正した、改良された取引戦略バージョン |
MetaQuotes Ltdにより英語から翻訳されました。
元の記事: https://www.mql5.com/en/articles/17571
警告: これらの資料についてのすべての権利はMetaQuotes Ltd.が保有しています。これらの資料の全部または一部の複製や再プリントは禁じられています。
この記事はサイトのユーザーによって執筆されたものであり、著者の個人的な見解を反映しています。MetaQuotes Ltdは、提示された情報の正確性や、記載されているソリューション、戦略、または推奨事項の使用によって生じたいかなる結果についても責任を負いません。

- 無料取引アプリ
- 8千を超えるシグナルをコピー
- 金融ニュースで金融マーケットを探索