
在 MQL5 中构建自优化EA(第六部分):自适应交易规则(二)

在我们上次关于自适应交易规则的讨论中(链接在此),我们探讨了量化交易者在尝试如何更好地使用 RSI 指标时所面临的问题。
我们发现,该指标并不总是能生成标准化的结果,这取决于几个因素,例如周期、时间框架以及所讨论的特定市场。
为了解决这个问题,我们假设量化交易者可以研究指标的真实范围,以便他们可以将指标的中间点重新调整到其观测范围的中间,而不是其所有可能范围。这样做,我们可以保证交易信号的生成,这是我们从 RSI 的传统规则中无法获得的。我们通过记录偏离中间点的平均偏差,获得了对新信号的额外控制,并且只记录由平均偏差的倍数所产生的信号。
现在,我们将超越最初构建实用解决方案的尝试。相较于我们上次的尝试,可以做出几项改进。尝试估算选择 RSI 水平值的能力是我们寻求的根本性改进。
在上次的讨论中,我们简单地假设远大于平均偏差的偏差往往可能更有利可图。然而,我们并没有尝试去衡量这是否属实。我们没有尝试量化我们提出的新RSI水平值,并将它们与传统水平 70 和 30 的值进行比较。
此外,之前的讨论认为 RSI 周期是固定。这个简化的假设使我们的框架更容易理解。今天,我们将把注意力转向问题的另一端,即当交易者不确定应使用哪个正确周期时的情况。
图形化相关问题
以防有新的读者,在下面的图 1 中,我们附上了一张 EURUSD 日线图的截图,图中使用了一个 2 周期的 RSI。

图 1:将我们的 RSI 图形化,展示短周期所产生的信号质量。
在图 1 下方,我们在图 2 中对图表的相同部分应用了一个 70 周期的 RSI。我们可以观察到 RSI 信号正逐渐变成一条以 50 RSI 水平为中心的平坦直线。当我们比较这两张图片时,可以得出什么信息呢?嗯,值得一提的是,在两张图所捕捉的 EURUSD 期间内,汇率简单地从 2024 年 9 月 18 日的 1.121 价格水平下跌到 12 月 2 日的 1.051 低点。然而,在同一时间内,2 周期的 RSI 变化水平过于频繁,而 70 周期的 RSI 则根本没有变化水平。
这是否意味着交易者在使用 RSI 时,应该永远被限制在只使用一个狭窄的周期范围内?我们需要做什么,才能设计出无需人工干预即可自动选择良好 RSI 周期的算法?此外,如何编写算法,来帮助我们找到良好的交易水平,无论最初从哪个周期开始?

图 2:将我们的 RSI 指标在长周期下运行的可视化。
在 MQL5 中开始
我们可以通过多种方式来解决这个问题。可以使用 Python 中的库来生成不同周期的 RSI 读数,并以这种方式优化我们的周期和 RSI 水平。然而,这会引入潜在的缺点。最大的限制可能来自于计算这些技术指标值背后所实现的计算方式的细微差异。为了避免这种情况,我们将在 MQL5 中实现我们的解决方案。通过构建一个 RSI 类,我们可以快速地将多个 RSI 值的实例记录到一个 CSV 文件中,并使用这些值在 Python 中进行数值分析,以估算最优的 RSI 周期,以及除 70 和 30 之外的替代使用水平。
我们将首先创建一个脚本,允许我们首先手动检索 RSI 值并计算 RSI 水平的变化。然后,我们将创建一个类,封装所需功能。我们希望创建一个 RSI 读数的网格,其周期以 5 为步长递增,从 5 到 70。但在实现这一点之前,需要实现并测试我们的类。
在脚本中构建该类将使我们能够快速地将类的输出与从指标手动获得的标准输出进行比较。如果我们对类的定义足够好,那么两种方法生成的输出应该相同。这将为我们提供一个有用的类,用于生成具有不同周期的 14 个 RSI 指标,同时跟踪每个 RSI 实例的变化,适用于我们可能希望交易的任何其他品种。
考虑到我们希望对这个 RSI 类进行的用途,开始确保该类有一种机制,以防止我们在相应地设置缓冲区之前尝试读取指标的值,这是合理的。我们将首先构建我们类的这一部分。我们需要声明我们类的私有成员。这些私有的布尔标志将防止从指标缓冲区复制之前读取 RSI 值。
//+------------------------------------------------------------------+
//|                                                      ProjectName |
//|                                      Copyright 2020, CompanyName |
//|                                       http://www.companyname.net |
//+------------------------------------------------------------------+
#property copyright "Copyright 2024, MetaQuotes Ltd."
#property link      "https://www.mql5.com"
#property version   "1.00"
#property script_show_inputs

//--- The RSI class will manage our indicator settings and provide useful transformations we need
class RSI
  {
   //--- Private members
private:
   //--- Have the indicator values been copied to the buffer?
   bool              indicator_values_initialized;
   bool              indicator_differenced_values_initialized;
我还包含了一个返回字符串的方法,用以提示用户对象内部正在发生什么,以及如何解决问题。该方法接收一个整数参数,该参数指明了错误是在代码的哪个位置生成的。因此,解决方案通常很容易以在终端中打印消息的形式提供建议。
//--- Give the user feedback
string            user_feedback(int flag)
  {
   string message;

   //--- Check if the RSI indicator loaded correctly
   if(flag == 0)
     {
      //--- Check the indicator was loaded correctly
      if(IsValid())
         message = "RSI Indicator Class Loaded Correcrtly \n";
      return(message);
      //--- Something went wrong
      message = "Error loading RSI Indicator: [ERROR] " + (string) GetLastError();
      return(message);
     }

   //--- User tried getting indicator values before setting them
   if(flag == 1)
     {
      message = "Please set the indicator values before trying to fetch them from memory";
      return(message);
     }

   //--- We sueccessfully set our differenced indicator values
   if(flag == 2)
     {
      message = "Succesfully set differenced indicator values.";
      return(message);
     }

   //--- Failed  to set our differenced indicator values
   if(flag == 3)
     {
      message = "Failed to set our differenced indicator values: [ERROR] " + (string) GetLastError();
      return(message);
     }

   //--- The user is trying to retrieve an index beyond the buffer size and must update the buffer size first
   if(flag == 4)
     {
      message = "The user is attempting to use call an index beyond the buffer size, update the buffer size first";
      return(message);
     }

   //--- No feedback
   else
      return("");
  }
现在,我们将定义类的受保护成员。这些成员将构成初始化 iRSI() 类实例并与指标缓冲区交互所需的可变部分。
   //--- Protected members
protected:
   //--- The handler for our RSI
   int               rsi_handler;
   //--- The Symbol our RSI should be applied on
   string            rsi_symbol;
   //--- Our RSI period
   int               rsi_period;
   //--- How far into the future we wish to forecast
   int               forecast_horizon;
   //--- The buffer for our RSI indicator
   double            rsi_reading[];
   vector            rsi_differenced_values;
   //--- The current size of the buffer the user last requested
   int               rsi_buffer_size;
   int               rsi_differenced_buffer_size;
   //--- The time frame our RSI should be applied on
   ENUM_TIMEFRAMES   rsi_time_frame;
   //--- The price should the RSI be applied on
   ENUM_APPLIED_PRICE rsi_price;
接下来是公共类成员。我们需要的第一个函数是告知我们我们的指标句柄是否有效。如果我们的指标句柄没有正确设置,我们可以立即通知用户。
//--- Now, we can define public members:
public:

   //--- Check if our indicator handler is valid
   bool              IsValid(void)
     {
      return((this.rsi_handler != INVALID_HANDLE));
     }
我们的默认构造函数将创建一个 iRSI 对象,该对象设置为在日线图上对 EURUSD 进行操作,周期为 5 天。为确保这是用户的预期选择,我们的类会打印出它正在处理的市场和周期。此外,默认构造函数会专门向用户打印出,当前的 RSI 对象实例是由默认构造函数构建的。
//--- Our default constructor
void              RSI(void):
                  indicator_values_initialized(false),
                  rsi_symbol("EURUSD"),
                  rsi_time_frame(PERIOD_D1),
                  rsi_period(5),
                  rsi_price(PRICE_CLOSE),
                  rsi_handler(iRSI(rsi_symbol,rsi_time_frame,rsi_period,rsi_price))
  {
   //--- Give the user feedback on initilization
   Print(user_feedback(0));
   //--- Remind the user they called the default constructor
   Print("Default Constructor Called: ",__FUNCSIG__," ",&this);
  }
否则,我们期望用户调用 RSI 对象的参数化构造函数,并指定您需要的所有必要参数。
//--- Parametric constructor
   void              RSI(string user_symbol,ENUM_TIMEFRAMES user_time_frame,int user_period,ENUM_APPLIED_PRICE user_price)
     {
      indicator_values_initialized = false;
      rsi_symbol                   = user_symbol;
      rsi_time_frame               = user_time_frame;
      rsi_period                   = user_period;
      rsi_price                    = user_price;
      rsi_handler                  = iRSI(rsi_symbol,rsi_time_frame,rsi_period,rsi_price);
      //--- Give the user feedback on initilization
      Print(user_feedback(0));
     }
我们还需要一个析构函数来释放不再需要的系统资源,以便我们能够自行清理。
//--- Destructor
void             ~RSI(void)
  {
   //--- Free up resources we don't need and reset our flags
   if(IndicatorRelease(rsi_handler))
     {
      indicator_differenced_values_initialized = false;
      indicator_values_initialized = false;
      Print("RSI System logging off");
     }
  }
现在,与指标缓冲区交互的方法是我们类的关键组成部分。我们要求用户指定应从缓冲区复制多少个值,以及这些值是否应按时间序列排列。然后,我们进行测试,以确保在方法调用结束前,RSI 值不会返回空值。
//--- Copy readings for our RSI indicator
bool              SetIndicatorValues(int buffer_size,bool set_as_series)
  {
   rsi_buffer_size = buffer_size;
   CopyBuffer(this.rsi_handler,0,0,buffer_size,rsi_reading);
   if(set_as_series)
      ArraySetAsSeries(this.rsi_reading,true);
   indicator_values_initialized = true;

   //--- Did something go wrong?
   vector rsi_test;
   rsi_test.CopyIndicatorBuffer(rsi_handler,0,0,buffer_size);
   if(rsi_test.Sum() == 0)
      return(false);

   //--- Everything went fine.
   return(true);
  }
一个获取RSI读书的简单函数。
//--- Get the current RSI reading
double            GetCurrentReading(void)
  {
   double temp[];
   CopyBuffer(this.rsi_handler,0,0,1,temp);
   return(temp[0]);
  }
我们可能还需要获取特定索引处的值,而不仅仅是最近的值。GetReadingAt() 这个函数就为我们提供了这个实用工具。该函数首先检查以确保我们不会超出从指标复制的缓冲区的大小。如果使用正确,该函数将返回指定索引处的指标读数。否则,将给出一条错误消息。
//--- Get a specific RSI reading
double            GetReadingAt(int index)
  {
   //--- Is the user trying to call indexes beyond the buffer?
   if(index > rsi_buffer_size)
     {
      Print(user_feedback(4));
      return(-1e10);
     }

   //--- Get the reading at the specified index
   if((indicator_values_initialized) && (index < rsi_buffer_size))
      return(rsi_reading[index]);

   //--- User is trying to get values that were not set prior
   else
    {
      Print(user_feedback(1));
      return(-1e10);
     }
  }
我们还对 RSI 值的变化感兴趣。仅仅能够获取当前的 RSI 读数对我们来说是不够的。我们还希望能够获取在任意指定的窗口大小内发生的 RSI 水平的变化。和之前一样,我们只是在幕后为用户调用 CopyBuffer 函数来计算 RSI 水平的增长,但该类还包含了一项额外的检查,以确保在将其找到的答案返回给用户之前,计算结果不是一个全为零的向量。
//--- Let's set the conditions for our differenced data
 bool              SetDifferencedIndicatorValues(int buffer_size,int differencing_period,bool set_as_series)
   {
    //--- Internal variables
    rsi_differenced_buffer_size = buffer_size;
    rsi_differenced_values = vector::Zeros(rsi_differenced_buffer_size);

    //--- Prepare to record the differences in our RSI readings
    double temp_buffer[];
    int fetch = (rsi_differenced_buffer_size + (2 * differencing_period));
    CopyBuffer(rsi_handler,0,0,fetch,temp_buffer);
    if(set_as_series)
       ArraySetAsSeries(temp_buffer,true);

    //--- Fill in our values iteratively
    for(int i = rsi_differenced_buffer_size;i > 1; i--)
      {
       rsi_differenced_values[i-1] = temp_buffer[i-1] - temp_buffer[i-1+differencing_period];
      }

    //--- If the norm of a vector is 0, the vector is empty!
    if(rsi_differenced_values.Norm(VECTOR_NORM_P) != 0)
      {
       Print(user_feedback(2));
       indicator_differenced_values_initialized = true;
       return(true);
      }

    indicator_differenced_values_initialized = false;
    Print(user_feedback(3));
    return(false);
   }
最后,我们需要一个方法来获取特定索引值处的差分 RSI 值。同样,我们的函数确保用户不会试图调用超出已复制缓冲区范围的值。在这种情况下,用户应首先更新缓冲区大小,然后相应地复制他们所需的索引值。
//--- Get a differenced value at a specific index
double            GetDifferencedReadingAt(int index)
  {
   //--- Make sure we're not trying to call values beyond our index
   if(index > rsi_differenced_buffer_size)
     {
      Print(user_feedback(4));
      return(-1e10);
     }

   //--- Make sure our values have been set
   if(!indicator_differenced_values_initialized)
     {

      //--- The user is trying to use values before they were set in memory
      Print(user_feedback(1));
      return(-1e10);
     }

   //--- Return the differenced value of our indicator at a specific index
   if((indicator_differenced_values_initialized) && (index < rsi_differenced_buffer_size))
      return(rsi_differenced_values[index]);

   //--- Something went wrong.
   return(-1e10);
  }
};
构建我们测试的其余部分很简单。我们将手动控制一个 RSI 指标的类似实例,该实例使用相同的设置进行初始化。如果我们将两个读数写入同一个文件,我们应该会观察到重复的信息。否则,就意味着我们在类的实现中犯了错误。
//--- How far we want to forecast
#define HORIZON 10

//--- Our handlers for our indicators
int rsi_5_handle;

//--- Data structures to store the readings from our indicators
double rsi_5_reading[];

//--- File name
string file_name = Symbol() + " Testing RSI Class.csv";

//--- Amount of data requested
input int size = 3000;
对于我们脚本的其余部分,我们只需要初始化我们的 RSI 类,并使用与一个重复但手动控制的 RSI 版本相同的参数来设置它。
//+------------------------------------------------------------------+
//| Our script execution                                             |
//+------------------------------------------------------------------+
void OnStart()
  {
//--- Testing the RSI Class
//--- Initialize the class
   RSI my_rsi(Symbol(),PERIOD_CURRENT,5,PRICE_CLOSE);
   my_rsi.SetIndicatorValues(size,true);
   my_rsi.SetDifferencedIndicatorValues(size,10,true);

//---Setup our technical indicators
   rsi_5_handle  = iRSI(Symbol(),PERIOD_CURRENT,5,PRICE_CLOSE);
   int fetch = size + (2 * HORIZON);

//---Set the values as series
   CopyBuffer(rsi_5_handle,0,0,fetch,rsi_5_reading);
   ArraySetAsSeries(rsi_5_reading,true);

//---Write to file
   int file_handle=FileOpen(file_name,FILE_WRITE|FILE_ANSI|FILE_CSV,",");

   for(int i=size;i>=1;i--)
     {
      if(i == size)
        {
         FileWrite(file_handle,"Time","RSI 5","RSI 5 Class","RSI 5 Difference","RSI 5 Class Difference");
        }

      else
        {
         FileWrite(file_handle,
                   iTime(_Symbol,PERIOD_CURRENT,i),
                   rsi_5_reading[i],
                   my_rsi.GetReadingAt(i),
                   rsi_5_reading[i]  - rsi_5_reading[i + HORIZON],
                   my_rsi.GetDifferencedReadingAt(i)
                  );
        }
     }
//--- Close the file
   FileClose(file_handle);
  }
//+------------------------------------------------------------------+
#undef  HORIZON
如果我们的类实现正确,我们的测试脚本将生成一个名为“EURUSD Testing RSI Class.csv”的文件,其中将包含重复的 RSI 读数。从图 3 中可以看到,我们的 RSI 类通过了测试。这个类为我们节省了时间,因为我们不必在多个项目中重复实现相同的方法。我们只需导入我们的 RSI 类,并调用我们需要的方法即可。
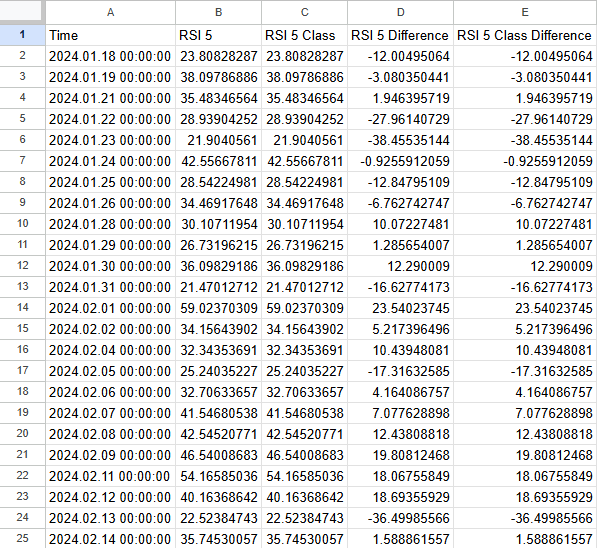
图 3:我们的 RSI 类通过了测试,使用它与手动使用 RSI 指标类是相同的。
既然我们对类的实现充满信心,那么让我们将这个类写到一个专门的包含文件中,这样我们就可以将该类与我们的EA以及未来可能需要相同功能集的任何其他练习共享。当完全组合完毕后,这就是我们类当前的形式。
//+------------------------------------------------------------------+
//|                                                          RSI.mqh |
//|                                               Gamuchirai Ndawana |
//|                    https://www.mql5.com/en/users/gamuchiraindawa |
//+------------------------------------------------------------------+
#property copyright "Gamuchirai Ndawana"
#property link      "https://www.mql5.com/en/users/gamuchiraindawa"
#property version   "1.00"

//+------------------------------------------------------------------+
//| This class will provide us with usefull functionality            |
//+------------------------------------------------------------------+
class RSI
  {
private:
   //--- Have the indicator values been copied to the buffer?
   bool              indicator_values_initialized;
   bool              indicator_differenced_values_initialized;

   //--- Give the user feedback
   string            user_feedback(int flag);

protected:
   //--- The handler for our RSI
   int               rsi_handler;
   //--- The Symbol our RSI should be applied on
   string            rsi_symbol;
   //--- Our RSI period
   int               rsi_period;
   //--- How far into the future we wish to forecast
   int               forecast_horizon;
   //--- The buffer for our RSI indicator
   double            rsi_reading[];
   vector            rsi_differenced_values;
   //--- The current size of the buffer the user last requested
   int               rsi_buffer_size;
   int               rsi_differenced_buffer_size;
   //--- The time frame our RSI should be applied on
   ENUM_TIMEFRAMES   rsi_time_frame;
   //--- The price should the RSI be applied on
   ENUM_APPLIED_PRICE rsi_price;

public:
                     RSI();
                     RSI(string user_symbol,ENUM_TIMEFRAMES user_time_frame,int user_period,ENUM_APPLIED_PRICE user_price);
                    ~RSI();
   bool              SetIndicatorValues(int buffer_size,bool set_as_series);
   bool              IsValid(void);
   double            GetCurrentReading(void);
   double            GetReadingAt(int index);
   bool              SetDifferencedIndicatorValues(int buffer_size,int differencing_period,bool set_as_series);
   double            GetDifferencedReadingAt(int index);
  };
//+------------------------------------------------------------------+
//| Our default constructor for our RSI class                        |
//+------------------------------------------------------------------+
void RSI::RSI()
  {
   indicator_values_initialized = false;
   rsi_symbol                   = "EURUSD";
   rsi_time_frame               = PERIOD_D1;
   rsi_period                   = 5;
   rsi_price                    = PRICE_CLOSE;
   rsi_handler                  = iRSI(rsi_symbol,rsi_time_frame,rsi_period,rsi_price);
//--- Give the user feedback on initilization
   Print(user_feedback(0));
//--- Remind the user they called the default constructor
   Print("Default Constructor Called: ",__FUNCSIG__," ",&this);
  }

//+------------------------------------------------------------------+
//| Our parametric constructor for our RSI class                     |
//+------------------------------------------------------------------+
void RSI::RSI(string user_symbol,ENUM_TIMEFRAMES user_time_frame,int user_period,ENUM_APPLIED_PRICE user_price)
  {
   indicator_values_initialized = false;
   rsi_symbol                   = user_symbol;
   rsi_time_frame               = user_time_frame;
   rsi_period                   = user_period;
   rsi_price                    = user_price;
   rsi_handler                  = iRSI(rsi_symbol,rsi_time_frame,rsi_period,rsi_price);
//--- Give the user feedback on initilization
   Print(user_feedback(0));
  }

//+------------------------------------------------------------------+
//| Our destructor for our RSI class                                 |
//+------------------------------------------------------------------+
void RSI::~RSI()
  {
//--- Free up resources we don't need and reset our flags
   if(IndicatorRelease(rsi_handler))
     {
      indicator_differenced_values_initialized = false;
      indicator_values_initialized = false;
      Print(user_feedback(5));
     }
  }

//+------------------------------------------------------------------+
//| Get our current reading from the RSI indicator                   |
//+------------------------------------------------------------------+
double RSI::GetCurrentReading(void)
  {
   double temp[];
   CopyBuffer(this.rsi_handler,0,0,1,temp);
   return(temp[0]);
  }

//+------------------------------------------------------------------+
//| Set our indicator values and our buffer size                     |
//+------------------------------------------------------------------+
bool              RSI::SetIndicatorValues(int buffer_size,bool set_as_series)
  {
   rsi_buffer_size = buffer_size;
   CopyBuffer(this.rsi_handler,0,0,buffer_size,rsi_reading);
   if(set_as_series)
      ArraySetAsSeries(this.rsi_reading,true);
   indicator_values_initialized = true;

//--- Did something go wrong?
   vector rsi_test;
   rsi_test.CopyIndicatorBuffer(rsi_handler,0,0,buffer_size);
   if(rsi_test.Sum() == 0)
      return(false);

//--- Everything went fine.
   return(true);
  }
//+--------------------------------------------------------------+
//| Let's set the conditions for our differenced data            |
//+--------------------------------------------------------------+
bool              RSI::SetDifferencedIndicatorValues(int buffer_size,int differencing_period,bool set_as_series)
  {
//--- Internal variables
   rsi_differenced_buffer_size = buffer_size;
   rsi_differenced_values = vector::Zeros(rsi_differenced_buffer_size);

//--- Prepare to record the differences in our RSI readings
   double temp_buffer[];
   int fetch = (rsi_differenced_buffer_size + (2 * differencing_period));
   CopyBuffer(rsi_handler,0,0,fetch,temp_buffer);
   if(set_as_series)
      ArraySetAsSeries(temp_buffer,true);

//--- Fill in our values iteratively
   for(int i = rsi_differenced_buffer_size;i > 1; i--)
     {
      rsi_differenced_values[i-1] = temp_buffer[i-1] - temp_buffer[i-1+differencing_period];
     }

//--- If the norm of a vector is 0, the vector is empty!
   if(rsi_differenced_values.Norm(VECTOR_NORM_P) != 0)
     {
      Print(user_feedback(2));
      indicator_differenced_values_initialized = true;
      return(true);
     }

   indicator_differenced_values_initialized = false;
   Print(user_feedback(3));
   return(false);
  }

 //--- Get a differenced value at a specific index
   double            RSI::GetDifferencedReadingAt(int index)
     {
      //--- Make sure we're not trying to call values beyond our index
      if(index > rsi_differenced_buffer_size)
        {
         Print(user_feedback(4));
         return(-1e10);
        }

      //--- Make sure our values have been set
      if(!indicator_differenced_values_initialized)
        {

         //--- The user is trying to use values before they were set in memory
         Print(user_feedback(1));
         return(-1e10);
        }

      //--- Return the differenced value of our indicator at a specific index
      if((indicator_differenced_values_initialized) && (index < rsi_differenced_buffer_size))
         return(rsi_differenced_values[index]);

      //--- Something went wrong.
      return(-1e10);
     }

//+------------------------------------------------------------------+
//| Get a reading at a specific index from our RSI buffer            |
//+------------------------------------------------------------------+
double            RSI::GetReadingAt(int index)
  {
//--- Is the user trying to call indexes beyond the buffer?
   if(index > rsi_buffer_size)
     {
      Print(user_feedback(4));
      return(-1e10);
     }

//--- Get the reading at the specified index
   if((indicator_values_initialized) && (index < rsi_buffer_size))
      return(rsi_reading[index]);

//--- User is trying to get values that were not set prior
   else
     {
      Print(user_feedback(1));
      return(-1e10);
     }
  }

//+------------------------------------------------------------------+
//| Check if our indicator handler is valid                          |
//+------------------------------------------------------------------+
bool RSI::IsValid(void)
  {
   return((this.rsi_handler != INVALID_HANDLE));
  }

//+------------------------------------------------------------------+
//| Give the user feedback on the actions he is performing           |
//+------------------------------------------------------------------+
string RSI::user_feedback(int flag)
  {
   string message;

//--- Check if the RSI indicator loaded correctly
   if(flag == 0)
     {
      //--- Check the indicator was loaded correctly
      if(IsValid())
         message = "RSI Indicator Class Loaded Correcrtly \nSymbol: " + (string) rsi_symbol + "\nPeriod: " + (string) rsi_period;
      return(message);
      //--- Something went wrong
      message = "Error loading RSI Indicator: [ERROR] " + (string) GetLastError();
      return(message);
     }

//--- User tried getting indicator values before setting them
   if(flag == 1)
     {
      message = "Please set the indicator values before trying to fetch them from memory, call SetIndicatorValues()";
      return(message);
     }

//--- We sueccessfully set our differenced indicator values
   if(flag == 2)
     {
      message = "Succesfully set differenced indicator values.";
      return(message);
     }

//--- Failed  to set our differenced indicator values
   if(flag == 3)
     {
      message = "Failed to set our differenced indicator values: [ERROR] " + (string) GetLastError();
      return(message);
     }

//--- The user is trying to retrieve an index beyond the buffer size and must update the buffer size first
   if(flag == 4)
     {
      message = "The user is attempting to use call an index beyond the buffer size, update the buffer size first";
      return(message);
     }

//--- The class has been deactivated by the user
   if(flag == 5)
     {
      message = "Goodbye.";
      return(message);
     }

//--- No feedback
   else
      return("");
  }
//+------------------------------------------------------------------+
现在,让我们使用 RSI 类的实例集合来获取我们所需的市场数据。我们将把指向每个类实例的指针存储在我们定义的自定义类型数组中。MQL5 允许我们在需要时即时自动生成对象。然而,这种灵活性的代价是,我们必须始终自行清理,以防止与内存泄漏相关的问题。
//+------------------------------------------------------------------+
//|                                                      ProjectName |
//|                                      Copyright 2020, CompanyName |
//|                                       http://www.companyname.net |
//+------------------------------------------------------------------+
#property copyright "Copyright 2024, MetaQuotes Ltd."
#property link      "https://www.mql5.com"
#property version   "1.00"
#property script_show_inputs

//+------------------------------------------------------------------+
//| System constants                                                 |
//+------------------------------------------------------------------+
#define HORIZON 10

//+------------------------------------------------------------------+
//| Libraries                                                        |
//+------------------------------------------------------------------+
#include <VolatilityDoctor\Indicators\RSI.mqh>

//+------------------------------------------------------------------+
//| Global variables                                                 |
//+------------------------------------------------------------------+
RSI *my_rsi_array[14];
string file_name = Symbol() + " RSI Algorithmic Input Selection.csv";

//+------------------------------------------------------------------+
//| Inputs                                                           |
//+------------------------------------------------------------------+
input int size = 3000;

//+------------------------------------------------------------------+
//| Our script execution                                             |
//+------------------------------------------------------------------+
void OnStart()
  {
//--- How much data should we store in our indicator buffer?
   int fetch = size + (2 * HORIZON);

//--- Store pointers to our RSI objects
   for(int i = 0; i <= 13; i++)
     {
      //--- Create an RSI object
      my_rsi_array[i] = new RSI(Symbol(),PERIOD_CURRENT,((i+1) * 5),PRICE_CLOSE);
      //--- Set the RSI buffers
      my_rsi_array[i].SetIndicatorValues(fetch,true);
      my_rsi_array[i].SetDifferencedIndicatorValues(fetch,HORIZON,true);
     }

//---Write to file
   int file_handle=FileOpen(file_name,FILE_WRITE|FILE_ANSI|FILE_CSV,",");

   for(int i=size;i>=1;i--)
     {
      if(i == size)
        {
         FileWrite(file_handle,"Time","True Close","Open","High","Low","Close","RSI 5","RSI 10","RSI 15","RSI 20","RSI 25","RSI 30","RSI 35","RSI 40","RSI 45","RSI 50","RSI 55","RSI 60","RSI 65","RSI 70","Diff RSI 5","Diff RSI 10","Diff RSI 15","Diff RSI 20","Diff RSI 25","Diff RSI 30","Diff RSI 35","Diff RSI 40","Diff RSI 45","Diff RSI 50","Diff RSI 55","Diff RSI 60","Diff RSI 65","Diff RSI 70");
        }

      else
        {
         FileWrite(file_handle,
                   iTime(_Symbol,PERIOD_CURRENT,i),
                   iClose(_Symbol,PERIOD_CURRENT,i),
                   iOpen(_Symbol,PERIOD_CURRENT,i) - iOpen(Symbol(),PERIOD_CURRENT,i + HORIZON),
                   iHigh(_Symbol,PERIOD_CURRENT,i) - iHigh(Symbol(),PERIOD_CURRENT,i + HORIZON),
                   iLow(_Symbol,PERIOD_CURRENT,i) - iLow(Symbol(),PERIOD_CURRENT,i + HORIZON),
                   iClose(_Symbol,PERIOD_CURRENT,i) - iClose(Symbol(),PERIOD_CURRENT,i + HORIZON),
                   my_rsi_array[0].GetReadingAt(i),
                   my_rsi_array[1].GetReadingAt(i),
                   my_rsi_array[2].GetReadingAt(i),
                   my_rsi_array[3].GetReadingAt(i),
                   my_rsi_array[4].GetReadingAt(i),
                   my_rsi_array[5].GetReadingAt(i),
                   my_rsi_array[6].GetReadingAt(i),
                   my_rsi_array[7].GetReadingAt(i),
                   my_rsi_array[8].GetReadingAt(i),
                   my_rsi_array[9].GetReadingAt(i),
                   my_rsi_array[10].GetReadingAt(i),
                   my_rsi_array[11].GetReadingAt(i),
                   my_rsi_array[12].GetReadingAt(i),
                   my_rsi_array[13].GetReadingAt(i),
                   my_rsi_array[0].GetDifferencedReadingAt(i),
                   my_rsi_array[1].GetDifferencedReadingAt(i),
                   my_rsi_array[2].GetDifferencedReadingAt(i),
                   my_rsi_array[3].GetDifferencedReadingAt(i),
                   my_rsi_array[4].GetDifferencedReadingAt(i),
                   my_rsi_array[5].GetDifferencedReadingAt(i),
                   my_rsi_array[6].GetDifferencedReadingAt(i),
                   my_rsi_array[7].GetDifferencedReadingAt(i),
                   my_rsi_array[8].GetDifferencedReadingAt(i),
                   my_rsi_array[9].GetDifferencedReadingAt(i),
                   my_rsi_array[10].GetDifferencedReadingAt(i),
                   my_rsi_array[11].GetDifferencedReadingAt(i),
                   my_rsi_array[12].GetDifferencedReadingAt(i),
                   my_rsi_array[13].GetDifferencedReadingAt(i)
                  );
        }
     }
//--- Close the file
   FileClose(file_handle);

//--- Delete our RSI object pointers
   for(int i = 0; i <= 13; i++)
     {
      delete my_rsi_array[i];
     }
  }
//+------------------------------------------------------------------+
#undef HORIZON
在 Python 中分析数据
我们现在可以开始分析从 MetaTrader 5 终端收集的数据了。第一步将是加载所需的标准库。
import pandas as pd
import numpy as np
import seaborn as sns
import matplotlib.pyplot as plt
import plotly
现在,读取市场数据。另外,让我们创建一个标志,用于表示当前价格水平是高于还是低于 10 天前报出的价格。回想一下,10 天正是我们在脚本中用于计算 RSI 水平变化的周期。
#Let's read in our market data
data = pd.read_csv("EURUSD RSI Algorithmic Input Selection.csv")
data['Bull'] = np.NaN

data.loc[data['True Close'] > data['True Close'].shift(10),'Bull'] = 1
data.loc[data['True Close'] < data['True Close'].shift(10),'Bull'] = 0

data.dropna(inplace=True)
data.reset_index(inplace=True,drop=True)
我们还需要计算市场真实返回值。
#Estimate the market returns
#Define our forecast horizon
HORIZON = 10
data['Target'] = 0

data['Return'] = data['True Close'].shift(-HORIZON) - data['True Close']
data.loc[data['Return'] > 0,'Target'] = 1

#Drop missing values
data.dropna(inplace=True)
最重要的是,我们需要删除所有与我们预期的回测期重叠的数据。
#No cheating boys.
_ = data.iloc[((-365 * 3) + 95):,:]
data = data.iloc[:((-365 * 3) + 95),:]
data
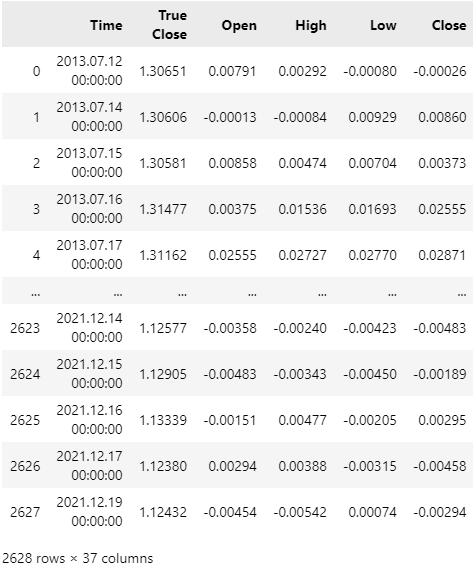
图 4:我们的数据集不再包含任何与我们回测期重叠的日期。
我们可以将 EURUSD 10 天市场回报的分布进行可视化,并且可以快速看到市场回报固定在 0 附近。这种普遍的分布形状并不令人意外,也并非 EURUSD 货币对所独有。
plt.title('Distribution of EURUSD 10 Day Returns')
plt.grid()
sns.histplot(data['Return'],color='black') 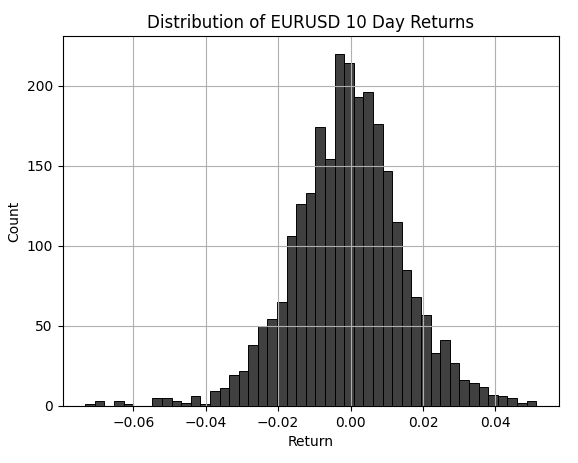
图 5:EURUSD 10 天回报分布的可视化。
这个练习为我们提供了一个独特的机会,可以直观地看到短周期 RSI 水平的分布与长周期 RSI 水平分布之间的差异。红色垂直虚线标记了标准化的 30 和 70 水平。黑色条形代表当 RSI 周期设置为 5 时 RSI 水平的分布。我们可以看到,5 周期的 RSI 将会产生许多超出标准化水平的信号。然而,白色条形代表当 RSI 周期设置为 70 时 RSI 水平的分布。我们可以直观地看到,几乎根本不会产生任何信号。正是这种分布形状的变化,使得量化交易者很难始终遵循使用指标的“最佳实践”。
plt.title('Comapring The Distribution of RSI Changes Across Different RSI Periods')
sns.histplot(data['RSI 5'],color='black')
sns.histplot(data['RSI 70'],color='white')
plt.xlabel('RSI Level')
plt.legend(['RSI 5','RSI 70'])
plt.axvline(30,color='red',linestyle='--')
plt.axvline(70,color='red',linestyle='--')
plt.grid() 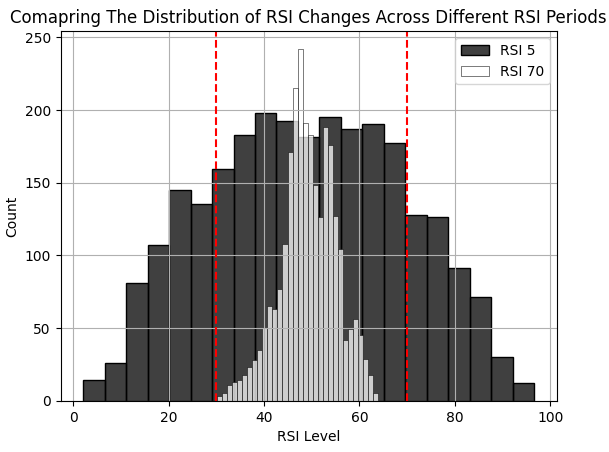
图 6:比较不同 RSI 周期下 RSI 水平的分布。
创建一个散点图,x 轴和 y 轴均为 60 周期 RSI 的 10 周期变化,这让我们可以直观地看到指标的变化与目标(市场回报)之间是否存在关系。看起来,RSI 读数变化 10 个水平,可能是一个合理的交易信号:如果 RSI 读数下跌了 10 个水平,则可能考虑做空;如果 RSI 水平上升了 10 个,则考虑做多。
plt.title('Scatter Plot of 10 Day Change in 50 Period RSI & EURUSD 10 Day Return')
sns.scatterplot(data,y='Diff RSI 60',x='Diff RSI 60',hue='Target')
plt.xlabel('50 Period RSI')
plt.ylabel('50 Period RSI')
plt.grid()
plt.axvline(-10,color='red',linestyle='--')
plt.axvline(10,color='red',linestyle='--') 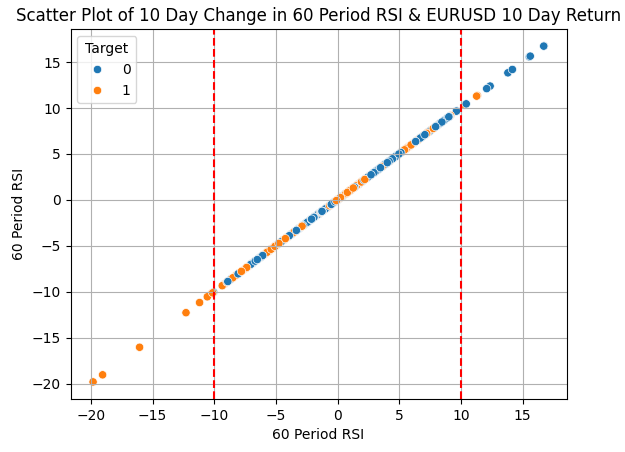
图 7:60 周期 RSI 的变化与目标之间关系的可视化。
尝试将不同周期 RSI 变化所产生的信号结合起来,听起来似乎是个合理的想法。然而,这似乎在更好地分离我们感兴趣的两个类别方面作用甚微。
plt.title('Scatter Plot of 10 Day Change in 5 Period RSI & EURUSD 10 Day Return')
sns.scatterplot(data,y='Diff RSI 60',x='Diff RSI 5',hue='Target')
plt.xlabel('5 Period RSI')
plt.ylabel('5 Period RSI')
plt.grid()
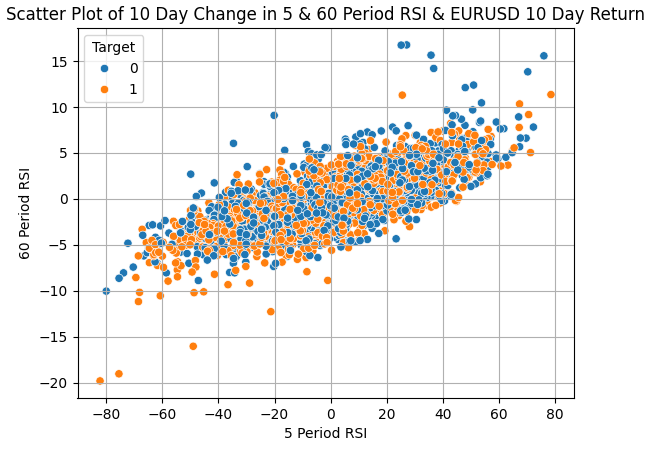
图 8:看起来,简单地使用不同周期的 RSI 指标作为确认来源,效果不佳。
我们有 14 个不同的 RSI 指标可供选择。与其运行 14 次回测来决定哪个周期可能对我们最有利,我们可以通过评估一个模型的性能来估算最优周期,该模型使用所有 14 个 RSI 指标作为输入进行训练,然后评估该统计模型从其训练数据中学到的特征重要性。
请注意,我们总是可以选择使用统计模型来获得预测准确性,或者用于解释和洞察。今天我们进行的是后者。我们将使用所有 14 个 RSI 指标输入的差值来拟合一个 Ridge(岭回归)模型。Ridge 模型本身也有需要调整的参数。因此,我们将对 Ridge 统计模型的输入空间执行网格搜索。具体来说,我们将调整以下调优参数:
- Alpha(正则化强度): Ridge 模型需要添加一个惩罚项来控制模型的系数。
- Tolerance(容差): 决定了设置停止条件所需的最小变化量,或根据用户选择的求解器为子程序设定其他条件。
在我们的讨论中,我们将使用带有 ‘sparse_cg’ 求解器的 ridge 模型。如果读者愿意,也可以考虑自行调整该模型。
Ridge 模型对我们特别有帮助,因为它会将其系数收缩至 0 以减少模型的损失。因此,我们将为模型搜索一个广阔的初始设置空间,然后专注于带来最低误差的初始设置。模型在其最佳性能模式下的权重配置,可以快速告知我们的模型最依赖于哪个 RSI 周期。在我们今天的特定示例中,正是 55 周期 RSI 的 10 周期变化,从我们表现最佳的模型中获得了最大的系数。
#Set the max levels we wish to check
ALPHA_LEVELS = 10
TOL_LEVELS   = 10

#DataFrame labels
r_c = 'TOL_LEVEL_'
r_r = 'ALHPA_LEVEL_'

results_columns = []
results_rows = []

for c in range(TOL_LEVELS):
    n_c = r_c + str(c)
    n_r = r_r + str(c)
    results_columns.append(n_c)
    results_rows.append(n_r)

#Create a DataFrame to store our results
results = pd.DataFrame(columns=results_columns,index=results_rows)

#Cross validate our model
for i in range(TOL_LEVELS):
    tol = 10 ** (-i)
    error = []
    for j in range(ALPHA_LEVELS):
        #Set alpha
        alpha = 10 ** (-j)

        #Its good practice to generally check the 0 case
        if(i == 0 & j == 0):
            model = Ridge(alpha=j,tol=i,solver='sparse_cg')

        #Otherwise use a float
        model = Ridge(alpha=alpha,tol=tol,solver='sparse_cg')

        #Store the error levels
        error.append(np.mean(np.abs(cross_val_score(model,data.loc[:,['Diff RSI 5',
       'Diff RSI 10', 'Diff RSI 15', 'Diff RSI 20', 'Diff RSI 25',
       'Diff RSI 30', 'Diff RSI 35', 'Diff RSI 40', 'Diff RSI 45',
       'Diff RSI 50', 'Diff RSI 55', 'Diff RSI 60', 'Diff RSI 65',
       'Diff RSI 70',]],data['Return'],cv=tscv))))

    #Record the error levels
    results.iloc[:,i] = error

results
下表总结了我们的结果。我们观察到,当我们将模型的初始参数都设置为 0 时,获得了最低的误差率。
| 调优参数 | 模型误差 |
|---|---|
| ALHPA_LEVEL_0 | 0.053509 |
| ALHPA_LEVEL_1 | 0.056245 |
| ALHPA_LEVEL_2 | 0.060158 |
| ALHPA_LEVEL_3 | 0.062230 |
| ALHPA_LEVEL_4 | 0.061521 |
| ALHPA_LEVEL_5 | 0.064312 |
| ALHPA_LEVEL_6 | 0.073248 |
| ALHPA_LEVEL_7 | 0.079310 |
| ALHPA_LEVEL_8 | 0.081914 |
| ALHPA_LEVEL_9 | 0.085171 |
也可以使用等高线图将我们的发现用图形绘制出来。我们希望使用图中与低误差(蓝色区域)相关联的模型。这些是我们迄今为止表现最佳的模型。现在让我们可视化模型中每个系数的大小。最大的系数将被分配给我们模型最依赖的输入。
import plotly.graph_objects as go

fig = go.Figure(data =
    go.Contour(
        z=results,
        colorscale='bluered'
    ))

fig.update_layout(
    width = 600,
    height = 400,
    title='Contour Plot Of Our Error Forecasting EURUSD Using Grid Search '
)

fig.show()
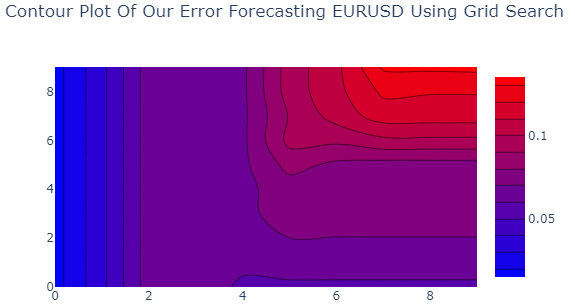
图 9:我们找到了用于预测 10 天 EURUSD 回报的 Ridge 模型的最优输入设置。
通过绘制数据图表,我们可以快速看到与 55 周期 RSI 相关联的系数被赋予了最大的绝对值。这让我们有信心将注意力缩小到那个特定的 RSI 设置上。
#Let's visualize the importance of each column
model = Ridge(alpha=0,tol=0,solver='sparse_cg')

model.fit(data.loc[:,['Diff RSI 5',
       'Diff RSI 10', 'Diff RSI 15', 'Diff RSI 20', 'Diff RSI 25',
       'Diff RSI 30', 'Diff RSI 35', 'Diff RSI 40', 'Diff RSI 45',
       'Diff RSI 50', 'Diff RSI 55', 'Diff RSI 60', 'Diff RSI 65',
       'Diff RSI 70',]],data['Return'])

#Clearly our model relied on the 25 Period RSI the most, from all the data it had available at training
sns.barplot(np.abs(model.coef_),color='black')
plt.title('Rleative Feature Importance')
plt.ylabel('Coefficient Value')
plt.xlabel('Coefficient Index')
plt.grid()
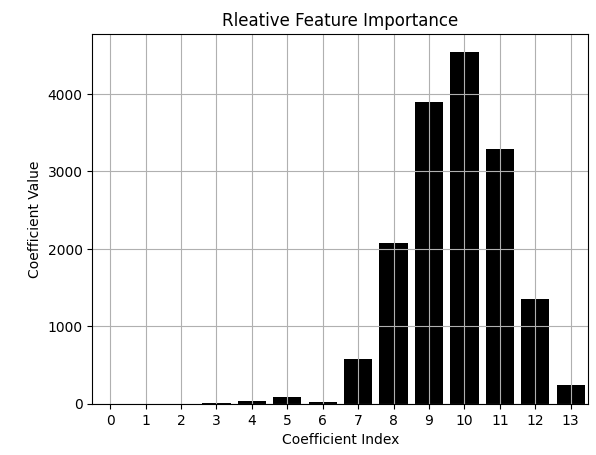
图 10:与 55 周期 RSI 的差值相关联的系数被赋予了最大的值。
既然我们已经确定了感兴趣的周期,那么让我们也评估一下,当我们循环递增 10 个单位的 RSI 水平时,我们模型的误差是如何变化的。我们将在数据框中创建 3 个额外的列。如果 RSI 读数大于我们要检查的第一个值,则第 1 列的值为 1。否则,如果 RSI 读数小于我们希望检查的某个特定值,则第 2 列的值为 1。在任何其他情况下,第 3 列的值为 1。
def objective(x):
    data = pd.read_csv("EURUSD RSI Algorithmic Input Selection.csv")
    data['0'] = 0
    data['1'] = 0
    data['2'] = 0
    HORIZON = 10
    data['Return'] = data['True Close'].shift(-HORIZON) - data['True Close']
    data.dropna(subset=['Return'],inplace=True)
    data.iloc[data['Diff RSI 55'] > x[0],12] = 1
    data.iloc[data['Diff RSI 55'] < x[1],13] = 1
    data.iloc[(data['Diff RSI 55'] < x[0]) & (data['RSI 55'] > x[1]),14] = 1
    #Calculate or RMSE When using those levels
    model = Ridge(alpha=0,tol=0,solver='sparse_cg')
    error = np.mean(np.abs(cross_val_score(model,data.iloc[:,12:15],data['Return'],cv=tscv)))
    return(error)
让我们评估一下,如果我们将 0 设置为我们的临界水平,我们的模型会产生什么误差。
#Bad rules for using the RSI
objective([0,0])
0.026897725573317266
如果我们将 70 和 30 水平输入到我们的函数中,我们的误差会增加。我们将以 10 为步长执行网格搜索,以找到更适合 55 周期 RSI 的 RSI 变化水平。我们的结果发现,最优的变化水平似乎接近 10 个 RSI 水平。
#Bad rules for using the RSI
objective([70,30])
0.031258730612736006
LEVELS  = 10
results = []

for i in np.arange(0,(LEVELS)):
    results.append(objective([i * 10,-(i * 10)]))

plt.plot(results,color='black')
plt.ylabel('Error Rate')
plt.xlabel('Change in RSI as multiples of 10')
plt.grid()
plt.scatter(results.index(min(results)),min(results),color='red')
plt.title('Measuring The Strength of Changes In RSI Levels')
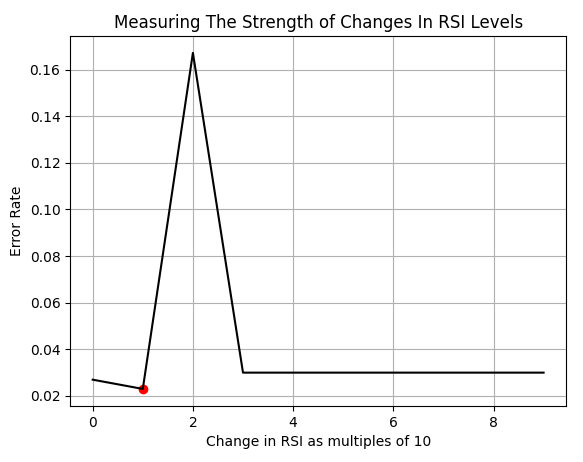
图 11:可视化我们 RSI 指标中的最优变化水平。
现在让我们在 RSI 变化的 0 到 20 范围内进行一次更精细的搜索。仔细观察后,我们发现真正的最优值似乎出现在 9。然而,我们进行此类练习并非是为了完美地拟合历史数据,那被称为过拟合,并不是一件好事。我们的目标不是进行曲线拟合的练习。我们不是要精确地采用在历史数据分析中出现最优值的位置,而是接受最优值的位置可能会改变这一事实,我们的目标是位于最优值两侧一定分数的标准差范围内,以此作为我们的置信区间。
LEVELS  = 20
coef = 0.5
results = []

for i in np.arange(0,(LEVELS),1):
    results.append(objective([i,-(i)]))

plt.plot(results)
plt.ylabel('Error Rate')
plt.xlabel('Change in RSI')
plt.grid()
plt.scatter(results.index(min(results)),min(results),color='red')
plt.title('Measuring The Strength of Changes In RSI Levels')


plt.axvline(results.index(min(results)),color='red')
plt.axvline(results.index(min(results)) - (coef * np.std(data['Diff RSI 55'])),linestyle='--',color='red')
plt.axvline(results.index(min(results)) + (coef * np.std(data['Diff RSI 55'])),linestyle='--',color='red')
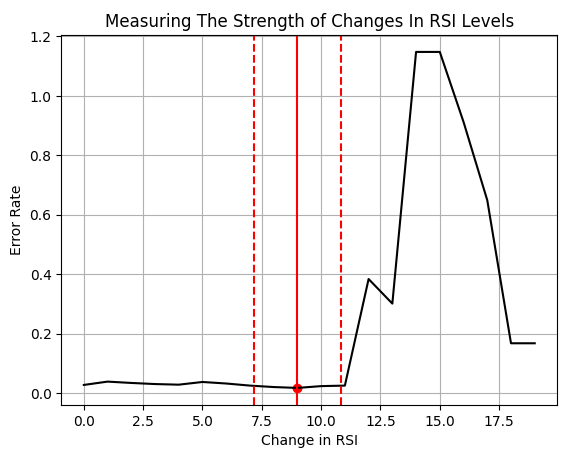
图 12:可视化与为 RSI 水平变化设置不同阈值相关联的误差率。
我们可以直观地看到,我们认为可能是最优的区域,叠加在了 RSI 变化的历史分布之上。
sns.histplot(data['Diff RSI 55'],color='black')
coef = 0.5
plt.axvline((results.index(min(results))),linestyle='--',color='red')
plt.axvline(results.index(min(results)) - (coef * np.std(data['Diff RSI 55'])),color='red')
plt.axvline(results.index(min(results)) + (coef * np.std(data['Diff RSI 55'])),color='red')
plt.axvline(-(results.index(min(results))),linestyle='--',color='red')
plt.axvline(-(results.index(min(results)) - (coef * np.std(data['Diff RSI 55']))),color='red')
plt.axvline(-(results.index(min(results)) + (coef * np.std(data['Diff RSI 55']))),color='red')
plt.title("Visualizing our Optimal Point in The Distribution")
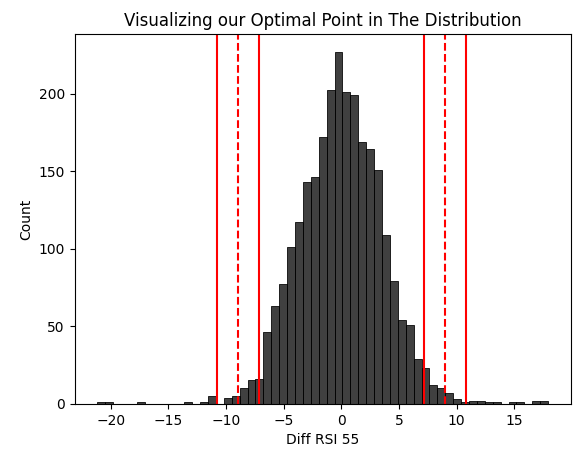
图 13:可视化我们为 RSI 交易信号选择的最优区域。
让我们获取估算的置信区间的值,这些将作为我们EA中触发多头和空头信号的临界值。
results.index(min(results)) + ( coef * np.std(data['Diff RSI 55']))
10.822857254027287
以及我们的下限。
results.index(min(results)) - (coef * np.std(data['Diff RSI 55']))
7.177142745972713
让我们从 Ridge 模型中获取一个解释,以用一种我们可能未曾直观想到的方式来解释 RSI 指标。
def explanation(x):
    data = pd.read_csv("EURUSD RSI Algorithmic Input Selection.csv")
    data['0'] = 0
    data['1'] = 0
    data['2'] = 0
    HORIZON = 10
    data['Return'] = data['True Close'].shift(-HORIZON) - data['True Close']
    data.dropna(subset=['Return'],inplace=True)
    data.iloc[data['Diff RSI 55'] > x[0],12] = 1
    data.iloc[data['Diff RSI 55'] < x[1],13] = 1
    data.iloc[(data['Diff RSI 55'] < x[0]) & (data['RSI 55'] > x[1]),14] = 1
    #Calculate or RMSE When using those levels
    model = Ridge(alpha=0,tol=0,solver='sparse_cg')
    model.fit(data.iloc[:,12:15],data['Return'])
    return(model.coef_.copy())
可以看到,当 RSI 指标变化超过 9(我们的最优值)时,我们的模型学习到了正系数,这意味着应该开立多头仓位。否则,模型断言我们在任何其他条件下都应该卖出。
opt = 9

print(explanation([opt,-opt]))
[ 1.97234840e-04 -1.64215118e-04 -7.55222156e-05]
构建我们的EA
假设我们对过去的了解是对未来的一个良好模型,我们能否构建一个应用程序,利用我们目前学到的关于市场的知识来有利可图地交易 EURUSD?首先,我们将定义重要的系统常量,这些常量将在整个程序以及我们可能构建的任何其他版本中被需要。
//+------------------------------------------------------------------+
//|                                  Algorithmic Input Selection.mq5 |
//|                                               Gamuchirai Ndawana |
//|                    https://www.mql5.com/en/users/gamuchiraindawa |
//+------------------------------------------------------------------+
#property copyright "Gamuchirai Ndawana"
#property link      "https://www.mql5.com/en/users/gamuchiraindawa"
#property version   "1.00"

//+------------------------------------------------------------------+
//| System constants                                                 |
//+------------------------------------------------------------------+
#define RSI_PERIOD 55
#define RSI_TIME_FRAME PERIOD_D1
#define SYSTEM_TIME_FRAME PERIOD_D1
#define RSI_PRICE  PRICE_CLOSE
#define RSI_BUFFER_SIZE 20
#define TRADING_VOLUME SymbolInfoDouble(Symbol(),SYMBOL_VOLUME_MIN)
加载我们的类库。
//+------------------------------------------------------------------+
//| Load our RSI library                                             |
//+------------------------------------------------------------------+
#include <VolatilityDoctor\Indicators\RSI.mqh>
#include <Trade\Trade.mqh>
我们还需要一些全局变量。
//+------------------------------------------------------------------+
//| Global variables                                                 |
//+------------------------------------------------------------------+
CTrade Trade;
RSI    rsi_55(Symbol(),RSI_TIME_FRAME,RSI_PERIOD,RSI_PRICE);
double last_value;
int    count;
int    ma_o_handler,ma_c_handler;
double ma_o[],ma_c[];
double trade_sl;
事件处理程序将调用他们各自的子函数来完成相应的任务。
//+------------------------------------------------------------------+
//| Expert initialization function                                   |
//+------------------------------------------------------------------+
int OnInit()
  {
//---
   setup();
//---
   return(INIT_SUCCEEDED);
  }
//+------------------------------------------------------------------+
//| Expert deinitialization function                                 |
//+------------------------------------------------------------------+
void OnDeinit(const int reason)
  {
//---
   IndicatorRelease(ma_c_handler);
   IndicatorRelease(ma_o_handler);
  }
//+------------------------------------------------------------------+
//| Expert tick function                                             |
//+------------------------------------------------------------------+
void OnTick()
  {
//---
   update();
  }
//+------------------------------------------------------------------+
更新函数会更新我们所有的系统变量,并检查我们是需要开仓,还是管理我们现有的持仓。
//+------------------------------------------------------------------+
//| Update our system variables                                      |
//+------------------------------------------------------------------+
void update(void)
  {
   static datetime time_stamp;
   datetime current_time = iTime(Symbol(),SYSTEM_TIME_FRAME,0);

   if(time_stamp != current_time)
     {
      time_stamp = current_time;
      CopyBuffer(ma_c_handler,0,0,1,ma_c);
      CopyBuffer(ma_o_handler,0,0,1,ma_o);

      if((count == 0) && (PositionsTotal() == 0))
        {
         rsi_55.SetIndicatorValues(RSI_BUFFER_SIZE,true);
         last_value = rsi_55.GetReadingAt(RSI_BUFFER_SIZE - 1);
         count = 1;
        }

      if(PositionsTotal() == 0)
         check_signal();

      if(PositionsTotal() > 0)
         manage_setup();
     }
  }
我们的持仓需要不断调整其止损,以确保尽可能降低风险水平。
//+------------------------------------------------------------------+
//| Manage our open trades                                           |
//+------------------------------------------------------------------+
void manage_setup(void)
  {
   double bid = SymbolInfoDouble(Symbol(),SYMBOL_BID);
   double ask = SymbolInfoDouble(Symbol(),SYMBOL_ASK);

   if(PositionSelect(Symbol()))
     {
      double current_sl = PositionGetDouble(POSITION_SL);
      double current_tp = PositionGetDouble(POSITION_TP);
      double new_sl = (current_tp > current_sl) ? (bid-trade_sl) : (ask+trade_sl);
      double new_tp = (current_tp < current_sl) ? (bid+trade_sl) : (ask-trade_sl);
      //--- Buy setup
      if((current_tp > current_sl) && (new_sl < current_sl))
         Trade.PositionModify(Symbol(),new_sl,new_tp);

      //--- Sell setup
      if((current_tp < current_sl) && (new_sl > current_sl))
         Trade.PositionModify(Symbol(),new_sl,new_tp);
     }
  }
设置函数负责让我们的系统从零开始启动。它将准备我们需要的指标,并重置计数器。
//+------------------------------------------------------------------+
//| Setup our global variables                                       |
//+------------------------------------------------------------------+
void setup(void)
  {
   ma_c_handler = iMA(Symbol(),SYSTEM_TIME_FRAME,2,0,MODE_EMA,PRICE_CLOSE);
   ma_o_handler = iMA(Symbol(),SYSTEM_TIME_FRAME,2,0,MODE_EMA,PRICE_OPEN);
   count        = 0;
   last_value   = 0;
   trade_sl     = 1.5e-2;
  }
最后,我们的交易规则是借助模型从训练数据中学到的系数值生成的。这是我们在取消定义程序开始时创建的系统变量之前,要定义的最后一个函数。
//+------------------------------------------------------------------+
//| Check if we have a trading setup                                 |
//+------------------------------------------------------------------+
void check_signal(void)
  {
   double current_reading = rsi_55.GetCurrentReading();
   Comment("Last Reading: ",last_value,"\nDifference in Reading: ",(last_value - current_reading));
   double bid = SymbolInfoDouble(Symbol(),SYMBOL_BID);
   double ask = SymbolInfoDouble(Symbol(),SYMBOL_ASK);
   double cp_lb = 7.17;
   double cp_ub = 10.82;

   if((((last_value - current_reading) <= -(cp_lb)) && ((last_value - current_reading) > (cp_ub)))|| ((((last_value - current_reading) > -(cp_lb))) && ((last_value - current_reading) < (cp_lb))))
     {
      if(ma_o[0] > ma_c[0])
        {
         if(PositionsTotal() == 0)
           {
            Trade.Sell(TRADING_VOLUME,Symbol(),bid,(ask+trade_sl),(ask-trade_sl));
            count = 0;
           }
        }
     }

   if(((last_value - current_reading) >= (cp_lb)) < ((last_value - current_reading) < cp_ub))
     {
      if(ma_c[0] < ma_o[0])
        {
         if(PositionsTotal() == 0)
           {
            Trade.Buy(TRADING_VOLUME,Symbol(),ask,(bid-trade_sl),(bid+trade_sl));
            count = 0;
           }
        }
     }
  }
//+------------------------------------------------------------------+

#undef RSI_BUFFER_SIZE
#undef RSI_PERIOD
#undef RSI_PRICE
#undef RSI_TIME_FRAME
#undef SYSTEM_TIME_FRAME
#undef TRADING_VOLUME
//+------------------------------------------------------------------+
现在让我们开始对交易系统进行回测。回想一下,在图 4 中,我们删除了所有与回测重叠的数据。因此,这可以作为一个近似值,来估算我们的策略在实时交易中的表现。我们将在日线数据上对策略进行为期 3 年的回测,时间从 2022 年 1 月 1 日到 2025 年 3 月。

图 14:我们将用于交易策略回测的日期。
为了获得最佳结果,我们始终使用“基于真实 Tick 的每个 Tick”,因为它能根据 MetaTrader 5 终端代表您从您的经纪商那里收集的历史 Tick,渲染出对过去市场条件最准确的模拟。
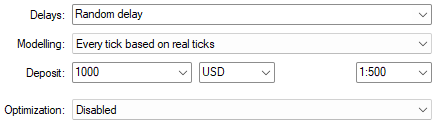
图 15:进行测试的条件非常重要,并且会改变我们策略的盈利能力。
策略测试器产生的资金曲线看起来很有希望。但是,让我们一起来解读详细的统计数据,以获得策略性能的完整视图。
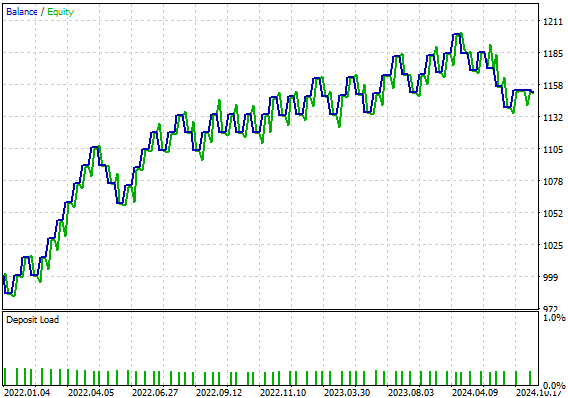
图 16:EURUSD 55 周期 RSI 交易策略产生的资金曲线。
运行我们的策略在策略测试器中产生了以下统计数据:
- 夏普比率:0.92
- 预期回报:2.49
- 总净利润:151.87 美元
- 盈利交易占比:57.38%
然而,请注意一个事实:在总共 61 笔交易中,只有 4 笔是多头交易。为什么我们的策略如此不成比例地偏向于卖出?我们如何纠正这种偏差?让我们再看一下我们的 EURUSD 图表,并尝试一起理解这个问题。

图 17:我们的EA在日线 EURUSD 上的历史表现详细统计。
改进我们的EA
在图 18 中,我附上了一张月度 EURUSD 汇率的截图。两条红色垂直线分别标记了 2009 年年初和 2021 年年末。绿色垂直线代表我们用于统计模型的训练数据的开始。人们可以很快地看到,鉴于 2008 年开始的持续熊市趋势,模型为什么会学习到对空头仓位的偏好。
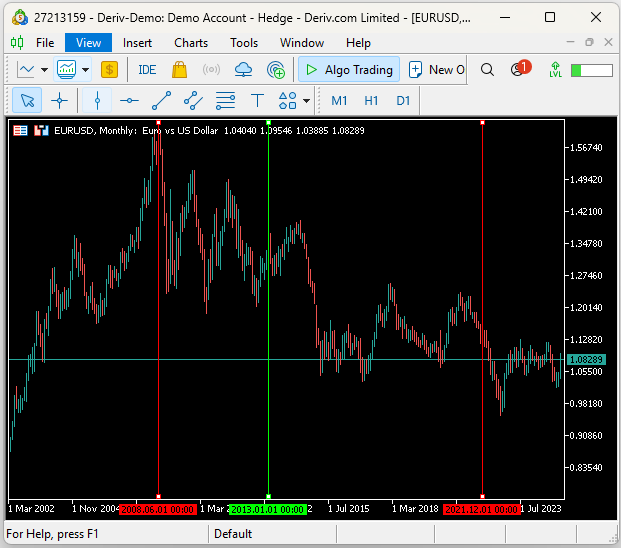
图 18:理解为什么我们的模型学习到了如此看跌的情绪。
我们并不总是需要更多的历史数据来尝试纠正这一点。相反,我们可以拟合一个比开始时使用的 Ridge 模型更灵活的模型。这个更强的学习器,将为我们的策略提供额外的多头信号。
我们可以让EA合理地估计汇率在未来 10 天内上涨的概率。我们可以训练一个随机森林回归器来预测观察到看涨价格行动的概率。当预期概率超过 0.5 时,我们的EA将开立多头仓位。否则,我们将遵循从 Ridge 模型中学到的策略。
在 Python 中对概率进行建模
为了开始我们的修正,首先将导入几个库。
from sklearn.metrics import accuracy_score
from sklearn.ensemble import RandomForestRegressor
然后我们将定义因变量和自变量。
#Independent variable
X = data[['Diff RSI 55']]
#Dependent variable
y = data['Target']
拟合模型。
model = RandomForestRegressor()
model.fit(X,y)
准备导出为 ONNX。
import onnx
from skl2onnx import convert_sklearn
from skl2onnx.common.data_types import FloatTensorType
定义输入形状。
inital_params = [("float_input",FloatTensorType([1,1]))]
创建 ONNX 原型并将其保存到磁盘。
onnx_proto = convert_sklearn(model=model,initial_types=inital_params,target_opset=12)
onnx.save(onnx_proto,"EURUSD Diff RSI 55 D1 1 1.onnx")
也可以使用 netron 库图形化展示您的模型,以确保为 ONNX 模型指定了正确的输入和输出属性。
import netron
netron.start("EURUSD Diff RSI 55 D1 1 1.onnx")
这是我们的随机森林回归器及其模型属性的图形化表示。Netron 也可用于可视化神经网络和许多其他类型的 ONNX 模型。

图 19:可视化我们的 ONNX 随机森林回归器模型。
ONNX 正确指定了输入和输出的形状,因此我们现在可以继续应用随机森林回归器来帮助EA预测未来 10 天内发生看涨价格行动的概率。

图 20:ONNX 模型详情与我们想要校对的预期一致。
改进我们的EA
既然我们已经导出了一个 EURUSD 市场的概率模型,就可以将我们的 ONNX 模型导入到EA中。
//+------------------------------------------------------------------+
//|                                  Algorithmic Input Selection.mq5 |
//|                                               Gamuchirai Ndawana |
//|                    https://www.mql5.com/en/users/gamuchiraindawa |
//+------------------------------------------------------------------+
#property copyright "Gamuchirai Ndawana"
#property link      "https://www.mql5.com/en/users/gamuchiraindawa"
#property version   "1.00"

//+------------------------------------------------------------------+
//| System resources                                                 |
//+------------------------------------------------------------------+
#resource "\\Files\\EURUSD Diff RSI 55 D1 1 1.onnx" as uchar onnx_model_buffer[];
我们还将需要一些新的宏来定义我们的ONNX模型的尺寸。
#define ONNX_INPUTS 1
#define ONNX_OUTPUTS 1
此外,ONNX 模型也需要几个全局变量,因为我们可能在代码的多个部分快速用到它们。
long   onnx_model;
vectorf onnx_output(1);
vectorf onnx_input(1);
在下面的代码片段中,我们省略了代码库中未更改的部分,仅展示了为初始化 ONNX 模型并设置其参数形状所做的更改。
//+------------------------------------------------------------------+
//| Setup our global variables                                       |
//+------------------------------------------------------------------+
bool setup(void)
  {
//--- Setup our technical indicators
  ...

//--- Create our ONNX model
   onnx_model = OnnxCreateFromBuffer(onnx_model_buffer,ONNX_DATA_TYPE_FLOAT);

//--- Validate the ONNX model
   if(onnx_model == INVALID_HANDLE)
     {
      return(false);
     }

//--- Define the I/O signature
   ulong onnx_param[] =  {1,1};

   if(!OnnxSetInputShape(onnx_model,0,onnx_param))
      return(false);

   if(!OnnxSetOutputShape(onnx_model,0,onnx_param))
      return(false);

   return(true);
  }
此外,我们对有效交易的检查部分进行了精简,仅突出显示其中新增的代码,以避免重复相同的代码。
//+------------------------------------------------------------------+
//| Check if we have a trading setup                                 |
//+------------------------------------------------------------------+
void check_signal(void)
  {
   rsi_55.SetDifferencedIndicatorValues(RSI_BUFFER_SIZE,HORIZON,true);
   onnx_input[0] = (float) rsi_55.GetDifferencedReadingAt(RSI_BUFFER_SIZE - 1);

//--- Our Random forest model
   if(!OnnxRun(onnx_model,ONNX_DATA_TYPE_FLOAT,onnx_input,onnx_output))
      Comment("Failed to obtain a forecast from our model!");

   else
     {
      if(onnx_output[0] > 0.5)
         if(ma_o[0] < ma_c[0])
            Trade.Buy(TRADING_VOLUME,Symbol(),ask,(bid-trade_sl),(bid+trade_sl));
      Print("Model Bullish Probabilty: ",onnx_output);
     }
}
总而言之,这就是我们的交易策略第二版在完整组合后的样子。
//+------------------------------------------------------------------+
//|                                  Algorithmic Input Selection.mq5 |
//|                                               Gamuchirai Ndawana |
//|                    https://www.mql5.com/en/users/gamuchiraindawa |
//+------------------------------------------------------------------+
#property copyright "Gamuchirai Ndawana"
#property link      "https://www.mql5.com/en/users/gamuchiraindawa"
#property version   "1.00"

//+------------------------------------------------------------------+
//| System resources                                                 |
//+------------------------------------------------------------------+
#resource "\\Files\\EURUSD Diff RSI 55 D1 1 1.onnx" as uchar onnx_model_buffer[];

//+------------------------------------------------------------------+
//| System constants                                                 |
//+------------------------------------------------------------------+
#define RSI_PERIOD 55
#define RSI_TIME_FRAME PERIOD_D1
#define SYSTEM_TIME_FRAME PERIOD_D1
#define RSI_PRICE  PRICE_CLOSE
#define RSI_BUFFER_SIZE 20
#define TRADING_VOLUME SymbolInfoDouble(Symbol(),SYMBOL_VOLUME_MIN)
#define ONNX_INPUTS 1
#define ONNX_OUTPUTS 1
#define HORIZON 10

//+------------------------------------------------------------------+
//| Load our RSI library                                             |
//+------------------------------------------------------------------+
#include <VolatilityDoctor\Indicators\RSI.mqh>
#include <Trade\Trade.mqh>

//+------------------------------------------------------------------+
//| Global variables                                                 |
//+------------------------------------------------------------------+
CTrade Trade;
RSI    rsi_55(Symbol(),RSI_TIME_FRAME,RSI_PERIOD,RSI_PRICE);
double last_value;
int    count;
int    ma_o_handler,ma_c_handler;
double ma_o[],ma_c[];
double trade_sl;
long   onnx_model;
vectorf onnx_output(1);
vectorf onnx_input(1);

//+------------------------------------------------------------------+
//| Expert initialization function                                   |
//+------------------------------------------------------------------+
int OnInit()
  {
//---
   setup();
//---
   return(INIT_SUCCEEDED);
  }
//+------------------------------------------------------------------+
//| Expert deinitialization function                                 |
//+------------------------------------------------------------------+
void OnDeinit(const int reason)
  {
//---
   IndicatorRelease(ma_c_handler);
   IndicatorRelease(ma_o_handler);
  }
//+------------------------------------------------------------------+
//| Expert tick function                                             |
//+------------------------------------------------------------------+
void OnTick()
  {
//---
   update();
  }
//+------------------------------------------------------------------+

//+------------------------------------------------------------------+
//| Update our system variables                                      |
//+------------------------------------------------------------------+
void update(void)
  {
   static datetime time_stamp;
   datetime current_time = iTime(Symbol(),SYSTEM_TIME_FRAME,0);

   if(time_stamp != current_time)
     {
      time_stamp = current_time;
      CopyBuffer(ma_c_handler,0,0,1,ma_c);
      CopyBuffer(ma_o_handler,0,0,1,ma_o);

      if((count == 0) && (PositionsTotal() == 0))
        {
         rsi_55.SetIndicatorValues(RSI_BUFFER_SIZE,true);
         rsi_55.SetDifferencedIndicatorValues(RSI_BUFFER_SIZE,HORIZON,true);
         last_value = rsi_55.GetReadingAt(RSI_BUFFER_SIZE - 1);
         count = 1;
        }

      if(PositionsTotal() == 0)
         check_signal();

      if(PositionsTotal() > 0)
         manage_setup();
     }
  }

//+------------------------------------------------------------------+
//| Manage our open trades                                           |
//+------------------------------------------------------------------+
void manage_setup(void)
  {
   double bid = SymbolInfoDouble(Symbol(),SYMBOL_BID);
   double ask = SymbolInfoDouble(Symbol(),SYMBOL_ASK);

   if(PositionSelect(Symbol()))
     {
      double current_sl = PositionGetDouble(POSITION_SL);
      double current_tp = PositionGetDouble(POSITION_TP);
      double new_sl = (current_tp > current_sl) ? (bid-trade_sl) : (ask+trade_sl);
      double new_tp = (current_tp < current_sl) ? (bid+trade_sl) : (ask-trade_sl);
      //--- Buy setup
      if((current_tp > current_sl) && (new_sl < current_sl))
         Trade.PositionModify(Symbol(),new_sl,new_tp);

      //--- Sell setup
      if((current_tp < current_sl) && (new_sl > current_sl))
         Trade.PositionModify(Symbol(),new_sl,new_tp);
     }
  }

//+------------------------------------------------------------------+
//| Setup our global variables                                       |
//+------------------------------------------------------------------+
bool setup(void)
  {
//--- Setup our technical indicators
   ma_c_handler = iMA(Symbol(),SYSTEM_TIME_FRAME,2,0,MODE_EMA,PRICE_CLOSE);
   ma_o_handler = iMA(Symbol(),SYSTEM_TIME_FRAME,2,0,MODE_EMA,PRICE_OPEN);
   count        = 0;
   last_value   = 0;
   trade_sl     = 1.5e-2;

//--- Create our ONNX model
   onnx_model = OnnxCreateFromBuffer(onnx_model_buffer,ONNX_DATA_TYPE_FLOAT);

//--- Validate the ONNX model
   if(onnx_model == INVALID_HANDLE)
     {
      return(false);
     }

//--- Define the I/O signature
   ulong onnx_param[] =  {1,1};

   if(!OnnxSetInputShape(onnx_model,0,onnx_param))
      return(false);

   if(!OnnxSetOutputShape(onnx_model,0,onnx_param))
      return(false);

   return(true);
  }

//+------------------------------------------------------------------+
//| Check if we have a trading setup                                 |
//+------------------------------------------------------------------+
void check_signal(void)
  {
   rsi_55.SetDifferencedIndicatorValues(RSI_BUFFER_SIZE,HORIZON,true);
   last_value = rsi_55.GetReadingAt(RSI_BUFFER_SIZE - 1);

   double current_reading = rsi_55.GetCurrentReading();
   Comment("Last Reading: ",last_value,"\nDifference in Reading: ",(last_value - current_reading));
   double bid = SymbolInfoDouble(Symbol(),SYMBOL_BID);
   double ask = SymbolInfoDouble(Symbol(),SYMBOL_ASK);
   double cp_lb = 7.17;
   double cp_ub = 10.82;
   onnx_input[0] = (float) rsi_55.GetDifferencedReadingAt(RSI_BUFFER_SIZE - 1);

//--- Our Random forest model
   if(!OnnxRun(onnx_model,ONNX_DATA_TYPE_FLOAT,onnx_input,onnx_output))
      Comment("Failed to obtain a forecast from our model!");

   else
     {
      if(onnx_output[0] > 0.5)
         if(ma_o[0] < ma_c[0])
            Trade.Buy(TRADING_VOLUME,Symbol(),ask,(bid-trade_sl),(bid+trade_sl));
      Print("Model Bullish Probabilty: ",onnx_output);
     }

//--- The trading rules we learned from our Ridge Regression Model
//--- Ridge Regression Sell
   if((((last_value - current_reading) <= -(cp_lb)) && ((last_value - current_reading) > (cp_ub)))|| ((((last_value - current_reading) > -(cp_lb))) && ((last_value - current_reading) < (cp_lb))))
     {
      if(ma_o[0] > ma_c[0])
        {
         if(PositionsTotal() == 0)
           {
            Trade.Sell(TRADING_VOLUME,Symbol(),bid,(ask+trade_sl),(ask-trade_sl));
            count = 0;
           }
        }
     }
//--- Ridge Regression Buy
   else
      if(((last_value - current_reading) >= (cp_lb)) < ((last_value - current_reading) < cp_ub))
        {
         if(ma_c[0] < ma_o[0])
           {
            if(PositionsTotal() == 0)
              {
               Trade.Buy(TRADING_VOLUME,Symbol(),ask,(bid-trade_sl),(bid+trade_sl));
               count = 0;
              }
           }
        }
  }
//+------------------------------------------------------------------+

#undef RSI_BUFFER_SIZE
#undef RSI_PERIOD
#undef RSI_PRICE
#undef RSI_TIME_FRAME
#undef SYSTEM_TIME_FRAME
#undef TRADING_VOLUME
#undef ONNX_INPUTS
#undef ONNX_OUTPUTS
//+------------------------------------------------------------------+
我们将在图 14 和图 15 中强调的相同条件下测试该策略。以下是我们使用交易策略第二版获得的结果。第二版交易策略产生的资金曲线似乎与第一条资金曲线完全相同。
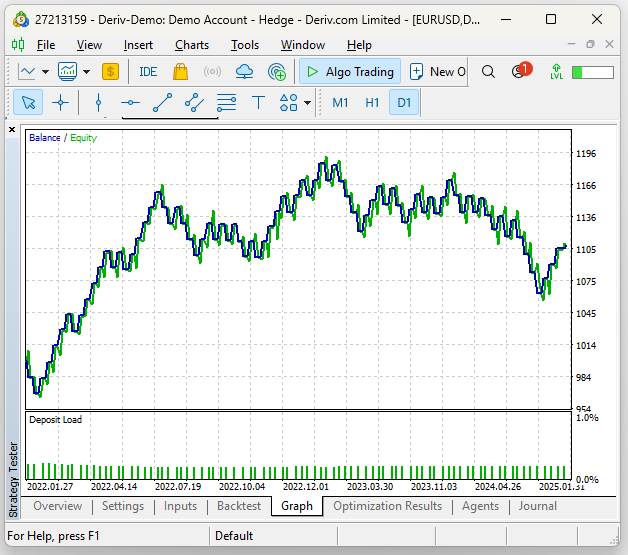
图 21:可视化我们第二个交易策略的盈利能力。
只有当我们查看详细的统计数据时,两种策略之间的差异才开始显现。我们的夏普比率和预期回报下降了。我们的新策略执行了 85 笔交易,比初始策略的 61 笔交易多了 39%。此外,我们的多头持仓总数从初始测试中的区区 4 笔,增加到第二次测试中的 42 笔。这是 950% 的增长。因此,当我们考虑到承担的额外风险是显著的,而准确性和盈利性统计数据却只是小幅下降时,我们便开始对使用该策略建立起积极的预期。在之前的测试中,我们所有交易的 57.38% 是盈利的,而现在为 56.47%,准确率下降了约 1.59%。
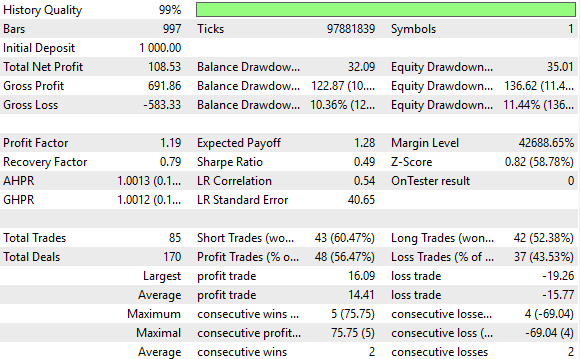
图 22:优化版交易策略性能的详细统计数据。
结论
阅读本文后,读者将能够理解如何运用网格搜索技术结合统计模型,来帮助他们为指标选择最优周期,而无需进行多次回测和手动搜索每一个可能的周期。此外,读者还学到了一种可能的方法,来估算和比较他们希望交易的新 RSI 值与传统的 70 和 30 值之间的差别,从而使读者能够重拾信心来对抗不利的市场条件。
| 文件名 | 说明 |
|---|---|
| Algorithmic Inputs Selection.ipynb | 我们在Python中用于数值分析的 Jupyter Notebook。 |
| EURUSD Testing RSI Class.mql5 | 我们用于测试自定义 RSI 类实现的 MQL5 脚本。 |
| EURUSD RSI Algorithmic Input Selection.mql5 | 我们用于获取历史市场数据的脚本。 |
| Algorithmic Input Selection.mql5 | 我们构建的交易策略的初始版本。 |
| Algorithmic Input Selection 2.mql5 | 我们经过改进的交易策略版本,它修正了初始交易策略学习到的偏差。 |
本文由MetaQuotes Ltd译自英文
原文地址: https://www.mql5.com/en/articles/17571
注意: MetaQuotes Ltd.将保留所有关于这些材料的权利。全部或部分复制或者转载这些材料将被禁止。
本文由网站的一位用户撰写,反映了他们的个人观点。MetaQuotes Ltd 不对所提供信息的准确性负责,也不对因使用所述解决方案、策略或建议而产生的任何后果负责。
