
時系列マイニングのためのデータラベル(第2回):Pythonを使ってトレンドマーカー付きデータセットを作成する
はじめに
前回の記事では、チャートの傾向を観察してデータにラベルを付け、データを「csv」ファイルに保存する方法を紹介しました。今回は、考え方を変えて、データ自体から始めましょう。
Pythonを使用してデータを処理していきます。なぜPythonなのでしょうか。便利で速いとはいえ動作が速いわけではありませんが、Pythonの膨大なライブラリを利用すると、開発サイクルを大幅に短縮できます。
始めましょう。
目次
Pythonライブラリの選択
Pythonには多くの優秀な開発者がおり、多種多様なライブラリを提供しているため、開発が容易になり、開発時間を大幅に節約できることは誰もが知っています。以下は、私の関連するPythonライブラリのコレクションです。その一部は異なるアーキテクチャに基づいており、一部は取引に使用でき、一部はバックテストに使用できます。これにはラベル付きデータが含まれますが、これに限定されるものではありません。興味のある方は調べてみてください。この記事では詳細な紹介はおこないません。
- statsmodels:データを探索し、統計モデルを推定し、統計テストを実行するためのPythonモジュール:http://statsmodels.sourceforge.net
- dynts:時系列分析と操作のためのPythonパッケージ:https://github.com/quantmind/dynts
- PyFlux:モデルの時系列モデリングと推論(頻度主義およびベイジアン)のためのPythonライブラリ:https://github.com/RJT1990/pyflux
- tsfresh:時系列からの関連特徴の自動抽出:https://github.com/blue-yonder/tsfresh
- hasura/quandl-metabase:Metabaseを使用してQuandlの時系列データセットを視覚化するための Hasuraクイックスタート:https://platform.hasura.io/hub /projects/anirudhm/quandl-metabase-time-series
- Facebook Prophet - 線形または非線形の成長を伴う複数の季節性を持つ時系列データの高品質な予測を生成するツール:https://github.com/facebook/prophet
- tsmoothie:ベクトル化された方法で時系列平滑化と外れ値検出をおこなうためのPythonライブラリ:https://github.com/cerlymarco/tsmoothie
- pmdarima - Rの auto.arima 関数と同等のものを含む、Pythonの時系列分析機能の空白を埋めるために設計された統計ライブラリ:https://github.com/alkaline-ml/pmdarima
- gluon-ts:PythonでのvProbabilistic時系列モデリング:https://github.com/awslabs/gluon-ts
- gs-quant:定量的金融のためのPythonツールキット:https://github.com/goldmansachs/gs-quant
- willowtree:デリバティブ価格設定のためのウィローツリーラティスの堅牢かつ柔軟なPython実装:https://github.com/federicomariamassari/willowtree
- Financial-Engineering:モンテカルロ法の金融エンジニアリングプロジェクトへの応用 (Python):https://github.com/federicomariamassari/financial-engineering
- optlib:Pythonで書かれた金融オプション価格設定用のライブラリ:https://github.com/dbrojas/optlib
- tf-quant-finance:定量的金融用の高性能 TensorFlowライブラリ:https://github.com/google/tf-quant-finance
- Q-Fin:数理ファイナンス用のPythonライブラリ:https://github.com/RomanMichaelPaolucci/Q-Fin
- Quantsbin:バニラオプション価格、ギリシャ、およびそれらに関するその他のさまざまな分析の価格設定とプロットのためのツール:https://github.com/quantsbin/Quantsbin
- finoptions:さまざまなオプションの価格設定をおこなうためのfExoticOptionsの部分実装を含む、RパッケージfOptionsの完全なPython実装:https://github.com/bbcho/finoptions-dev
- pypme:PME (Public Market Equivalent)の計算:https://github.com/ymyke/pypme
- Blankly:完全に統合されたバックテスト、ペーパー 取引、ライブデプロイメント:https://github.com/Blankly-Finance/Blankly
- TA-Lib:TA-LibのPythonラッパー (http://ta-lib.org/):https:// github.com/mrjbq7/ta-lib
- zipline:Pythonアルゴリズム取引ライブラリ:https://github.com/quantopian/zipline
- QuantSoftware Toolkit:ポートフォリオの構築と管理をサポートするために設計されたPythonベースのオープンソースソフトウェアフレームワーク:https://github.com/QuantSoftware/QuantSoftwareToolkit
- finta:Pandasに実装された一般的な金融テクニカル分析指標:https://github.com/peerchemist/finta
- Tulipy:金融テクニカル分析指標 ライブラリ(tulipindicatorsのPythonバインディング):https://github.com/cirla/tulipy
- lppls:対数周期べき乗則特異点(LPPLS)モデルをフィッティングするためのPythonモジュール:https ://github.com/Boulder-Investment-Technologies/lpls
MetaTrader 5ライブラリを使用してMT5クライアントからデータを取得する
もちろん、最も基本的なことは、Pythonが既にPCにインストールされていることです。インストールされていない場合、Pythonの公式バージョンをインストールすることはお勧めしません。私はメンテナンスが簡単なAnacondaを使用することを好みます。ただし、Anacondaの通常バージョンは非常に大きく、ビジュアル管理、エディターなどを含む豊富なコンテンツが統合されているのですが、お恥ずかしいことに、私はそれらをほとんど使用しません。そのため、短く簡潔で、シンプルで実用的なminincondaを強くお勧めします。Miniconda公式Webサイトのアドレスは、 Miniconda ::Anaconda.orgです。
1.基本的な環境の初期化
まず仮想環境を作成し、Anaconda Promoteタイプを開きます。
conda create -n Data_label python=3.10 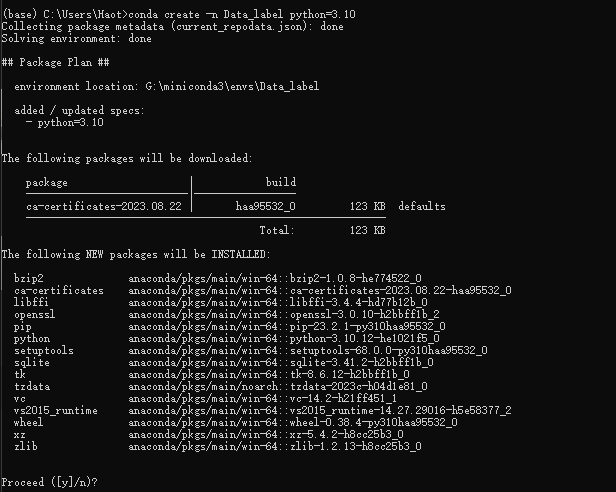
「y」を入力し、環境が作成されるのを待ってから、次のように入力します。
conda activate Data_label
注:conda仮想環境を作成するときは、必ずpython=x.xxを追加してください。そうしないと、使用中に不可解なトラブルが発生します。これは、それに悩まされた人からの提案です。
2. 必要なライブラリをインストールする
重要なライブラリMetaTrader 5をインストールします。conda Promoteで次を入力します。
pip install MetaTrader5
pytrendseriesをインストールします。conda Promoteで次を入力します。
pip install pytrendseries
3.Pythonファイルを作成する
MetaEditor を開き、[ツール]->[オプション] を見つけて、[コンパイラー] オプションのPython列にPythonのパスを入力します。私の場合はG:miniconda3\envs\Data_labelです。
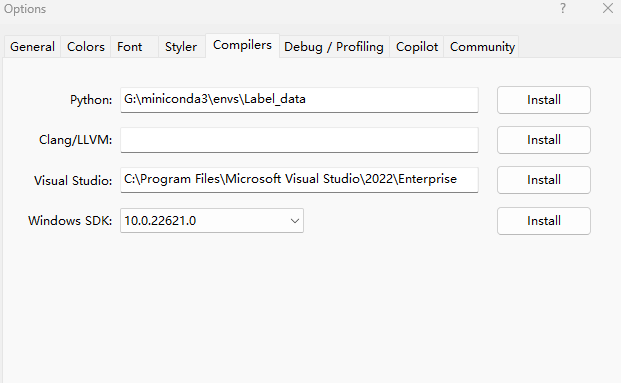
完了したら、[ファイル]->[新規](または Ctrl + N)を選択して新しいファイルを作成し、次のようにポップアップ ウィンドウで[Pythonスクリプト]を選択します。

[次へ]をクリックして、次のようにファイル名を入力します。
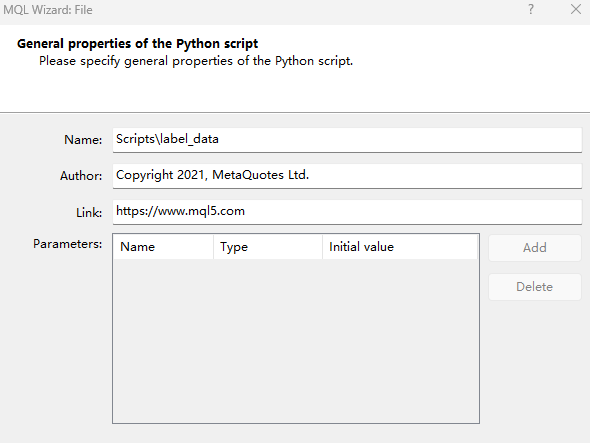
[OK]をクリックすると、以下のウィンドウが表示されます。

4. クライアントに接続してデータを取得する
元の自動生成コードを削除し、次のコードに置き換えます。
# Copyright 2021, MetaQuotes Ltd.
# https://www.mql5.com

import MetaTrader5 as mt

if not mt.initialize():
    print('initialize() failed!')
else:
   print(mt.version())
   mt.shutdown()
コンパイルして実行してエラーが報告されるかどうかを確認し、問題がない場合は次の出力が表示されます。

「initialize() failed!」というプロンプトが表示された場合は、次の色で強調されたコードに示すように、initialize()関数にパラメータパスを追加してください。これはクライアント実行可能ファイルへのパスです。
# Copyright 2021, MetaQuotes Ltd.
# https://www.mql5.com

import MetaTrader5 as mt

if not mt.initialize("D:\\Project\\mt\\MT5\\terminal64.exe"):
    print('initialize() failed!')
else:
    print(mt.version())
    mt.shutdown()
すべての準備が整ったので、データを取得しましょう。
# Copyright 2021, MetaQuotes Ltd.
# https://www.mql5.com

import MetaTrader5 as mt

if not mt.initialize("D:\\Project\\mt\\MT5\\terminal64.exe"):
    print('initialize() failed!')
else:
   sb=mt.symbols_total()
   rts=None
   if sb > 0:
     rts=mt.copy_rates_from_pos("GOLD_micro",mt.TIMEFRAME_M15,0,10000)
   mt.shutdown()
   print(rts[0:5])
上記のコードでは、銘柄が検出されなかったためにエラーが報告されないように「sb=mt.symbols_total()」を追加しました。また、「copy_rates_from_pos("GOLD_micro", mt.TIMEFRAME_M15,0,10000)」は、GOLD_microのM15期間から10,000バーをコピーすることを意味します。コンパイル後に次の出力が生成されます。
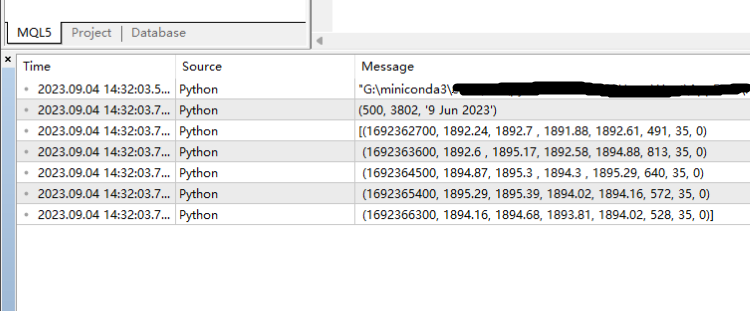
これまでのところ、クライアントからデータを取得することに成功しています。
データ形式変換
クライアントからデータを取得しましたが、データ形式は必要ありません。データは次のような「numpy.ndarray」です。
"[(1692368100, 1893.51, 1893.97,1893.08,1893.88,548, 35, 0)
(1692369000、1893.88、1894.51、1893.41、1894.51、665、35、0)
(1692369900、1894.5、1894.91、1893.25、1893.62、755、35、0)
(1692370800、1893.68、1894.7、1893.16、1893.49、1108、35、0)
(1692371700、1893.5、1893.63、1889.43、1889.81、1979、35、0)
(1692372600、1889.81、1891.23、1888.51、1891.04、2100、35、0)
(1692373500、1891.04、1891.3、1889.75、1890.07、1597、35、0)
(1692374400、1890.11、1894.03、1889.2、1893.57、2083、35、0)
(1692375300、1893.62、1894.94、1892.97、1894.25、1692、35、0)
(1692376200、1894.25、1894.88、1890.72、1894.66、2880、35、0)
(1692377100、1894.67、1896.69、1892.47、1893.68、2930、35、0)
...(1693822500、1943.97、1944.28、1943.24、1943.31、883、35、0)
(1693823400、1943.25、1944.13、1942.95、1943.4、873、35、0)
(1693824300、1943.4、1944.07、1943.31、1943.64、691、35、0)
(1693825200、1943.73、1943.97、1943.73、1943.85、22、35、0)]"
それでは、pandasを使用して変換しましょう。追加されたコードは緑色でマークされています。
# Copyright 2021, MetaQuotes Ltd.
# https://www.mql5.com

import MetaTrader5 as mt
import pandas as pd

if not mt.initialize("D:\\Project\\mt\\MT5\\terminal64.exe"):
    print('initialize() failed!')
else:
   print(mt.version())
   sb=mt.symbols_total()
   rts=None
   if sb > 0:
     rts=mt.copy_rates_from_pos("GOLD_micro",mt.TIMEFRAME_M15,0,1000)
   mt.shutdown()
   rts_fm=pd.DataFrame(rts)
ここで、以下のようにデータ形式をもう一度見てみましょう。
print(rts_fm.head(10)) 
td_data=rts_fm[['time','close']].set_index('time') データの最初の10行がどのようになっているかを見てみましょう。
print(td_data.head(10))
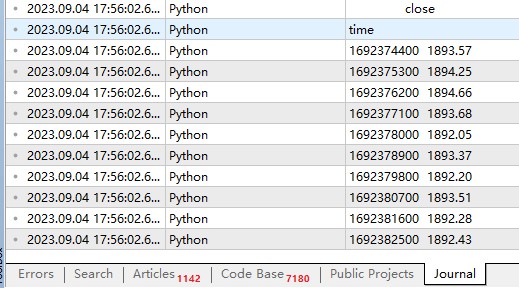
注:td_dataは最後のデータスタイルではなく、データの傾向を取得するための移行製品にすぎません。
これで、データは完全に使用できるようになりましたが、その後の操作のために、日付形式をデータフレームに変換する方が良いため、「td_data=rts_fm[['time','close']].set_index('time')」の前に次のコードを追加する必要があります。
rts_fm['time']=pd.to_datetime(rts_fm['time'], unit='s')
出力は次のようになります。
| time | close |
|---|---|
| 2023-08-18 20:45:00 | 1888.82000 |
| 2023-08-18 21:00:00 | 1887.53000 |
| 2023-08-18 21:15:00 | 1888.10000 |
| 2023-08-18 21:30:00 | 1888.98000 |
| 2023-08-18 21:45:00 | 1888.37000 |
| 2023-08-18 22:00:00 | 1887.51000 |
| 2023-08-18 22:15:00 | 1888.21000 |
| 2023-08-18 22:30:00 | 1888.73000 |
| 2023-08-18 22:45:00 | 1889.12000 |
| 2023-08-18 23:00:00 | 1889.20000 |
以下は、このセクションの完全なコードです。
# Copyright 2021, MetaQuotes Ltd.
# https://www.mql5.com

import MetaTrader5 as mt
import pandas as pd

if not mt.initialize("D:\\Project\\mt\\MT5\\terminal64.exe"):
    print('initialize() failed!')
else:
   print(mt.version())
   sb=mt.symbols_total()
   rts=None
   if sb > 0:
     rts=mt.copy_rates_from_pos("GOLD_micro",mt.TIMEFRAME_M15,0,1000)
   mt.shutdown()
   rts_fm=pd.DataFrame(rts)
   rts_fm['time']=pd.to_datetime(rts_fm['time'], unit='s')
   td_data=rts_fm[['time','close']].set_index('time')
   print(td_data.head(10))
ラベルデータ
1. トレンドデータの取得
まず、pytrendseriesパッケージをインポートします。
import pytrendseries as pts pts.detecttrend()関数を使用してトレンドを見つけてから、この関数のtd変数を定義します。このパラメータにはdowntrendまたはuptrendの2つのオプションがあります。
td='downtrend' # or "uptrend"
トレンドの最大期間として別のパラメータwdが必要です。
wd=120 定義してもしなくてもよいパラメータもありますが、個人的には定義した方が良いと思います。このパラメータはトレンドの最小期間を指定します。
limit=6 これで、関数にパラメータを入力して傾向を取得できます。
trends=pts.detecttrend(td_data,trend=td,limit=limit,window=wd)
次に、結果を確認します。
print(trends.head(15))
| from | to | price0 | price1 | index_from | 終了インデックス | time_span | ドローダウン | |
|---|---|---|---|---|---|---|---|---|
| 1 | 2023-08-21 01:00:00 | 2023-08-21 02:15:00 | 1890.36000 | 1889.24000 | 13 | 18 | 5 | 0.00059 |
| 2 | 2023-08-21 03:15:00 | 2023-08-21 04:45:00 | 1890.61000 | 1885.28000 | 22 | 28 | 6 | 0.00282 |
| 3 | 2023-08-21 08:00:00 | 2023-08-21 13:15:00 | 1893.30000 | 1886.86000 | 41 | 62 | 21 | 0.00340 |
| 4 | 2023-08-21 15:45:00 | 2023-08-21 17:30:00 | 1896.99000 | 1886.16000 | 72 | 79 | 7 | 0.00571 |
| 5 | 2023-08-21 20:30:00 | 2023-08-21 22:30:00 | 1894.77000 | 1894.12000 | 91 | 99 | 8 | 0.00034 |
| 6 | 2023-08-22 04:15:00 | 2023-08-22 05:45:00 | 1896.19000 | 1894.31000 | 118 | 124 | 6 | 0.00099 |
| 7 | 2023-08-22 06:15:00 | 2023-08-22 07:45:00 | 1896.59000 | 1893.80000 | 126 | 132 | 6 | 0.00147 |
| 8 | 2023-08-22 13:00:00 | 2023-08-22 16:45:00 | 1903.38000 | 1890.17000 | 153 | 168 | 15 | 0.00694 |
| 9 | 2023-08-22 19:00:00 | 2023-08-22 21:15:00 | 1898.08000 | 1896.25000 | 177 | 186 | 9 | 0.00096 |
| 10 | 2023-08-23 04:45:00 | 2023-08-23 06:00:00 | 1901.46000 | 1900.25000 | 212 | 217 | 5 | 0.00064 |
| 11 | 2023-08-23 11:30:00 | 2023-08-23 13:30:00 | 1904.84000 | 1901.42000 | 239 | 247 | 8 | 0.00180 |
| 12 | 2023-08-23 19:45:00 | 2023-08-23 23:30:00 | 1919.61000 | 1915.05000 | 272 | 287 | 15 | 0.00238 |
| 13 | 2023-08-24 09:30:00 | 2023-08-25 09:45:00 | 1921.91000 | 1912.93000 | 323 | 416 | 93 | 0.00467 |
| 14 | 2023-08-25 15:00:00 | 2023-08-25 16:30:00 | 1919.88000 | 1913.30000 | 437 | 443 | 6 | 0.00343 |
| 15 | 2023-08-28 04:15:00 | 2023-08-28 07:15:00 | 1916.92000 | 1915.07000 | 486 | 498 | 12 | 0.00097 |
関数pts.vizplot.plot_trend()を使用して結果を視覚化することもできます。
pts.vizplot.plot_trend(td_data,trends)
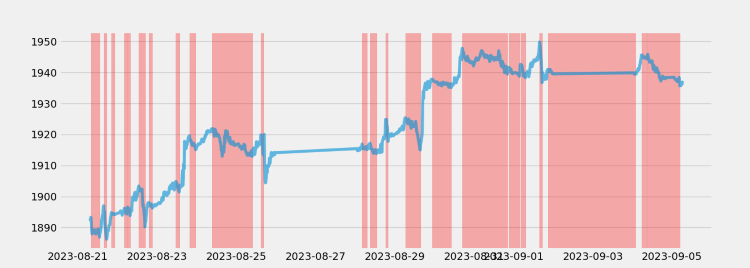
同様に、コードによって上昇傾向を確認できます。
td="uptrend"
wd=120
limit=6

trends=pts.detecttrend(td_data,trend=td,limit=limit,window=wd)
print(trends.head(15))
pts.vizplot.plot_trend(td_data,trends)
結果はこうなります。
| from | to | price0 | price1 | index_from | index_to | time_span | drawup | |
|---|---|---|---|---|---|---|---|---|
| 1 | 2023-08-18 22:00:00 | 2023-08-21 03:15:00 | 1887.51000 | 1890.61000 | 5 | 22 | 17 | 0.00164 |
| 2 | 2023-08-21 04:45:00 | 2023-08-22 10:45:00 | 1885.28000 | 1901.35000 | 28 | 144 | 116 | 0.00852 |
| 3 | 2023-08-22 11:15:00 | 2023-08-22 13:00:00 | 1898.78000 | 1903.38000 | 146 | 153 | 7 | 0.00242 |
| 4 | 2023-08-22 16:45:00 | 2023-08-23 19:45:00 | 1890.17000 | 1919.61000 | 168 | 272 | 104 | 0.01558 |
| 5 | 2023-08-23 23:30:00 | 2023-08-24 09:30:00 | 1915.05000 | 1921.91000 | 287 | 323 | 36 | 0.00358 |
| 6 | 2023-08-24 15:30:00 | 2023-08-24 17:45:00 | 1912.97000 | 1921.24000 | 347 | 356 | 9 | 0.00432 |
| 7 | 2023-08-24 23:00:00 | 2023-08-25 01:15:00 | 1916.41000 | 1917.03000 | 377 | 382 | 5 | 0.00032 |
| 8 | 2023-08-25 03:15:00 | 2023-08-25 04:45:00 | 1915.20000 | 1916.82000 | 390 | 396 | 6 | 0.00085 |
| 9 | 2023-08-25 09:45:00 | 2023-08-25 17:00:00 | 1912.93000 | 1920.03000 | 416 | 445 | 29 | 0.00371 |
| 10 | 2023-08-25 17:45:00 | 2023-08-28 18:30:00 | 1904.37000 | 1924.86000 | 448 | 543 | 95 | 0.01076 |
| 11 | 2023-08-28 20:00:00 | 2023-08-29 06:30:00 | 1917.74000 | 1925.41000 | 549 | 587 | 38 | 0.00400 |
| 12 | 2023-08-29 10:00:00 | 2023-08-29 12:45:00 | 1922.00000 | 1924.21000 | 601 | 612 | 11 | 0.00115 |
| 13 | 2023-08-29 15:30:00 | 2023-08-30 17:00:00 | 1914.98000 | 1947.79000 | 623 | 721 | 98 | 0.01713 |
| 14 | 2023-08-30 23:45:00 | 2023-08-31 04:45:00 | 1942.09000 | 1947.03000 | 748 | 764 | 16 | 0.00254 |
| 15 | 2023-08-31 09:30:00 | 2023-08-31 15:00:00 | 1943.52000 | 1947.00000 | 783 | 805 | 22 | 0.00179 |

2. データにラベルを付ける
1). データ形式を解析する
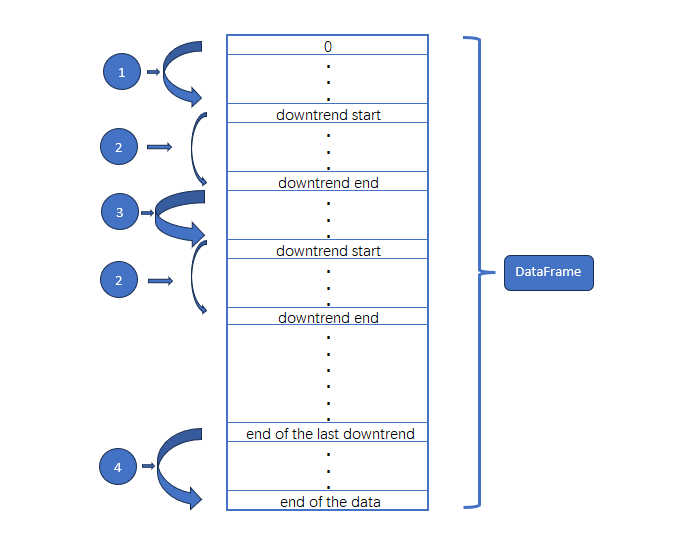
①はデータの始まりから最初の下降トレンドの始まりまでを意味します。これが上昇トレンドであると仮定します。
②は下降トレンドを意味します。
③はデータの途中で上昇トレンドを意味します。
④は最後の下降トレンドの終了を意味します。
したがって、これら 4 つの部分にラベルロジックを実装する必要があります。
2). ラベルロジック
いくつかの基本的な変数を定義することから始めましょう。
rts_fm['trend']=0
rts_fm['trend_index']=0
max_len_rts=len(rts_fm)
max_len=len(trends)
last_start=0
last_end=0
forループを使用してtrends変数を走査し、各データ部分の先頭と末尾を取得します。
for trend in trends.iterrows():
        pass
各セグメントの開始インデックスと終了インデックスを取得します。
for trend in trends.iterrows():
    start=trend[1]['index_from']
    end=trend[1]['index_to']
rts_fm["trend"]自体は0に初期化されているため、上昇トレンドのtrend列を変更する必要はありませんが、データの始まりが下降トレンドかどうかを確認する必要があります。下降トレンドではない場合、上昇トレンドと仮定しました。
for trend in trends.iterrows():
    start=trend[1]['index_from']
    end=trend[1]['index_to']

    if trend[0]==1 and start!=0:
        # Since the rts_fm["trend"] itself has been initialized to 0, there is no need to change the "trend" column
        rts_fm['trend_index'][0:start]=list(range(0,start))
データの開始時と同様に、データの終了時に下降トレンドで終了するかどうかを確認する必要があります。
for trend in trends.iterrows():
    start=trend[1]['index_from']
    end=trend[1]['index_to']

    if trend[0]==1 and start!=0:
        # Since the rts_fm["trend"] itself has been initialized to 0, there is no need to change the "trend" column
        rts_fm['trend_index'][0:start]=list(range(0,start))
    elif trend[0]==max_len and end!=max_len_rts-1:
	#we need to see if it ends in a downtrend at the end of the data
        rts_fm['trend_index'][last_end+1:len(rts_fm)]=list(range(0,max_len_rts-last_end-1))
データの先頭と末尾以外の上昇トレンド部分を処理します。
for trend in trends.iterrows():
    start=trend[1]['index_from']
    end=trend[1]['index_to']

    if trend[0]==1 and start!=0:
        # Since the rts_fm["trend"] itself has been initialized to 0, there is no need to change the "trend" column
        rts_fm['trend_index'][0:start]=list(range(0,start))
    elif trend[0]==max_len and end!=max_len_rts-1:
        #we need to see if it ends in a downtrend at the end of the data
        rts_fm['trend_index'][last_end+1:len(rts_fm)]=list(range(0,max_len_rts-last_end-1))
    else:
        #Process the uptrend segments other than the beginning and end of the data
        rts_fm["trend_index"][last_end+1:start]=list(range(0,start-last_end-1))
下降トレンドの各セグメントを処理します。
for trend in trends.iterrows():
    start=trend[1]['index_from']
    end=trend[1]['index_to']

    if trend[0]==1 and start!=0:
        # Since the rts_fm["trend"] itself has been initialized to 0, there is no need to change the "trend" column
        rts_fm['trend_index'][0:start]=list(range(0,start))
    elif trend[0]==max_len and end!=max_len_rts-1:
        #we need to see if it ends in a downtrend at the end of the data
        rts_fm['trend_index'][last_end+1:len(rts_fm)]=list(range(0,max_len_rts-last_end-1))
    else:
        #Process the uptrend segments other than the beginning and end of the data
        rts_fm["trend_index"][last_end+1:start]=list(range(0,start-last_end-1))

    #Process each segments of the downtrend
    rts_fm["trend"][start:end+1]=1
    rts_fm["trend_index"][start:end+1]=list(range(0,end-start+1))
    last_start=start
    last_end=end
3). 補足
データの先頭と末尾が上昇傾向であると想定していますが、これでは十分な精度が得られないと思われる場合は、先頭と末尾の部分を削除することもできます。これをおこなうには、forループの終了後に次のコードを追加します。
rts_fm['trend']=0
rts_fm['trend_index']=0
max_len_rts=len(rts_fm)
max_len=len(trends)
last_start=0
last_end=0
for trend in trends.iterrows():
    start=trend[1]['index_from']
    end=trend[1]['index_to']

    if trend[0]==1 and start!=0:
        # Since the rts_fm["trend"] itself has been initialized to 0, there is no need to change the "trend" column
        rts_fm['trend_index'][0:start]=list(range(0,start))
    elif trend[0]==max_len and end!=max_len_rts-1:
        #we need to see if it ends in a downtrend at the end of the data
        rts_fm['trend_index'][last_end+1:len(rts_fm)]=list(range(0,max_len_rts-last_end-1))
    else:
        #Process the uptrend segments other than the beginning and end of the data
        rts_fm["trend_index"][last_end+1:start]=list(range(0,start-last_end-1))

    #Process each segments of the downtrend
    rts_fm["trend"][start:end+1]=1
    rts_fm["trend_index"][start:end+1]=list(range(0,end-start+1))
    last_start=start
    last_end=end
rts_fm=rts_fm.iloc[trends.iloc[0,:]['index_from']:end,:]
3. 確認
それが完了したら、データが期待を満たしているかどうかを確認してみましょう(この例では、最初の25個のデータのみを調べています)。
rts_fm.head(25) | time | open | high | low | close | tick_volume | spread | real_volume | trend | trend_index | |
|---|---|---|---|---|---|---|---|---|---|---|
| 0 | 2023-08-22 11:30:00 | 1898.80000 | 1899.72000 | 1898.22000 | 1899.30000 | 877 | 35 | 0 | 0 | 0 |
| 1 | 2023-08-22 11:45:00 | 1899.31000 | 1899.96000 | 1898.84000 | 1899.81000 | 757 | 35 | 0 | 0 | 1 |
| 2 | 2023-08-22 12:00:00 | 1899.86000 | 1900.50000 | 1899.24000 | 1900.01000 | 814 | 35 | 0 | 0 | 2 |
| 3 | 2023-08-22 12:15:00 | 1900.05000 | 1901.26000 | 1899.99000 | 1900.48000 | 952 | 35 | 0 | 0 | 3 |
| 4 | 2023-08-22 12:30:00 | 1900.48000 | 1902.44000 | 1900.17000 | 1902.19000 | 934 | 35 | 0 | 0 | 4 |
| 5 | 2023-08-22 12:45:00 | 1902.23000 | 1903.59000 | 1902.21000 | 1902.64000 | 891 | 35 | 0 | 0 | 5 |
| 6 | 2023-08-22 13:00:00 | 1902.69000 | 1903.94000 | 1902.24000 | 1903.38000 | 873 | 35 | 0 | 1 | 0 |
| 7 | 2023-08-22 13:15:00 | 1903.40000 | 1904.29000 | 1901.71000 | 1902.08000 | 949 | 35 | 0 | 1 | 1 |
| 8 | 2023-08-22 13:30:00 | 1902.10000 | 1903.37000 | 1902.08000 | 1902.63000 | 803 | 35 | 0 | 1 | 2 |
| 9 | 2023-08-22 13:45:00 | 1902.64000 | 1902.75000 | 1901.75000 | 1901.80000 | 1010 | 35 | 0 | 1 | 3 |
| 10 | 2023-08-22 14:00:00 | 1901.79000 | 1902.47000 | 1901.33000 | 1901.96000 | 800 | 35 | 0 | 1 | 4 |
| 11 | 2023-08-22 14:15:00 | 1901.94000 | 1903.04000 | 1901.72000 | 1901.73000 | 785 | 35 | 0 | 1 | 5 |
| 12 | 2023-08-22 14:30:00 | 1901.71000 | 1902.62000 | 1901.66000 | 1902.38000 | 902 | 35 | 0 | 1 | 6 |
| 13 | 2023-08-22 14:45:00 | 1902.38000 | 1903.23000 | 1901.96000 | 1901.96000 | 891 | 35 | 0 | 1 | 7 |
| 14 | 2023-08-22 15:00:00 | 1901.94000 | 1903.25000 | 1901.64000 | 1902.41000 | 1209 | 35 | 0 | 1 | 8 |
| 15 | 2023-08-22 15:15:00 | 1902.39000 | 1903.00000 | 1898.97000 | 1899.87000 | 1971年 | 35 | 0 | 1 | 9 |
| 16 | 2023-08-22 15:30:00 | 1899.86000 | 1901.17000 | 1896.72000 | 1896.85000 | 2413 | 35 | 0 | 1 | 10 |
| 17 | 2023-08-22 15:45:00 | 1896.85000 | 1898.15000 | 1896.12000 | 1897.26000 | 2010年 | 35 | 0 | 1 | 11 |
| 18 | 2023-08-22 16:00:00 | 1897.29000 | 1897.45000 | 1895.52000 | 1895.97000 | 2384 | 35 | 0 | 1 | 12 |
| 19 | 2023-08-22 16:15:00 | 1895.96000 | 1896.31000 | 1893.87000 | 1894.48000 | 1990年 | 35 | 0 | 1 | 13 |
| 20 | 2023-08-22 16:30:00 | 1894.43000 | 1894.60000 | 1892.64000 | 1893.38000 | 2950 | 35 | 0 | 1 | 14 |
| 21 | 2023-08-22 16:45:00 | 1893.48000 | 1894.17000 | 1888.94000 | 1890.17000 | 2970 | 35 | 0 | 1 | 15 |
| 22 | 2023-08-22 17:00:00 | 1890.19000 | 1894.53000 | 1889.94000 | 1894.20000 | 2721 | 35 | 0 | 0 | 0 |
| 23 | 2023-08-22 17:15:00 | 1894.18000 | 1894.73000 | 1891.51000 | 1891.71000 | 1944年 | 35 | 0 | 0 | 1 |
| 24 | 2023-08-22 17:30:00 | 1891.74000 | 1893.70000 | 1890.91000 | 1893.59000 | 2215 | 35 | 0 | 0 | 2 |
トレンドタイプとトレンドインデックスマーカーがデータに正常に追加されたことがわかります。
4. ファイルを保存します
データは必要なほとんどのファイル形式で保存できます。to_json()メソッドを使用してJSONファイルとして保存したり、to_html()メソッドを使用してHTMLファイルとして保存したりできます。ファイルはここではデモンストレーションとして使用されており、CSVとしてのみ保存します。コードの最後に次を追加します。
rts_fm.to_csv('GOLD_micro_M15.csv') 手動校正
この時点で基本的な作業は完了しましたが、より正確なデータを取得したい場合は、さらに人間の介入が必要です。ここではいくつかの方向性を指摘するだけで、詳細なデモンストレーションはおこないません。
1. データの整合性確認
完全性とは、データ情報が欠落しているかどうかを指します。これには、データ全体が欠落しているか、データ内のフィールドが欠落している可能性があります。データの完全性はデータ品質の最も基本的な評価基準の1つです。たとえば、M15期間の株式市場データの前のデータが次のデータと2時間異なる場合、対応するツールを使用してデータを完成させる必要があります。もちろん、クライアント端末から外国為替データや株式市場データを取得することは一般的に困難ですが、交通データや気象データなど、他のソースから時系列データを取得する場合は、特に注意する必要があります。
データ品質の完全性は比較的簡単に評価でき、通常はデータ統計に記録された一意の値によって評価できます。たとえば、前の期間の株価データの終値が1000だったが、次の期間の始値が10になった場合、データが欠落していないか確認する必要があります。
2. データラベルの正確性を確認する
この記事の観点から見ると、上記で実装したデータ ラベル付けメソッドには特定の脆弱性がある可能性があります。正確なラベル付けデータを取得するには、pytrendseriesライブラリで提供されるメソッドに依存するだけでなく、データを視覚化し、傾向があるかどうかを観察する必要もあります。データの分類があまりにも影響を受けやすい、または鈍いため、いくつかの重要な情報が失われています。現時点では、データを分析する必要があります。分割する必要がある場合は分割し、結合する必要がある場合は結合する必要があります。この作業には、完了するには多大な労力と時間がかかるため、ここでは具体的な例は当面提供しません。
正確性とは、データに記録されている情報が正しいかどうか、データに記録されている情報に異常や間違いがないかを指します。一貫性とは異なり、精度に問題があるデータは、単なるルールの不一致ではありません。一貫性の問題は、データ ログのルールの不一致によって発生する可能性がありますが、必ずしもエラーが原因であるとは限りません。
3. ラベルが合理的かどうかを確認するために、基本的な統計検証を実行します。
- 整合性の配布:データセットの完全性を迅速かつ直観的に確認します。
- ヒートマップ:ヒートマップを使用すると、2 つの変数間の相関関係を簡単に観察できます。
- 階層的クラスタリング:データのさまざまなクラスが密接に関連しているか、分散しているかを確認できます。
まとめ
参考文献GitHub - rafa-rod/pytrendseries
完全なコードを以下に示します。
# Copyright 2021, MetaQuotes Ltd.
# https://www.mql5.com

import MetaTrader5 as mt
import pandas as pd
import pytrendseries as pts

if not mt.initialize("D:\\Project\\mt\\MT5\\terminal64.exe"):
    print('initialize() failed!')
else:
   print(mt.version())
   sb=mt.symbols_total()
   rts=None
   if sb > 0:
     rts=mt.copy_rates_from_pos("GOLD_micro",mt.TIMEFRAME_M15,0,1000)
   mt.shutdown()
   rts_fm=pd.DataFrame(rts)
   rts_fm['time']=pd.to_datetime(rts_fm['time'], unit='s')
   td_data=rts_fm[['time','close']].set_index('time')
   # print(td_data.head(10))

td='downtrend' # or "uptrend"
wd=120
limit=6

trends=pts.detecttrend(td_data,trend=td,limit=limit,window=wd)
# print(trends.head(15))
# pts.vizplot.plot_trend(td_data,trends)

rts_fm['trend']=0
rts_fm['trend_index']=0
max_len_rts=len(rts_fm)
max_len=len(trends)
last_start=0
last_end=0
for trend in trends.iterrows():
    start=trend[1]['index_from']
    end=trend[1]['index_to']

    if trend[0]==1 and start!=0:
        # Since the rts_fm["trend"] itself has been initialized to 0, there is no need to change the "trend" column
        rts_fm['trend_index'][0:start]=list(range(0,start))
    elif trend[0]==max_len and end!=max_len_rts-1:
        #we need to see if it ends in a downtrend at the end of the data
        rts_fm['trend_index'][last_end+1:len(rts_fm)]=list(range(0,max_len_rts-last_end-1))
    else:
        #Process the uptrend segments other than the beginning and end of the data
        rts_fm["trend_index"][last_end+1:start]=list(range(0,start-last_end-1))

    #Process each segments of the downtrend
    rts_fm["trend"][start:end+1]=1
    rts_fm["trend_index"][start:end+1]=list(range(0,end-start+1))
    last_start=start
    last_end=end
#rts_fm=rts_fm.iloc[trends.iloc[0,:]['index_from']:end,:]
rts_fm.to_csv('GOLD_micro_M15.csv')
注:
1. mt.initialize()関数に、mt.initialize("D:\\Project\\mt\\MT5\\terminal64.exe") のようにパスを追加する場合は、必ず自分のクライアント実行ファイルのパスに置き換えてください。
2.GOLD_micro_M15.csvファイルが見つからない場合は、クライアントルートで探します。たとえば、私のファイルはパス「D:\\Project\\mt\\MT5\\」にあります。
辛抱強く読んでいただきありがとうございました。何か得るものがあれば幸いです。
MetaQuotes Ltdにより英語から翻訳されました。
元の記事: https://www.mql5.com/en/articles/13253
警告: これらの資料についてのすべての権利はMetaQuotes Ltd.が保有しています。これらの資料の全部または一部の複製や再プリントは禁じられています。
この記事はサイトのユーザーによって執筆されたものであり、著者の個人的な見解を反映しています。MetaQuotes Ltdは、提示された情報の正確性や、記載されているソリューション、戦略、または推奨事項の使用によって生じたいかなる結果についても責任を負いません。
- 無料取引アプリ
- 8千を超えるシグナルをコピー
- 金融ニュースで金融マーケットを探索