Equilibrium Matrix Zone
- Indicatori
-
Syamsurizal Dimjati
 Hello traders, I design and develop high-quality indicators and Expert Advisors (EAs) for MT5 (since 2023), built to help you achieve more consistent and reliable trading results.
 - Versione: 1.0
- Attivazioni: 5
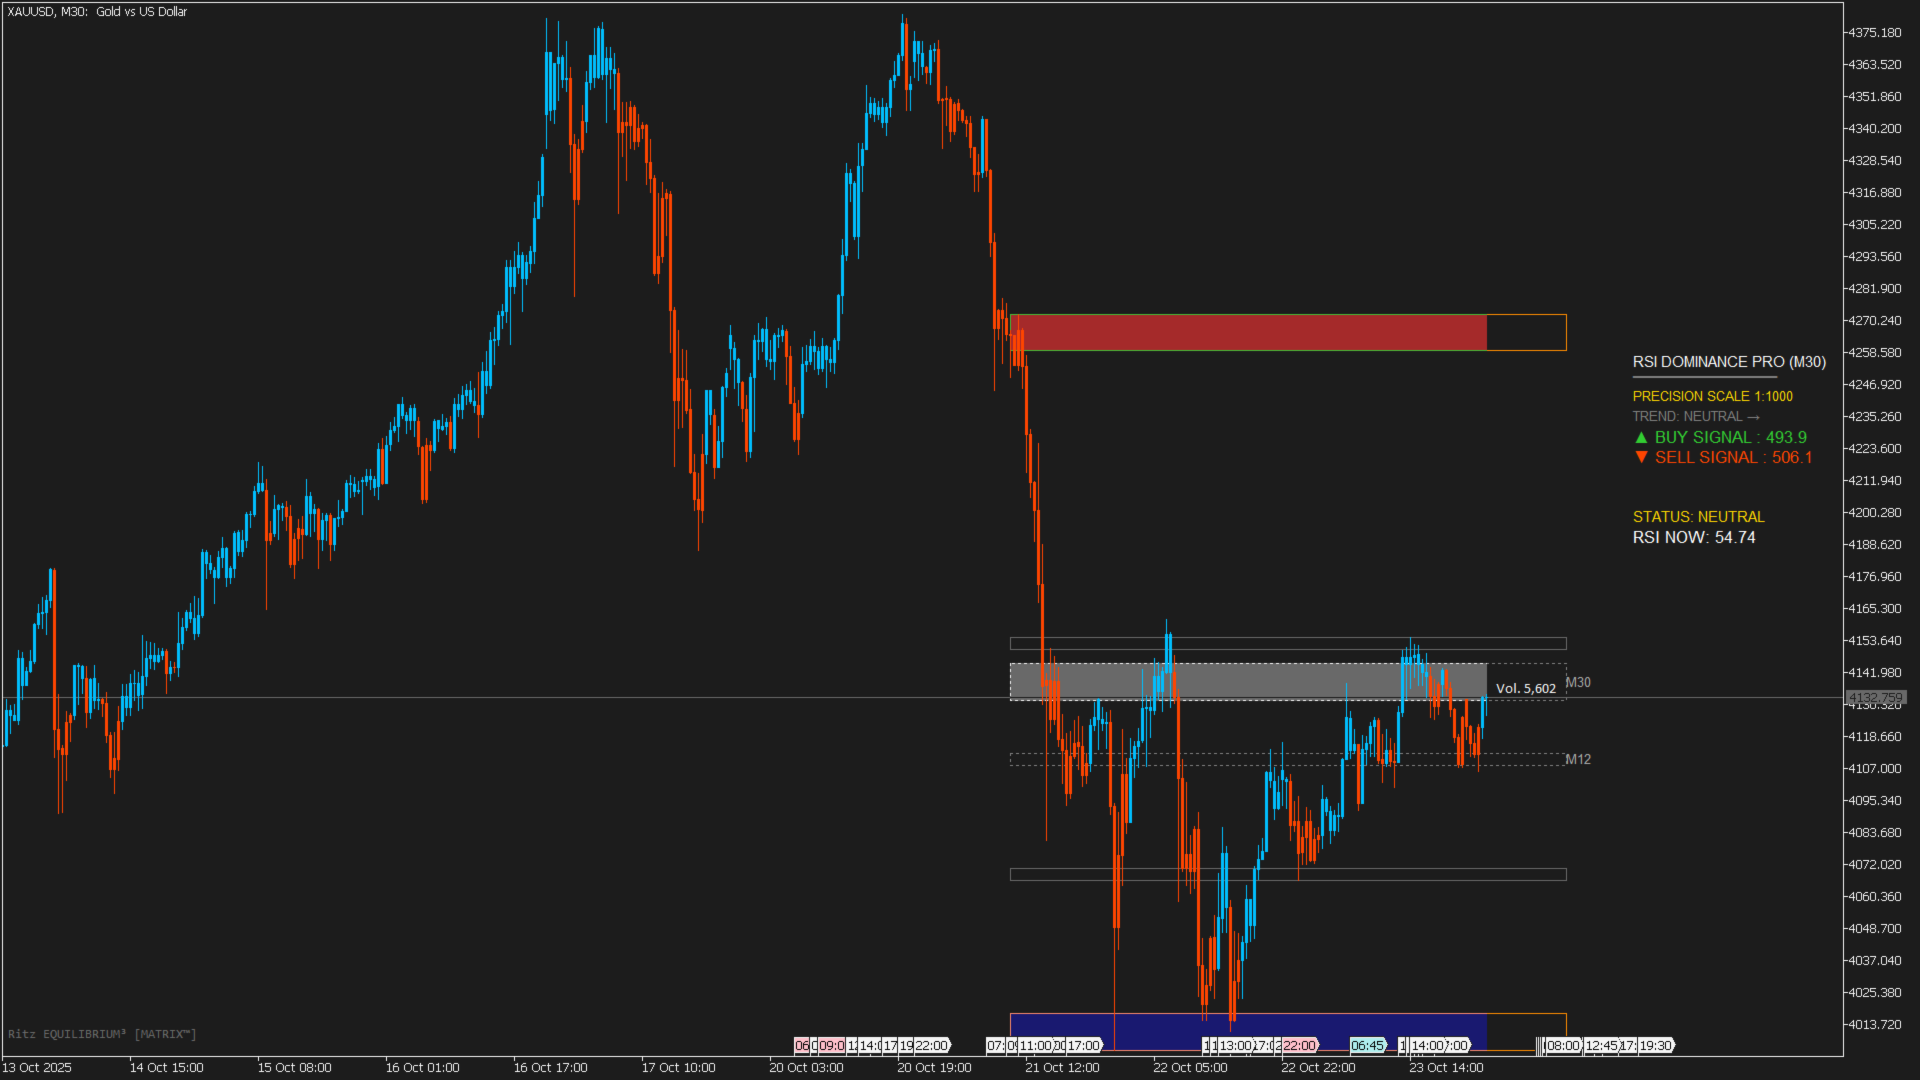
Ritz EQUILIBRIUM MATRIX™ ZONE
Smart Premium–Discount Equilibrium Zone MTF Visual System Ritz EQUILIBRIUM MATRIX™ is built on the Premium–Discount–Equilibrium (PDE) Theory - the concept that price constantly moves between Premium (expensive) and Discount (cheap) zones, while the Equilibrium Zone represents fair value where buyers and sellers balance out. This indicator visually highlights these zones across multiple timeframes, allowing traders to instantly:
-
Identify price location within the market structure.
-
Judge whether price is overvalued (Premium) or undervalued (Discount).
-
Spot potential reversal or continuation moments based on equilibrium balance.
2. Structure & Core Function
Each timeframe displays three main dynamic zones based on recent High–Low data (LookbackBars) :
| Zone | Calculation | Interpretation |
|---|---|---|
| Premium Zone | > 0.95×High + 0.05×Low | Overbought area — potential SELL zone |
| Equilibrium Zone | Between mid-ratios (≈52.5%) | Neutral balance — wait & observe |
| Discount Zone | < 0.95×Low + 0.05×High | Oversold area — potential BUY zone |
Zones are semi-transparent for clear chart visibility without hiding candles.
3. Multi-Timeframe Visualization
When AutoDetectAllTF = true, the system automatically detects historical High–Low from multiple timeframes
(M1, M5, M15, M30, H1, H4, D1) and draws all PDE zones in one unified chart.
Each timeframe uses its own distinctive color:
M5 | M15 | H1 | H4 | D1
Example:
If price is in Discount Zone on H1 but Premium Zone on M5,
it may signal a short-term retrace before continuation upward.
4. Chart Interpretation
| Price Location | Market Interpretation | Bias |
|---|---|---|
| Premium Zone | Overbought, exhaustion likely | SELL bias |
| Equilibrium Zone | Market balance, indecision | Neutral / Range |
| Discount Zone | Oversold, undervalued | BUY bias |
Pro Tips:
-
Cross-check between higher and lower timeframes (e.g., H1 vs H4).
-
Strong setups occur when H1 = Discount aligns with H4 = Equilibrium.
-
Watch RitzLineEQ3 for real-time positioning.
5. Visual Design
-
Soft transparency ensures candles remain visible.
-
Equilibrium zones use lighter alpha for balance emphasis.
-
Auto-redraw triggers on timeframe change or every 10 bars.
-
Optimized for both dark and light chart themes.
6. Performance & Stability
-
Refreshes only when needed (not every tick).
-
OnTimer() runs lightweight updates for Bid line only.
-
Fully optimized for all symbols and timeframes.
-
Automatically cleans objects on deinitialization.
Ritz EQUILIBRIUM MATRIX™ is not a signal generator — it’s a visual intelligence system.
It helps traders recognize fair value areas, avoid emotional entries,
and read market structure rhythm with clarity, precision, and style.