K Channel

K_Channel is a technical indicator defining the current Forex market status - trend or flat.

The indicator works on any timeframe. H1 and higher timeframes are recommended though to minimize false signals.

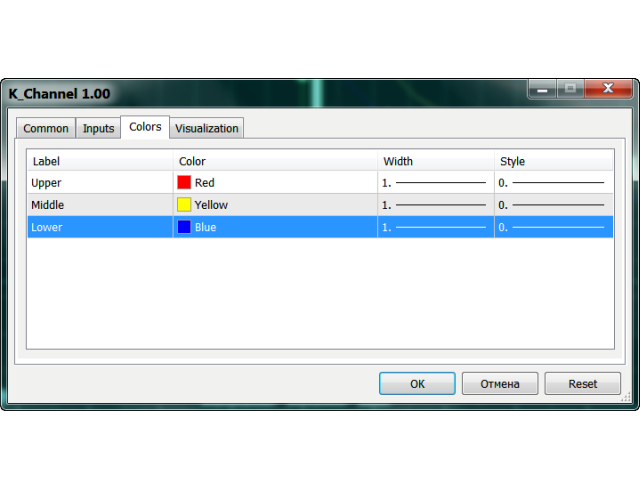
The indicator is displayed as lines above and below EMA. Average True Range (ATR) is used as bands' width.

Therefore, the channel is based on volatility. This version allows you to change all the parameters of the main Moving Average.

Unlike Bollinger Bands that applies the standard deviation value, К_Channel uses maximum and minimum prices within a period.

K_Channel indicator is calculated by the following formula:

Upper Level = EMA13 (Typical Price) + EMA13 (Trading Range)

Lower Level = EMA13 (Typical Price) - EMA13 (Trading Range),

Trading Range = max(high(t), low(t))- min(high(t), low(t)), where

high(t) - highest price of the current period,

low(t) - lowest price of the current period.
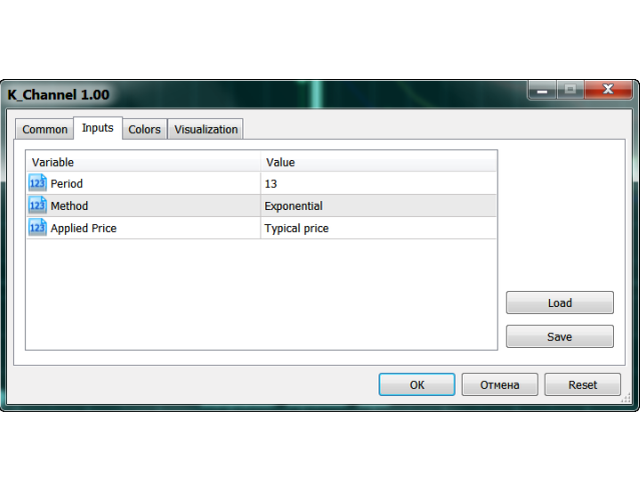

Parameters

  • period - number of bars used for the indicator calculations;
  • method - select from the four Moving Averages;
  • apply to - select from the seven applied price types.
Prodotti consigliati
- Real price is 80$ - 50% Discount (It is 39$ now) -   It is enabled for 1 purchase. Contact me for extra bonus (Gann Trend indicator), instruction or any questions! - Non-repaint, No lag - I just sell my products in Elif Kaya Profile, any other websites are stolen old versions, So no any new updates or support. - Lifetime update free Gann Gold EA MT5 Introduction W.D. Gann’s theories in technical analysis have fascinated traders for decades. It offers a unique approach beyond traditional chart
Market Trend Indicator Analog Copyright 2025, Jose María Molina Sánchez molinatrader67@gmail.com | Versione 1.00 Introduzione Il Market Trend Indicator Analog è un indicatore avanzato progettato per misurare la forza e la direzione della tendenza di mercato in tempo reale. A differenza degli oscillatori tradizionali, questo indicatore utilizza un sistema di filtraggio adattivo che risponde dinamicamente alle condizioni di mercato, fornendo una rappresentazione analoga precisa tra -100
KDJ Index 4   交易实用必备工具指标 波浪自动计算指标,通道趋势交易 完美的趋势-波浪自动计算通道计算 , MT4版本 完美的趋势-波浪自动计算通道计算 , MT5版本 本地跟单复制交易 Easy And Fast Copy , MT4版本 Easy And Fast Copy , MT5版本 本地跟单复制交易 模拟试用 Easy And Fast Copy , MT4 模拟账号运行 Easy And Fast Copy , MT5 模拟账号运行 "Cooperative QQ:556024  "  "Cooperation wechat:556024"  "Cooperative email:556024@qq.com" 强烈推荐趋势指标, 波浪的标准自动计算   和   波浪的标准自动计算MT5版本     KDJ指标又叫 随机指标 ,是一种相当新颖、实用的技术分析指标,它起先用于期货市场的分析,后被广泛用于股市的中短期趋势分析,是期货和股票市场上最常用的技术分析工具。 随机指标KDJ一般是用于股票分析的统计体系,根据统计学原理,通过一个特定的周期(常为9日、9周等)
Fibonacci Moving Average by Quant Atlas Fibonacci Moving Average is a visual trend structure indicator built around a layered Fibonacci based moving average framework. The indicator plots two dynamic average lines directly on the price chart, creating a clean view of how price behaves relative to broader trend structure. The lines automatically change color depending on the position of price, making market direction easier to read at a glance. Visual Logic • Blue line state: price is trading abo
Liquidity Touch Zones PRO X - is   a support and resistance indicator that identifies   price areas of confirmed strength   formed by repeated price interactions and displayed taking into account the instrument's characteristic volatility. The calculation is based on fractal points, which serve as initial benchmarks. These points form price zones reflecting repeated price interactions and are represented as areas of varying heights depending on the level's significance. It is designed for trader
LBR Oscillator
Pablo Filipe Soares De Almeida
LBR Oscillator – 3/10 Oscillator L’LBR Oscillator è una versione migliorata del classico 3/10 Oscillator, ampiamente utilizzato e reso popolare dalla trader professionista Linda Raschke. Questo indicatore è stato sviluppato seguendo la configurazione standard originale utilizzata da Linda Raschke, con medie mobili a 3 e 10 periodi e una linea di segnale a 16 periodi, focalizzato sulla lettura del momentum e sui cambiamenti del ritmo di mercato. Base concettuale – Come Linda Raschke utilizza il 3
Smoothed Heiken Ashi Plus
Daniel Ortega Clemente
5 (1)
Overview: This technical indicator applies a double smoothing algorithm to the standard Heiken Ashi calculation. It is designed to filter market noise and visualize the market structure clearly without the lag associated with standard moving averages. The tool allows the user to select different Moving Average types, including Hull Moving Average (HMA) and Linear Weighted Moving Average (LWMA) , to calculate the open, high, low, and close prices of the candles. Key Features: Double Smoothing En
FREE
Questo è un indicatore MTF dei livelli di supporto e resistenza basato sugli   estremi dell'indicatore Advanced ZigZag Dynamic   e/o   Extended Fractals   con etichette dei prezzi (può essere disabilitato). È possibile selezionare TF più alti per la modalità MTF. Per impostazione predefinita, i livelli vengono generati in base ai punti indicatori ZigZag. I punti indicatori frattali possono essere utilizzati anche insieme a ZigZag o al suo posto. Per semplificare l'uso e risparmiare tempo di CPU,
ZLMA Trend Candles indicator uses an enhanced Zero-Lag Moving Average to highlight key trend shifts, repainting candles in real time. It reacts faster than traditional moving averages, helping you spot potential market turns earlier. Gain clear entry and exit signals and filter out market noise with ease! This product is also available for MetaTrader 4 =>  https://www.mql5.com/en/market/product/129279 1. What Is ZLMA Trend Candles? ZLMA Trend Candles is a MetaTrader 4/5 indicator based on the Z
Price Magnet — Price Density and Attraction Levels Indicator Price Magnet is a professional analytical tool designed to identify key support and resistance levels based on statistical Price Density. The indicator analyzes a specified historical period and detects price levels where the market spent the most time. These zones act as “magnets,” attracting price action or forming a structural base for potential reversals. Unlike traditional Volume Profile tools, Price Magnet focuses on price-time d
Pyjama Chart
Karim Abdelwahab
Pyjama Chart is a comprehensive technical analysis toolkit for MetaTrader 5, designed to automatically map key historical price structures and key zones on your chart. This professional utility automates the manual charting process for several advanced price-action concepts. It dynamically detects and renders structure points, trend continuation markers, supply/demand imbalances, volatility-based zones, and areas of potential liquidity, providing a complete structural blueprint of the market at
CosmiCLab SMC FIBO CosmiCLab SMC FIBO is a professional trading indicator designed for traders who use Smart Money Concepts (SMC), market structure analysis and Fibonacci retracement levels. The indicator automatically detects market swings and builds Fibonacci levels based on the latest impulse movement. It also identifies market structure changes such as BOS (Break of Structure) and CHOCH (Change of Character), helping traders understand the current market direction. CosmiCLab SMC FIBO also pr
Ichimoku Aiko MTF
Michael Jonah Randriamampionontsoa
Ichimoku Aiko MTF is a collection of technical indicators that show support and resistance levels, as well as momentum and trend direction. It is a multi-timeframe indicator so you don't need to change the chart timeframe when you want to see the ichimoku clouds on a higher timeframe.  eg. The chart timeframe is M15 and you want to see on the M15 timeframe chart the H1 ichimoku indicators (the ichimoku in Metatrader can't do that) that's why you need to use Ichimoku Aiko MTF.
Market Overview MT5
Mehran Sepah Mansoor
Ottimizzate le vostre decisioni di trading con il nostro indicatore di forza e sentimento del mercato e non fate più trading controcorrente! Meticolosamente progettato per i trader seri che apprezzano informazioni accurate e tempestive, il nostro indicatore fornisce una visione a volo d'uccello delle 28 coppie principali in modo molto semplice. Questo strumento è in grado di classificare le coppie di valute in base alla popolarità, alla forza del trend rialzista o ribassista e alla percentuale
Swing Tracer
Ely Alsedy
5 (1)
it depends on ATR period to get swing points to help make better trading decisions  blue dot and red dot is the default color scheme of course you can change it later if you'd like  you can change the following : ATR PERIOD  sending notifications number of times to send notifications  sending notifications to your smart phone that's it very simple to use just drag and drop and follow the trend 
This indicator combine DOW theory with Fibonancy level to determine the structure of financial markets. It include resistance determine to provide an overview of the market. The Dow Theory is an approach to trading developed by Charles H. Dow, who, with Edward Jones and Charles Bergstresser, founded Dow Jones & Company, Inc. and developed the Dow Jones Industrial Average in 1896. In summarize, DOW theory is: + Technical framework that predicts the market is in an upward trend if one of its aver
Auto Optimized RSI   è un indicatore a freccia intelligente e facile da usare, progettato per fornire segnali di acquisto e vendita precisi. Utilizza simulazioni di trading su dati storici per individuare automaticamente i livelli RSI più efficaci per ogni strumento e timeframe. Questo indicatore può essere utilizzato come sistema di trading autonomo o integrato nella tua strategia esistente, ed è particolarmente utile per i trader a breve termine. A differenza dei livelli fissi tradizionali del
Trend Follower LukaHo
Lukasz Mariusz Holla
TrendFollower (The Swiss Army Knife for Trends) Forget standard indicators. Discover TrendFollower – 5 strategies in one! Tired of indicators that show a buy signal when the market is long past its peak? Your moving averages are so laggy that they show last Tuesday's trend? Let's get this straightened out. I present to you TrendFollower – a powerful, modular framework (Institution-Grade) that analyzes market structure from five different perspectives. Whether you're a patient sw
Visual Dolphin Indicator
AL MOOSAWI ABDULLAH JAFFER BAQER
Visual Dolphin Indicator Unlock the rhythm of the market with the Visual Dolphin Indicator, your ultimate tool for identifying and capitalizing on market trends with clarity and confidence. Designed for both novice and experienced traders, this indicator eliminates the noise and guesswork, providing crystal-clear buy and sell signals directly on your chart. The Logic Behind the Waves The core of the Visual Dolphin Indicator is a sophisticated yet intuitive dual-wave system based on moving avera
Il livello Premium è un indicatore unico con una precisione superiore all'80% delle previsioni corrette! Questo indicatore è stato testato dai migliori Specialisti di Trading per più di due mesi! L'indicatore dell'autore che non troverai da nessun'altra parte! Dagli screenshot puoi vedere di persona la precisione di questo strumento! 1 è ottimo per il trading di opzioni binarie con un tempo di scadenza di 1 candela. 2 funziona su tutte le coppie di valute, azioni, materie prime, criptovalu
Features All Ichimoku Signals (Selectable) : Display all reliable signals generated by the Ichimoku indicator. You can choose which signals to view based on your preferences. Filter by Signal Strength : Sort signals by their strength—whether they are weak, neutral, or strong. Live Notifications : Receive real-time notifications for Ichimoku signals. Transparent Cloud : Visualize the Ichimoku cloud in a transparent manner. Available Signals Tenkensen-Kijunsen Cross Price-Kijunsen Cross Price-C
InfinX Slope MT5
Stanislav Shtiliyanov
The Slope indicator   measures the slope of a linear regression , which is the line of best fit for a data series. A 20-period Slope, therefore, measures the slope of a 20-day linear regression. ... In general, a positive slope indicates an uptrend, while a negative slope indicates a downtrend. How do you use slope Indicator? By applying the slope indicator  to both the price chart and the price relative , chartists can quantify the price trend and relative performance with one indicator. A pos
Koryu Delta Koryu Delta è un indicatore MetaTrader 5. Identifica i punti di inversione di tendenza utilizzando l'analisi dei punti pivot e i dati del volume delta. Rileva i pattern di Market Shift e mostra segnali basati sulle dinamiche di mercato. Questo strumento può essere utilizzato dai trader che fanno scalping, swing trading o investimenti a lungo termine. Analizza fino a 500 barre storiche per individuare pattern passati. Utilizza la logica a barre chiuse per i segnali. Caratteristiche d
FREE
The Predicting Donchian Channel MT5 indicator allows predicting the future changes in the levels of the Donchian channel based on the channel position of the price. The standard ZigZag indicator starts drawing its ray in 99% of the time the opposite Donchian channel is touched. The forecast of the channel boundary levels will help in finding the points, where the correction ends or the trend changes, an also to estimate how soon those events can occur. Configurations Period - Donchian channel c
All about time and price by ICT. This indicator provides a comprehensive view of ICT killzones, Silver Bullet times, and ICT Macros, enhancing your trading experience.  In those time windows price either seeks liquidity or imbalances and you often find the most energetic price moves and turning points. Features: Automatic Adaptation: The ICT killzones intelligently adapt to the specific chart you are using. For Forex charts, it follows the ICT Forex times: In EST timezone: Session: Asia: 20h00-0
Elliott Wave Oscillator Pro for MetaTrader 5 Elliott Wave Oscillator Pro is a precision momentum analysis tool designed to help traders visualize wave structure, trend strength, and market rhythm in real time. By calculating the difference between fast and slow moving averages, the oscillator reveals the internal energy of price movement, allowing traders to better anticipate shifts in momentum and potential wave transitions. This indicator transforms complex Elliott-based momentum behavior into
Volume Profile Canvas - Professional Volume Profile Indicator for MetaTrader 5 DESCRIPTION Volume Profile Canvas is a professional volume profile indicator for MetaTrader 5 that renders directly on the chart using a high-performance Canvas engine. It calculates and displays the volume distribution across price levels, identifying the Point of Control (POC), Value Area High (VAH) and Value Area Low (VAL) in real time. This is a pure analysis tool. It does not trade. It gives you an instant vi
Fit line supports to extrapolation next movement of market, support for buy/sell decision. Indicator using spline algorithm to extrapolation.  You can change number of spline with parameter "PointsNumber" and number of extrapolation point with "ExtrapolateBars". Eextrapolation points will be save into csv format, with prefix in parameter "PointsPrefix", and store in folder File of Data Folder.
This indicator automatically identifies liquidity levels using swing fractals and tracks when price sweeps through them. Works on any symbol and timeframe with full multi-timeframe support. Features: — Detects swing highs and lows via a fractal method (configurable bars left & right) on a selected timeframe. Active levels are displayed as rays extending to the right; swept levels turn into dashed lines ending at the sweep candle. — Plots Previous Day (PDhigh / PDlow), Previous Week (PWhigh / PWl
FREE
Trend Master V2
Oratile Pitsoane
What Is Trend Master Pro? Trend Master Pro   is a professional-grade trend trading indicator built for MetaTrader 5. It was designed with one goal in mind — to keep you on the right side of the market at all times by combining three powerful technical tools into a single, clean, easy-to-read display directly on your price chart. Instead of cluttering your screen with multiple separate indicators, Trend Master Pro fuses an   EMA Ribbon trend filter , a   ZigZag swing point engine , and a   breako
Gli utenti di questo prodotto hanno anche acquistato
Neuro Poseidon MT5
Daria Rezueva
4.84 (51)
Neuro Poseidon is a new indicator by Daria Rezueva. It combines precise trading signals with adaptive TP/SL levels - creating best possible trades as a result! Message me and get  Neuro Poseidon Assistant  as a gift to automize your trading process! What makes it stand out? 1. Proven profitability on all assets and timeframes 2. Only confirmed BUY and SELL signals present on the chart 3. Adaptive TP & SL levels generated by the software for each trade 4. Easy to understand - suitable for al
SuperScalp Pro
Van Minh Nguyen
4.68 (28)
SuperScalp Pro –  Sistema Professionale di Scalping con Confluenza Multilivello SuperScalp Pro è un sistema di trading professionale a confluence multi-livello progettato per identificare opportunità di trading ad alta probabilità attraverso una conferma intelligente multi-fattoriale. Integrando Supertrend, VWAP, EMA, RSI, ADX, analisi dei volumi, Bande di Bollinger e divergenza MACD, il sistema filtra le configurazioni di bassa qualità, riduce i falsi segnali di breakout e migliora la precision
Cominciamo con la verità. Nessun indicatore da solo ti renderà profittevole. Se qualcuno ti dice il contrario, ti sta vendendo un sogno. Qualsiasi indicatore che mostra frecce perfette di acquisto/vendita può essere reso impeccabile — basta ingrandire la giusta sezione della storia e catturare solo i trade vincenti. Noi non lo facciamo.  SMC Intraday Formula è uno strumento. Legge la struttura del mercato per te, identifica le zone a più alta probabilità e ti mostra esattamente come appare la t
Divergence Bomber
Ihor Otkydach
4.9 (92)
Ogni acquirente dell’indicatore riceverà inoltre gratuitamente: L’utilità esclusiva “Bomber Utility”, che gestisce automaticamente ogni operazione, imposta i livelli di Stop Loss e Take Profit e chiude le posizioni secondo le regole della strategia I file di configurazione (set file) per adattare l’indicatore a diversi asset I set file per configurare il Bomber Utility in tre modalità: “Rischio Minimo”, “Rischio Bilanciato” e “Strategia di Attesa” Una guida video passo-passo per installare, conf
Entry In The Zone and SMC Multi Timeframe is a real-time 2-in-1 market analysis tool that combines market structure analysis and a No Repaint BUY / SELL signal system into a single indicator, built on Smart Money Concepts (SMC) — a widely adopted framework used by professional traders to understand market structure. This indicator helps you see the market more clearly, make decisions based on structure rather than guesswork, and focus on high-probability zones where price is more likely to react
M1 Quantum MT5
Hamed Dehgani
5 (5)
Nota dello sviluppatore: Rimane solo 2   licenza al prezzo di 149 $ . Dopo la sua vendita, il prezzo aumenterà a 169 $ . M1 Quantum è un sistema di trading p rofessionale per M1 che fornisce segnali di trading rapidi e precisi con Stop Loss, Take Profit e gestione intelligente del capitale integrati. M1 Quantum include un sistema professionale di gestione del capitale progettato per far crescere rapidamente il conto concentrandosi su vittorie consecutive . Caratteristiche principali dell' Indic
Gann Made Easy è un sistema di trading Forex professionale e facile da usare che si basa sui migliori principi del trading utilizzando la teoria di mr. WD Gann. L'indicatore fornisce segnali ACQUISTA e VENDI accurati, inclusi i livelli di Stop Loss e Take Profit. Puoi fare trading anche in movimento utilizzando le notifiche PUSH. CONTATTAMI DOPO L'ACQUISTO PER RICEVERE GRATUITAMENTE LE ISTRUZIONI DI TRADING E OTTIMI INDICATORI EXTRA! Probabilmente hai già sentito parlare molte volte dei metodi d
Power Candles MT5
Daniel Stein
5 (8)
Power Candles V3 - Indicatore di forza ad ottimizzazione automatica Power Candles V3 trasforma la forza delle valute e degli strumenti in un piano di trading attuabile su ogni grafico a cui è collegato. Invece di limitarsi a colorare le candele, esegue un'auto-ottimizzazione in tempo reale in background e ti fornisce i migliori valori di Stop Loss, Take Profit e soglia di segnale per il simbolo che hai davanti. Basta un clic per adottarlo nel trading live: i raggi di ingresso, Stop Loss e Take P
PrimeScalping
Temirlan Kdyrkhan
PrimeScalping is a powerful trading companion designed to generate high-probability entry signals with dynamic TP/SL/DP levels based on volatility. Built-in performance tracking shows win/loss stats, PP1/PP2 hits, and success rates — all updated live. Key Features: Buy/Sell signals with adaptive volatility bands Real-time TP/SL/DP levels based on ATR Built-in MA Filter with optional ATR/StdDev volatility Performance stats panel (Success, Profit/Loss, PP1/PP2) Alerts via popup, sound, push, or e
Questo prodotto è stato aggiornato per il mercato 2026 e ottimizzato per le ultime build di MT5. AVVISO DI AGGIORNAMENTO PREZZO: Smart Trend Trading System è attualmente disponibile a $99 . Il prezzo aumenterà a $199 dopo i prossimi 30 acquisti . OFFERTA SPECIALE: Dopo aver acquistato Smart Trend Trading System, inviami un messaggio privato per ricevere Smart Universal EA GRATIS e trasformare i tuoi segnali Smart Trend in operazioni automatiche. Smart Trend Trading System è un sistema di tradin
Trend Catcher ind mt5
Ramil Minniakhmetov
5 (7)
INDICATORE TREND CATCHER L'indicatore Trend Catcher analizza i movimenti dei prezzi di mercato, utilizzando una combinazione di indicatori di analisi del trend proprietari dell'autore e personalizzati. Identifica la vera direzione del mercato filtrando il rumore a breve termine e concentrandosi sulla forza del momentum sottostante, sull'espansione della volatilità e sul comportamento della struttura dei prezzi. Utilizza inoltre una combinazione di indicatori personalizzati di smoothing e filtr
Presentazione       Quantum Breakout PRO   , l'innovativo indicatore MQL5 che sta trasformando il modo in cui scambi le zone di breakout! Sviluppato da un team di trader esperti con un'esperienza di trading di oltre 13 anni,       Quantum Breakout PRO       è progettato per spingere il tuo viaggio di trading a nuovi livelli con la sua strategia innovativa e dinamica della zona di breakout. Quantum Breakout Indicator ti fornirà frecce di segnalazione sulle zone di breakout con 5 zone target di
L'indicatore UZFX {SSS} Scalping Smart Signals v4.0 MT5 è un indicatore di trading ad alte prestazioni che non subisce ripaint, progettato per scalper, day trader e swing trader che necessitano di segnali accurati e in tempo reale in mercati in rapida evoluzione. Sviluppato da (UZFX-LABS), questo indicatore combina l’analisi dell’azione dei prezzi, la conferma del trend e il filtraggio intelligente per generare segnali di acquisto e vendita ad alta probabilità, segnali di allerta e opportunità d
Trend Sniper X
Sarvarbek Abduvoxobov
5 (2)
Trend Sniper X — Panoramica Trend Sniper X è un indicatore di bdf-tendenza multi-timeframe per MetaTrader 5 basato su un motore HTF SuperTrend combinato con un filtro EMA. Ricolora le candele del timeframe corrente in base alla direzione del trend del timeframe superiore e contrassegna i punti di inversione del trend con frecce BUY/SELL. Informazioni sul Prezzo: Il prezzo attuale è promozionale ed è soggetto a modifiche con il rilascio dei prossimi aggiornamenti e delle nuove funzionalità. Canal
Atomic Analyst MT5
Issam Kassas
4.3 (37)
Questo prodotto è stato aggiornato per il mercato 2026 e ottimizzato per le ultime build di MT5. AVVISO DI AGGIORNAMENTO PREZZO: Atomic Analyst è attualmente disponibile a $99 . Il prezzo aumenterà a $199 dopo i prossimi 30 acquisti . OFFERTA SPECIALE: Dopo aver acquistato Atomic Analyst, inviami un messaggio privato per ricevere Smart Universal EA GRATIS e trasformare i tuoi segnali Atomic Analyst in operazioni automatiche. Atomic Analyst è un indicatore di trading Price Action non-repainting
L’indicatore evidenzia le zone in cui viene dichiarato interesse sul mercato , per poi mostrare la zona di accumulo degli ordini . Funziona come un book degli ordini su larga scala . Questo è l’indicatore per i grandi capitali . Le sue prestazioni sono eccezionali. Qualsiasi interesse ci sia nel mercato, lo vedrai chiaramente . (Questa è una versione completamente riscritta e automatizzata – non è più necessaria un’analisi manuale.) La velocità di transazione è un indicatore concettualmente nuo
Quantum TrendPulse
Bogdan Ion Puscasu
5 (25)
Ecco   Quantum TrendPulse   , lo strumento di trading definitivo che combina la potenza di   SuperTrend   ,   RSI   e   Stocastico   in un unico indicatore completo per massimizzare il tuo potenziale di trading. Progettato per i trader che cercano precisione ed efficienza, questo indicatore ti aiuta a identificare con sicurezza le tendenze di mercato, i cambiamenti di momentum e i punti di entrata e uscita ottimali. Caratteristiche principali: Integrazione SuperTrend:   segui facilmente l'andame
Crystal Heikin Ashi Signals
Muhammad Jawad Shabir
5 (2)
Crystal Heikin Ashi Signals - Professional Trend & Signal Detection Indicator Advanced Heikin Ashi Visualization with Intelligent Signal System for Manual & Automated Trading Final Price: $149 ---------> Price goes up $10 after every 10 sales . Limited slots available — act fast . Overview Crystal Heikin Ashi Signals is a professional-grade MetaTrader 5 indicator that combines pure Heikin Ashi candle visualization with an advanced momentum-shift detection system. Designed for both manual traders
Gem SIGNAL
Shengzu Zhong
5 (1)
GEM Signal Pro GEM Signal Pro è un indicatore trend-following per MetaTrader 5, progettato per i trader che desiderano segnali più chiari, configurazioni operative più strutturate e una gestione del rischio più pratica direttamente sul grafico. Invece di mostrare solo una semplice freccia, GEM Signal Pro aiuta a presentare l’intera idea di trading in modo più chiaro e leggibile. Quando le condizioni sono confermate, l’indicatore può mostrare sul grafico il prezzo di ingresso, lo stop loss e gli
ARIPoint
Temirlan Kdyrkhan
1 (1)
ARIPoint is a powerful trading companion designed to generate high-probability entry signals with dynamic TP/SL/DP levels based on volatility. Built-in performance tracking shows win/loss stats, PP1/PP2 hits, and success rates all updated live. Key Features: Buy/Sell signals with adaptive volatility bands Real-time TP/SL/DP levels based on ATR Built-in MA Filter with optional ATR/StdDev volatility Performance stats panel (Success, Profit/Loss, PP1/PP2) Alerts via popup, sound, push, or email Cu
FX Trend MT5 NG
Daniel Stein
5 (6)
FX Trend NG: La Nuova Generazione di Intelligenza di Trend Multi-Mercato Panoramica FX Trend NG è uno strumento professionale di analisi del trend multi-timeframe e monitoraggio dei mercati. Ti consente di comprendere la struttura completa del mercato in pochi secondi. Invece di passare tra numerosi grafici, puoi identificare immediatamente quali strumenti sono in trend, dove il momentum sta diminuendo e dove esiste un forte allineamento tra i timeframe. Offerta di Lancio – Ottieni FX Trend NG
GoldenX Entry MT5
Kareem Abbas
5 (13)
GoldenX Entry è un indicatore per MT5 con un algoritmo adattivo Smart Entry Trend, un sistema di scoring dei segnali, un rilevatore del regime di mercato e un filtro di volatilità. Ogni segnale include un livello di ingresso calcolato, tre livelli di Take-Profit (TP1, TP2, TP3) e un livello di Stop-Loss. È costruito su più livelli analitici progettati per adattarsi a diverse condizioni di mercato, combinando un sistema analitico multilivello con un ottimizzatore integrato e un sistema di traccia
The Oracle Pro
Ottaviano De Cicco
The Oracle Pro: Synthetic Multi-Timeframe Bias Engine for MT5 ️ Summer Launch Offer — Get The Oracle Pro for USD 199 (early buyers). Price rises with traction; final price USD 399. The Oracle Pro is a premium multi-timeframe bias engine for MetaTrader 5, built for demanding and professional traders. It answers one question with discipline: what is the directional bias on each timeframe right now, how strong is it, and how much do the timeframes agree? Everything is computed on closed bars only
FX Power MT5 NG
Daniel Stein
5 (33)
FX Power: Analizza la Forza delle Valute per Decisioni di Trading Più Intelligenti Panoramica FX Power è lo strumento essenziale per comprendere la reale forza delle principali valute e dell'oro in qualsiasi condizione di mercato. Identificando le valute forti da comprare e quelle deboli da vendere, FX Power semplifica le decisioni di trading e rivela opportunità ad alta probabilità. Che tu segua le tendenze o anticipi inversioni utilizzando valori estremi di Delta, questo strumento si adatta
AXIOM MATRIX MT5 PREZZO DI LANCIO: $99 Axiom Matrix è disponibile al prezzo di lancio di $99. Il prezzo aumenterà a $199 dopo i primi 30 acquisti. Axiom Matrix è uno scanner di mercato professionale multi-simbolo e multi-timeframe, oltre a un pannello decisionale per MetaTrader 5. Scansiona il tuo Market Watch, analizza più timeframe, legge più motori di evidenza, confronta le opportunità più forti e ti mostra la migliore condizione BUY, SELL, WAIT o bloccata all’interno di un’unica dashboard a
Gold Stuff mt5
Vasiliy Strukov
4.9 (192)
Gold Stuff mt5 è un indicatore di tendenza progettato specificamente per l'oro e può essere utilizzato anche su qualsiasi strumento finanziario. L'indicatore non ridisegna e non è in ritardo. Periodo consigliato H1. Contattami subito dopo l'acquisto per avere le impostazioni e un bonus personale!   I risultati in tempo reale possono essere visualizzati qui.  Puoi ottenere una copia gratuita del nostro indicatore Strong Support e Trend Scanner, per favore scrivi in ​​privato.    IMPOSTAZIONI
Quant Direction MT5
Georgios Kalomoiropoulos
Quant Direction è uno strumento di analisi di mercato 3D. Offre un'analisi di mercato perfettamente oggettiva, basata su algoritmi, calcolando con precisione le deviazioni percentuali su diversi parametri. Sviluppato utilizzando strumenti di modellazione avanzati basati sull'intelligenza artificiale e rigorosamente testato, questo algoritmo analizza il mercato con una precisione senza pari. È possibile analizzare qualsiasi coppia di valute o strumento finanziario sulla piattaforma. Che si pratic
ScalpPoint
Temirlan Kdyrkhan
ScalpPoint is a powerful trading companion designed to generate high-probability entry signals with dynamic TP/SL/DP levels based on volatility. Built-in performance tracking shows win/loss stats, PP1/PP2 hits, and success rates — all updated live. Key Features: Buy/Sell signals with adaptive volatility bands Real-time TP/SL/DP levels based on ATR Built-in MA Filter with optional ATR/StdDev volatility Performance stats panel (Success, Profit/Loss, PP1/PP2) Alerts via popup, sound, push, or emai
SmartScalping
Temirlan Kdyrkhan
SmartScalping is a powerful trading companion designed to generate high-probability entry signals with dynamic TP/SL/DP levels based on volatility. Built-in performance tracking shows win/loss stats, PP1/PP2 hits, and success rates — all updated live. Key Features: Buy/Sell signals with adaptive volatility bands Real-time TP/SL/DP levels based on ATR Built-in MA Filter with optional ATR/StdDev volatility Performance stats panel (Success, Profit/Loss, PP1/PP2) Alerts via popup, sound, push, or e
Btmm state engine pro
Garry James Goodchild
5 (5)
BTMM State Engine Pro is a MetaTrader 5 indicator for traders who use the Beat The Market Maker approach: Asian session context, kill zone timing, level progression, peak formation detection, and a multi-pair scanner from a single chart. It combines cycle state logic with a built-in scanner dashboard so you do not need the same tool on many charts at once. What it does Draws the Asian session range; session times can follow broker server offset or be set in inputs. Tracks level progression (L
Altri dall’autore
Unda
Pavel Gotkevitch
The Unda indicator determines the trend direction and strength, as well as signals about trend changes. The indicator uses price extremums for the previous periods and calculates the ratio between the current price and extremums. Therefore, the only parameter is Period (default = 13), which sets the number of bars to determine extremums. The higher the Period, the less the number of signals about trend changes, but the greater the indicator delay. Uptrends are shown by blue color of the indicato
DeMarker Mod
Pavel Gotkevitch
4 (2)
В стандартном индикаторе DeMarker используется простая скользящая средняя - Simple Moving Average, что несколько ограничивает возможности этого индикатора. В представленном индикаторе DeMarker Mod добавлен выбор из четырех скользящих средних - Simple, Exponential, Smoothed, Linear weighted, что позволяет существенно расширить возможности данного индикатора.   Параметры стандартного индикатора DeMarker: ·         period  - количество баров, используемых для расчета индикатора;   Параметры индикат
FREE
Bulls Power Mod
Pavel Gotkevitch
3 (1)
Only Exponential Moving Average at Close Price is used in standard Bulls Power limiting the possibilities of that indicator to some extent. Bulls Power Mod enables you to select from four Moving Averages and seven applied prices, thus greatly expanding the indicator's functionality.
FREE
MAPC
Pavel Gotkevitch
3 (1)
MAPC (Moving Average Percent's Change) shows the Moving Average's percent change from one period to another selected period allowing you to track the smoothed price change rate. MAPC is calculated according to the following equation: MAPC[i] = 100 * (MA[i] - MA[i - n]) / MA[i],  where: MA[i] - current Moving Average value;   MA[i - n] - value of the Moving Average that is n periods away from the current Moving Average value. Input Parameters Period - Moving Average period; Method - smoothing me
FREE
Bears Power Mod
Pavel Gotkevitch
3 (1)
Only Exponential Moving Average at Close Price is used in standard Bears Power limiting the possibilities of that indicator to some extent. Bears Power Mod enables you to select from four Moving Averages and seven applied prices, thus greatly expanding the indicator's functionality.
FREE
Support & Resistance indicator is a modification of the standard Bill Williams' Fractals indicator. The indicator works on any timeframes. It displays support and resistance levels on the chart and allows setting stop loss and take profit levels (you can check the exact value by putting the mouse cursor over the level). Blue dashed lines are support level. Red dashed lines are resistance levels. If you want, you can change the style and color of these lines. If the price approaches a support lev
MA Crossing
Pavel Gotkevitch
MA Crossing displays two moving averages on the chart painting their crossing points in different colors - blue (buy) and red (sell). The indicator clearly defines the trend direction and power and simplifies the perception of market signals. The indicator may be useful in the strategies involving two moving averages' crossing method. The indicator's input parameters allow you to select the following settings for each moving average: period (Fast Period, Slow Period); smoothing period (Simple, E
Vates
Pavel Gotkevitch
4.2 (5)
Vates is a Latin word meaning a prophet. Vates is a multicurrency trend Expert Advisor that can run on any type real accounts, on any timeframe, with any initial deposit, with a fixed or varying lot size, with four and five-digit quotes, with brokers offering different order filling types. A distinctive feature of the EA is its stability and reliability. The results of Expert Advisor testing in the Strategy Tester in four modes (two main modes – normal and with a delay, and two additional modes
Grab
Pavel Gotkevitch
The Grab indicator combines the features of both trend indicators and oscillators. This indicator is a convenient tool for detecting short-term market cycles and identifying overbought and oversold levels. A long position can be opened when the indicator starts leaving the oversold area and breaks the zero level from below. A short position can be opened when the indicator starts leaving the overbought area and breaks the zero level from above. An opposite signal of the indicator can be used for
CCI Modified
Pavel Gotkevitch
The standard Commodity Channel Index (CCI) indicator uses a Simple Moving Average, which somewhat limits capabilities of this indicator. The presented CCI Modified indicator features a selection of four moving averages - Simple, Exponential, Smoothed, Linear weighted, which allows to significantly extend the capabilities of this indicator. Parameter of the standard Commodity Channel Index (CCI) indicator period - the number of bars used for the indicator calculations; apply to - selection from
D Channel
Pavel Gotkevitch
D-Channel is a technical indicator defining the current Forex market status - trend or flat. The indicator is based on DEMA (Double Exponential Moving Average). The advantage of DEMA is that it eliminates false signals at the saw-toothed price movement and allows saving a position at a strong trend. The indicator can work on any timeframe, though H1 and higher timeframes are recommended to minimize false signals. The indicator displays a channel as lines located above and below the average line.
Stips
Pavel Gotkevitch
Stips is a histogram indicator that determines trend direction and strength, as well as trend changes. The indicator can be used as a normal oscillator, i.e. analyze its trend change signals (crossing the zero line), as well as divergence and exit from overbought and oversold zones. The indicator uses extreme prices of previous periods and calculates the ratio between the current price and extreme values. Therefore its only parameter is Period (default is 13), which sets the number of bars to de
F Channel
Pavel Gotkevitch
F-Channel is a technical indicator defining the current Forex market status - trend or flat. The indicator is based on FRAMA (Fractal Adaptive Moving Average). The FRAMA follows strong trend movements and slows down significantly during price consolidation. The indicator is able to work on any timeframes, but H1 and higher timeframes are recommended to minimize false signals. The indicator displays a channel as lines located above and below the middle line. The upper and lower lines can serve as
Labor
Pavel Gotkevitch
Labor is a technical analysis indicator defining trend direction and power, as well as signaling a trend change. The indicator is based on a modified EMA (Exponential Moving Average) with an additional smoothing filter. The indicator works on any timeframe. The uptrend is shown as a blue line, while a downtrend - as a red one. Close a short position and open a long one if the line color changes from red to blue. Close a long position and open a short one if the line color changes from blue to re
P Channel
Pavel Gotkevitch
P-Channel is a technical indicator determining the current Forex market status - trend or flat. The indicator is able to work on any timeframes, but H1 and higher timeframes are recommended to minimize false signals. The indicator displays a channel as lines located above and below the middle line. The upper and lower lines can serve as the resistance and support levels. Sell when the price reaches the upper line, and buy when the price reaches the lower line. It is recommended to use a small st
FRAMA Crossing
Pavel Gotkevitch
The FRAMA Crossing indicator displays on a chart two FRAMAs (Fractal Adaptive Moving Average) and paints their crossing areas in different colors – blue (buy) and red (sell). FRAMA follows strong trend movements and slows down significantly during price consolidation. The indicator clearly defines the trend direction and power and simplifies the perception of market signals. The indicator can work on any timeframes may be useful in the strategies involving two moving averages' crossing method. T
CCI Crossing
Pavel Gotkevitch
The CCI Crossing indicator displays the intersection of two CCI (Commodity Channel Index) indicators - fast and slow - in a separate window. The intersection area is filled in blue, when the fast CCI is above the slow CCI. The intersection area is filled in red, when the fast CCI is below the slow CCI. This indicator is a convenient tool for measuring the deviations of the current price from the statistically average price and identifying overbought and oversold levels. The indicator can work on
Dash
Pavel Gotkevitch
Dash is a histogram indicator, which measures the rate of price change and determines the overbought and oversold levels. The indicator uses price extremums for the previous periods and calculates the ratio between the current price and extremums. Therefore, the only parameter is Period , which sets the number of bars to determine extremums. A long position can be opened when the red lines of the indicator start leaving the oversold area and break the -1 level upwards. A short position can be op
Surge
Pavel Gotkevitch
The Surge indicator combines the features of trend indicators and oscillators. The indicator measures the rate of price change and determines the overbought and oversold market levels. The indicator can be used on all timeframes and is a convenient tool for detecting short-term market cycles. The indicator uses price extremums for the previous periods and calculates the ratio between the current price and extremums. Therefore, the only parameter is Period, which sets the number of bars to determ
DEMA Crossing
Pavel Gotkevitch
The DEMA Crossing indicator displays the intersection of two DEMA (Double Exponential Moving Average) - fast and slow. The intersection area is filled in blue, when the fast DEMA is above the slow DEMA. The intersection area is filled in red, when the fast DEMA is below the slow DEMA. The advantage of the DEMA moving average is that it eliminates false signals at the saw-toothed price movement and allows saving a position at a strong trend. The indicator clearly defines the trend direction and p
Trend Sight
Pavel Gotkevitch
The Trend Sight indicator shows the Moving Average's percent change from the current bar to the other selected bar allowing you to track the smoothed price change rate, as well as trend strength and change. The uptrend is shown as a blue indicator line, while a downtrend is displayed in red. Close a short position and open a long one if the line color changes from red to blue. Close a long position and open a short one if the line color changes from blue to red. You should use a tight stop loss,
Trend Sign
Pavel Gotkevitch
The Trend Sign indicator is a modification of the MACD indicator (Moving Average Convergence Divergence), which allows determining the direction and strength of the trend, as well as a trend change. The indicator is based on two moving averages - fast and slow, and it can work on any timeframe. Uptrends are shown by blue color of the indicator line, downtrends by the red color. Close a short position and open a long one if the line color changes from red to blue. Close a long position and open a
DEMA Trend
Pavel Gotkevitch
The DEMA Trend indicator is based on two DEMA (Double Exponential Moving Average) - fast and slow. The advantage of the DEMA moving average is that it eliminates false signals at the saw-toothed price movement and allows saving a position at a strong trend. The indicator allows determining the direction and strength of the trend, and it can work on any timeframe. Uptrends are shown by blue color of the indicator line, downtrends by the red color. Close a short position and open a long one if the
T Channel
Pavel Gotkevitch
T-Channel is a technical indicator defining the current Forex market status - trend or flat. The indicator is based on TEMA (Triple Exponential Moving Average). The advantage of the TEMA is that it provides a smaller delay than a moving average with a single or double smoothing. The indicator is able to work on any timeframes, but H1 and higher timeframes are recommended to minimize false signals. The indicator displays a channel as lines located above and below the middle line. The upper and lo
TEMA Trend
Pavel Gotkevitch
The TEMA Trend indicator is based on two TEMA (Triple Exponential Moving Average) - fast and slow. The advantage of the TEMA is that it provides a smaller delay than a moving average with a single or double smoothing. The indicator allows determining the direction and strength of the trend, and it can work on any timeframe. Uptrends are shown by blue color of the indicator line, downtrends by the red color. Close a short position and open a long one if the line color changes from red to blue. Cl
TrendDetect
Pavel Gotkevitch
The Trend Detect indicator combines the features of both trend indicators and oscillators. This indicator is a convenient tool for detecting short-term market cycles and identifying overbought and oversold levels. A long position can be opened when the indicator starts leaving the oversold area and breaks the zero level from below. A short position can be opened when the indicator starts leaving the overbought area and breaks the zero level from above. An opposite signal of the indicator can b
Trade Helper
Pavel Gotkevitch
The Trade Helper indicator is a modification of the Trade Assistant indicator (by Andriy Moraru). The Trade Helper multitimeframe indicator is a good assistant for traders, useful as a filter in most trading strategies. This indicator combines the tactics of Elder's Triple Screen in a single chart, which lies in entering a trade when the same trend is present on three adjacent timeframes. The indicator operation is based on the principle of determining the trend on the three selected timeframes
Lotus
Pavel Gotkevitch
Lotus indicator combines the features of both trend indicators and oscillators allowing you to track the smoothed price change rate, as well as trend strength and change. The uptrend is shown as a green indicator line, while a downtrend is displayed in red. A long position can be opened when the indicator breaks the zero level from below. A short position can be opened when the indicator breaks the zero level from above. An opposite signal of the indicator can be used for exiting positions. You
DEMA Cross
Pavel Gotkevitch
DEMA Cross DEMA Cross - это мультивалютный трендовый советник, работающий на реальных счетах любого типа, на любом временном интервале, с любым начальным депозитом, с постоянным или изменяющимся размером лота, с четырех- и с пятизначными котировками, а также с брокерами, использующими различный тип заливки ордеров. Отличительной особенностью советника является его стабильность и, что особенно важно, его достоверность. Результаты проверки советника в тестере стратегий в 4-х режимах (2 основных
Filtro:
Noprofit
313
Noprofit 2020.05.24 15:33 
 

L'utente non ha lasciato alcun commento sulla valutazione.

[Eliminato] 2019.11.02 18:35 
 

L'utente non ha lasciato alcun commento sulla valutazione.

[Eliminato] 2019.01.14 06:47 
 

L'utente non ha lasciato alcun commento sulla valutazione.

Gennadiy Voltornist
11909
Gennadiy Voltornist 2017.12.14 20:45 
 

L'utente non ha lasciato alcun commento sulla valutazione.

Daniel Andrejczuk
5597
Daniel Andrejczuk 2017.11.09 03:06 
 

L'utente non ha lasciato alcun commento sulla valutazione.

Nork
6187
Nork 2016.12.21 07:25 
 

L'utente non ha lasciato alcun commento sulla valutazione.

Rispondi alla recensione