Equilibrium Matrix Zone
- 지표
-
Syamsurizal Dimjati
 안녕하세요, 트레이더 여러분!
저는 2023년부터 MetaTrader 5를 위한 고품질 트레이딩 지표와 전문가용 자동매매 프로그램(EA)을 설계하고 개발하고 있습니다.
저의 목표는 트레이더들이 시장 분석 능력과 매매 전략을 향상시킬 수 있도록 신뢰할 수 있고 실용적이며 혁신적인 트레이딩 도구를 만드는 것입니다.
여러분의 피드백을 소중하게 생각합니다. 개선을 위한 제안, 아이디어 및 리뷰는 제품을 지속적으로 발전시키는 데 큰 도움이 됩니다.
**찾고 계신 특정 지표가 있으신가요?** - 버전: 1.3
- 업데이트됨: 17 11월 2026
- 활성화: 5
Ritz EQUILIBRIUM MATRIX™ ZONE
Smart Premium-Discount Equilibrium MTF System: Zones + Structure + Trend Trigger + Trade Levels Ritz EQUILIBRIUM MATRIX is built on Premium-Discount-Equilibrium (PDE) Theory: price constantly moves between Premium (expensive) and Discount (cheap) zones, while the Equilibrium Zone is fair value where buyers and sellers balance out. Version 2 turns the original visual zone map into a complete decision system. You still see where price is located. Now you also see WHY a BUY/SELL arrow appears, WHEN the market is too choppy to trade, and WHERE to place SL and TP.
--------------------------------------------------
WHAT'S NEW IN VERSION ?
1. Trend-filtered BUY/SELL arrows Supertrend logic runs internally (no trend line is drawn). Arrows appear only when the PDE zone and the trend agree: - E > P: price leaves Equilibrium toward Premium in an up-trend = BUY - E > D: price leaves Equilibrium toward Discount in a down-trend = SELL - Supertrend flip inside Discount/Premium = early trend entry - AUTO mode can also add reversal signals at Discount/Premium (optional)
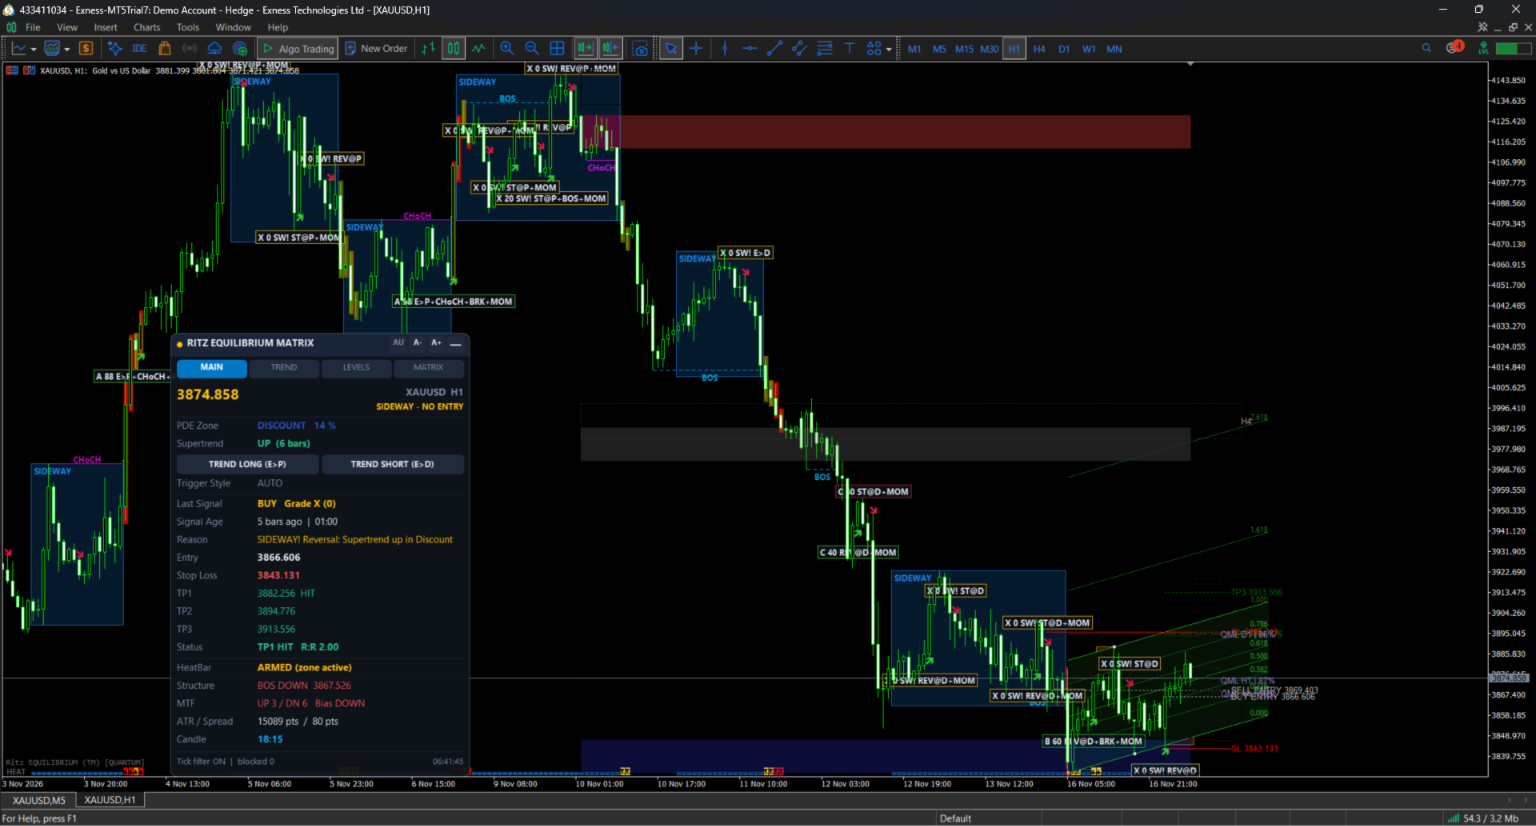
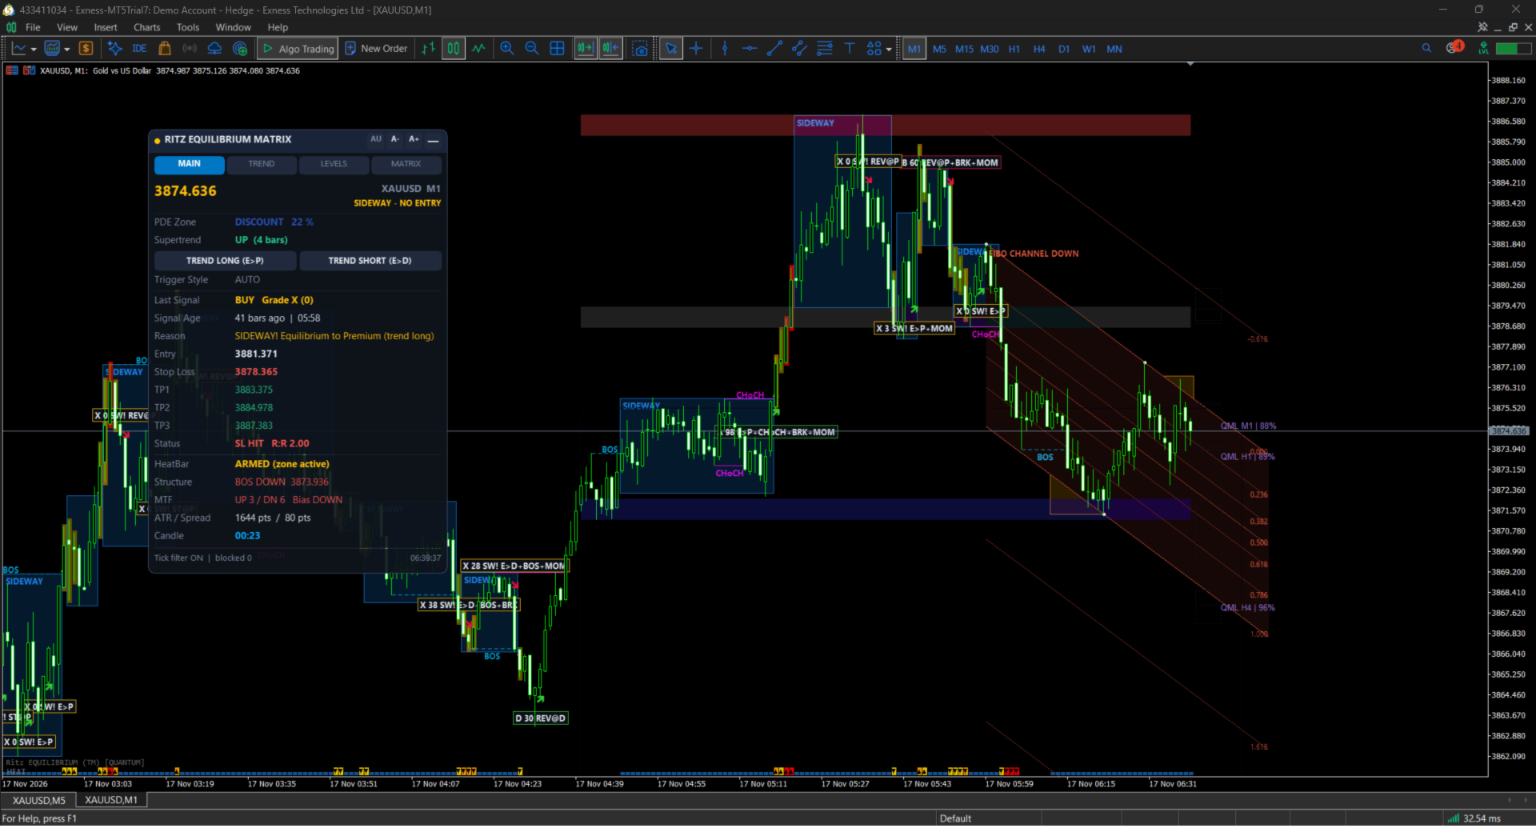
2. Trigger Style selector (dashboard) AUTO / TREND LONG / TREND SHORT. One style active at a time. TREND LONG shows BUY only, TREND SHORT shows SELL only. Click the active button again to return to AUTO. The choice is remembered per chart.
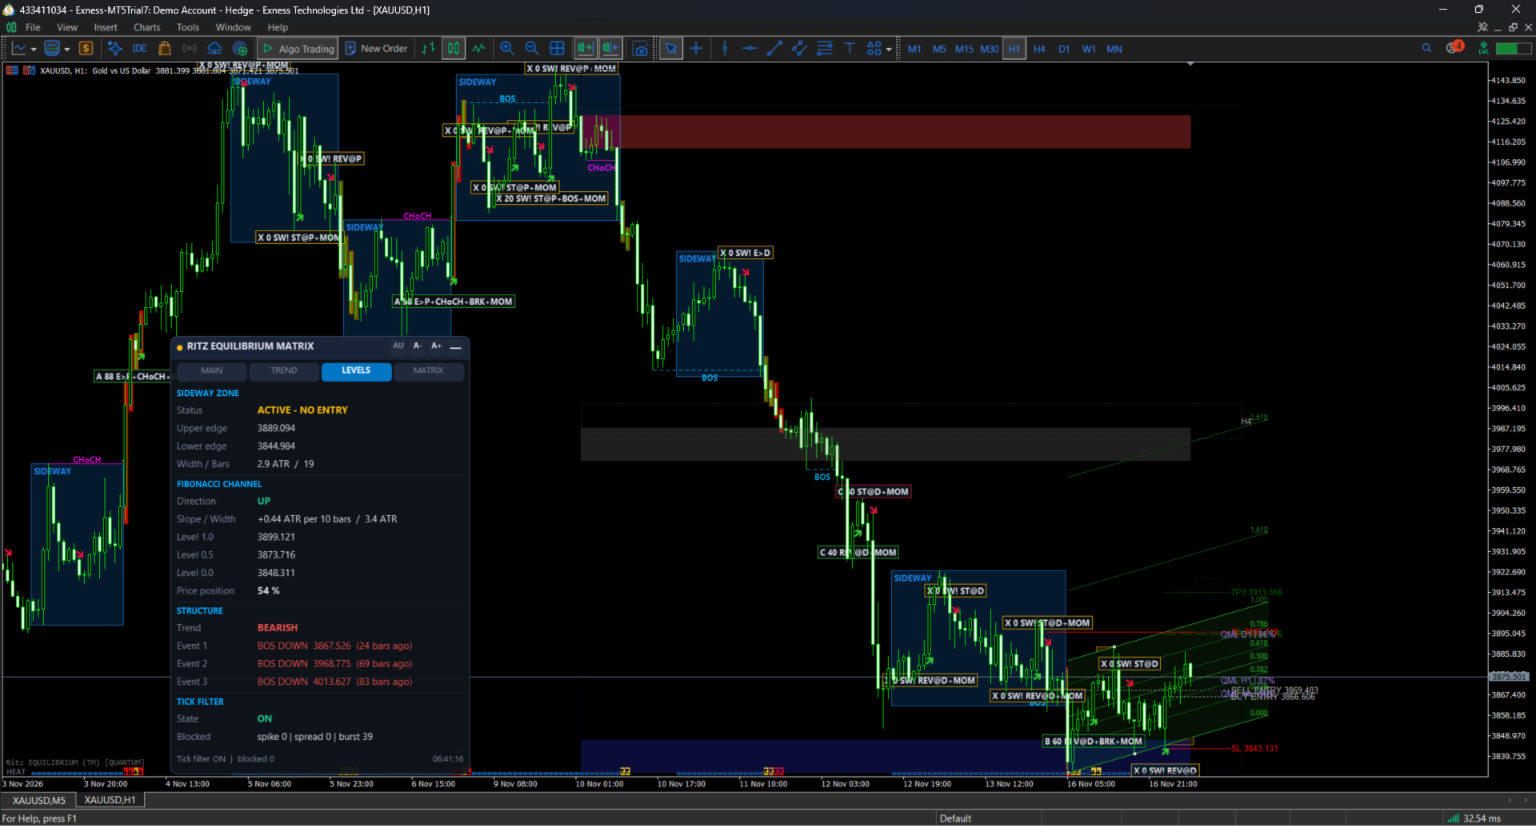
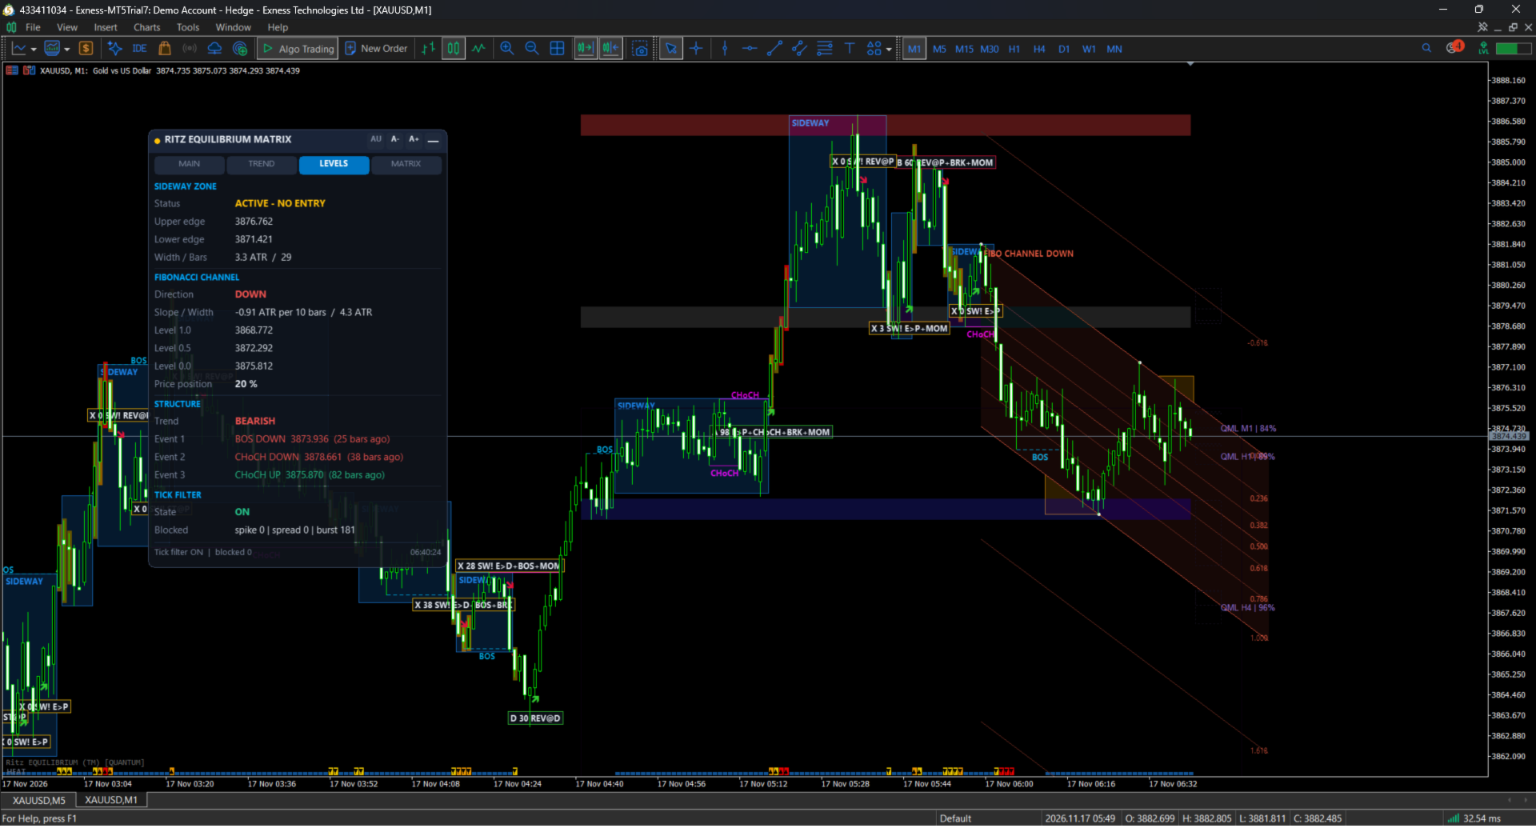
3. Sideway / consolidation warning (no-entry zone) An Efficiency Ratio plus range-to-ATR test detects choppy markets. The sideway area is drawn as a Canvas fill, and signals inside it are flagged or hidden (your choice). Fewer entries in the noise.
4. HeatBar breakout detector When price exits a sideway zone, graded heat levels (L1/L2/L3, by ATR distance) show how strong the breakout is. A breakout alert is available.
5. Broker tick-spam filter (anti fake-arrow) Spread-spike rejection, price-spike confirmation, tick-burst counting, wick clamp by ATR, and live confirmation by ticks and milliseconds. Signal Mode: LIVE CONFIRMED or BAR CLOSE (no repaint, arrow fixed after the bar closes).
6. BOS / CHoCH reason tags Every arrow carries its cause: structure break (BOS), character change (CHoCH), zone location and trend trigger, combined into a reason score and a grade, so you can rank setups instead of guessing.
7. Fibonacci Channel (diagonal measure) Built from the last three alternating swing pivots. 1 px thin lines, fill can be turned off.
8. Automatic trade levels: SL, TP1, TP2, TP3 Created the moment a BUY/SELL triggers. Short finite lines (they do not stretch across the whole chart), with labels. Lines disappear when a target is reached, when SL is hit, or when the signal expires (default 60 bars). Multiple open signals are tracked at once.
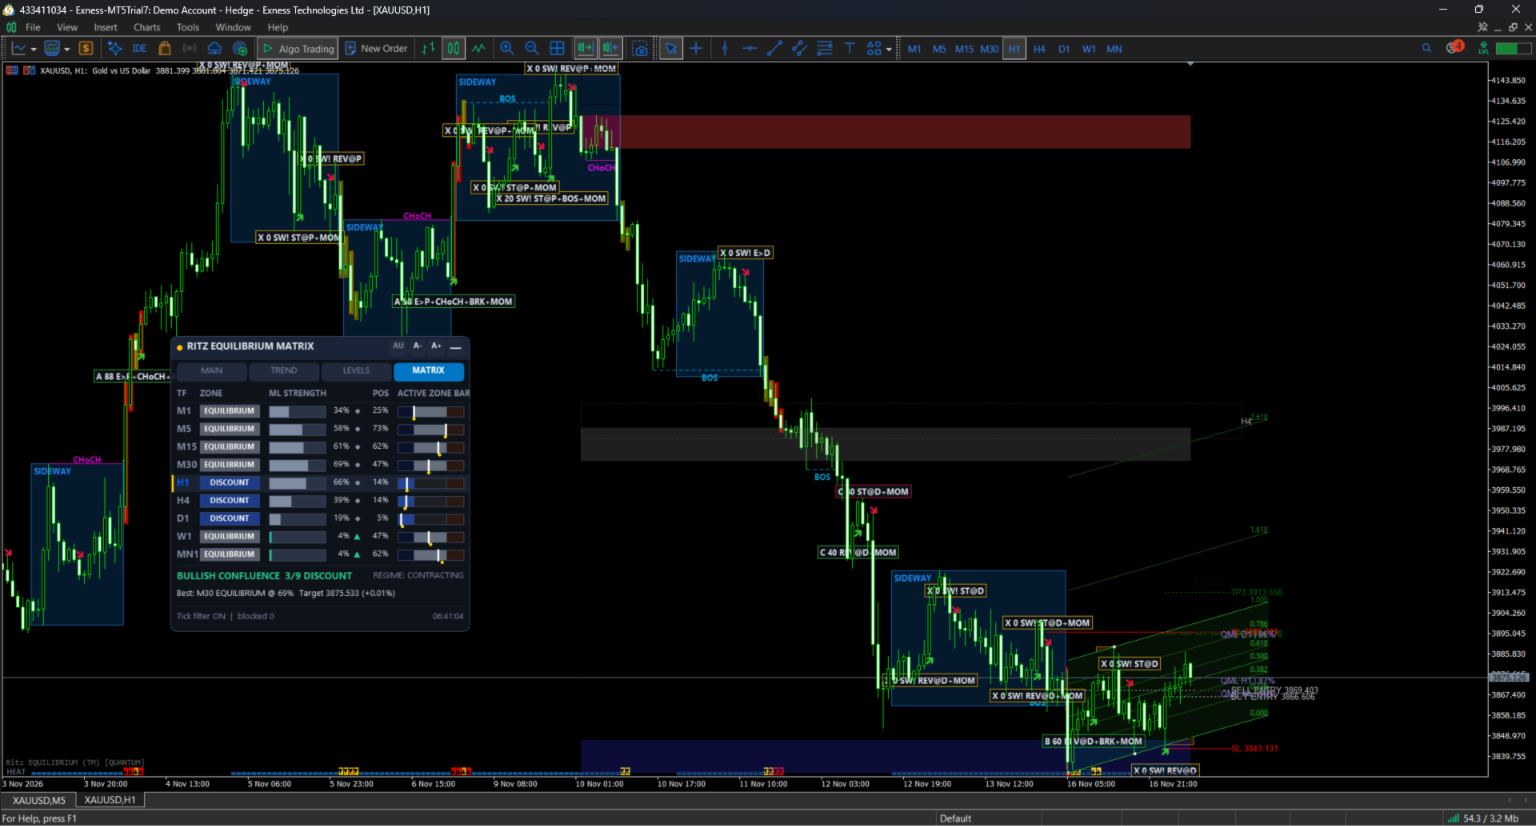
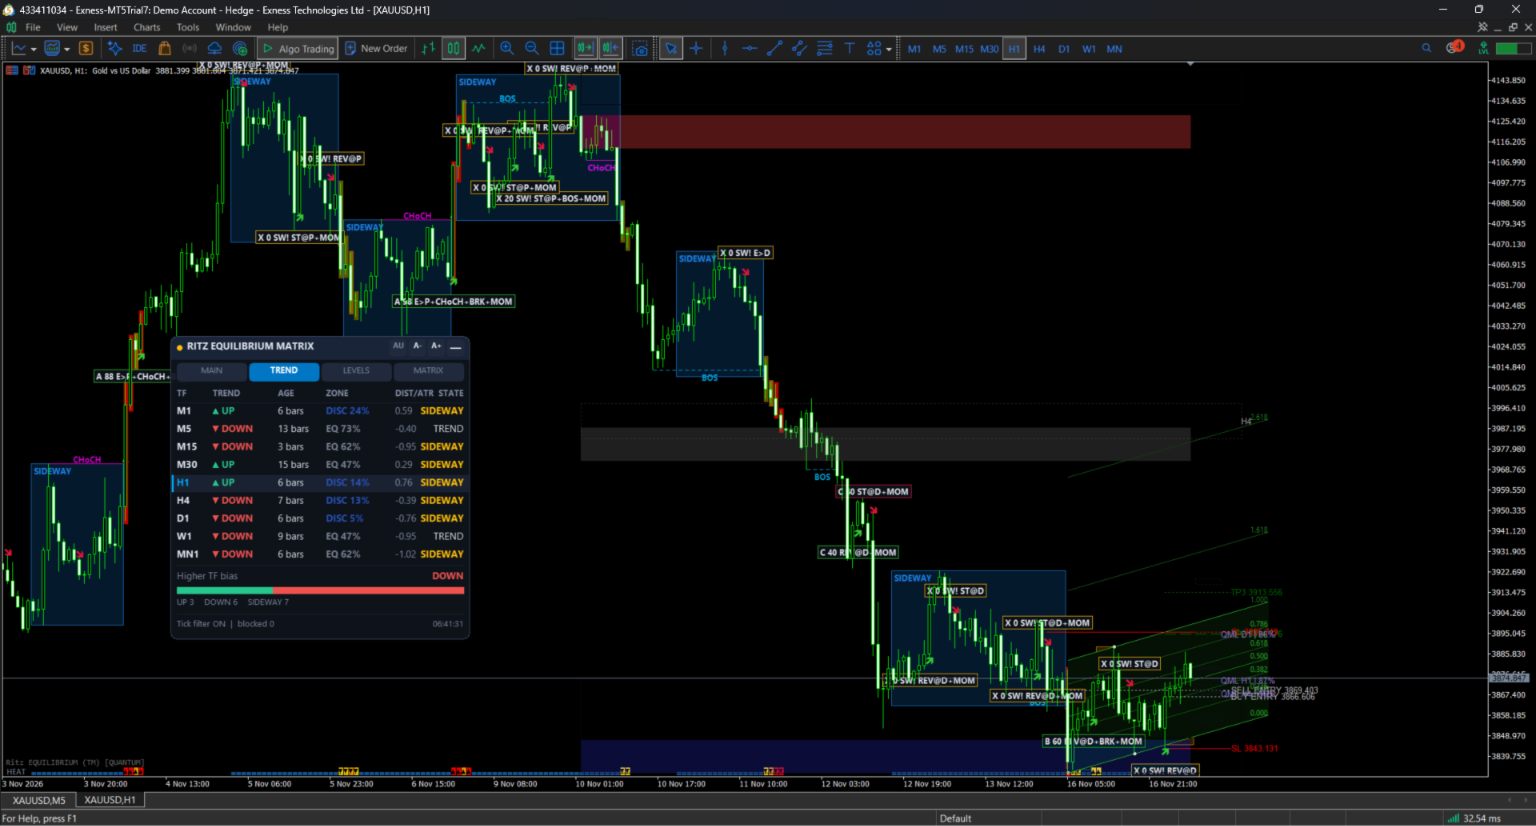
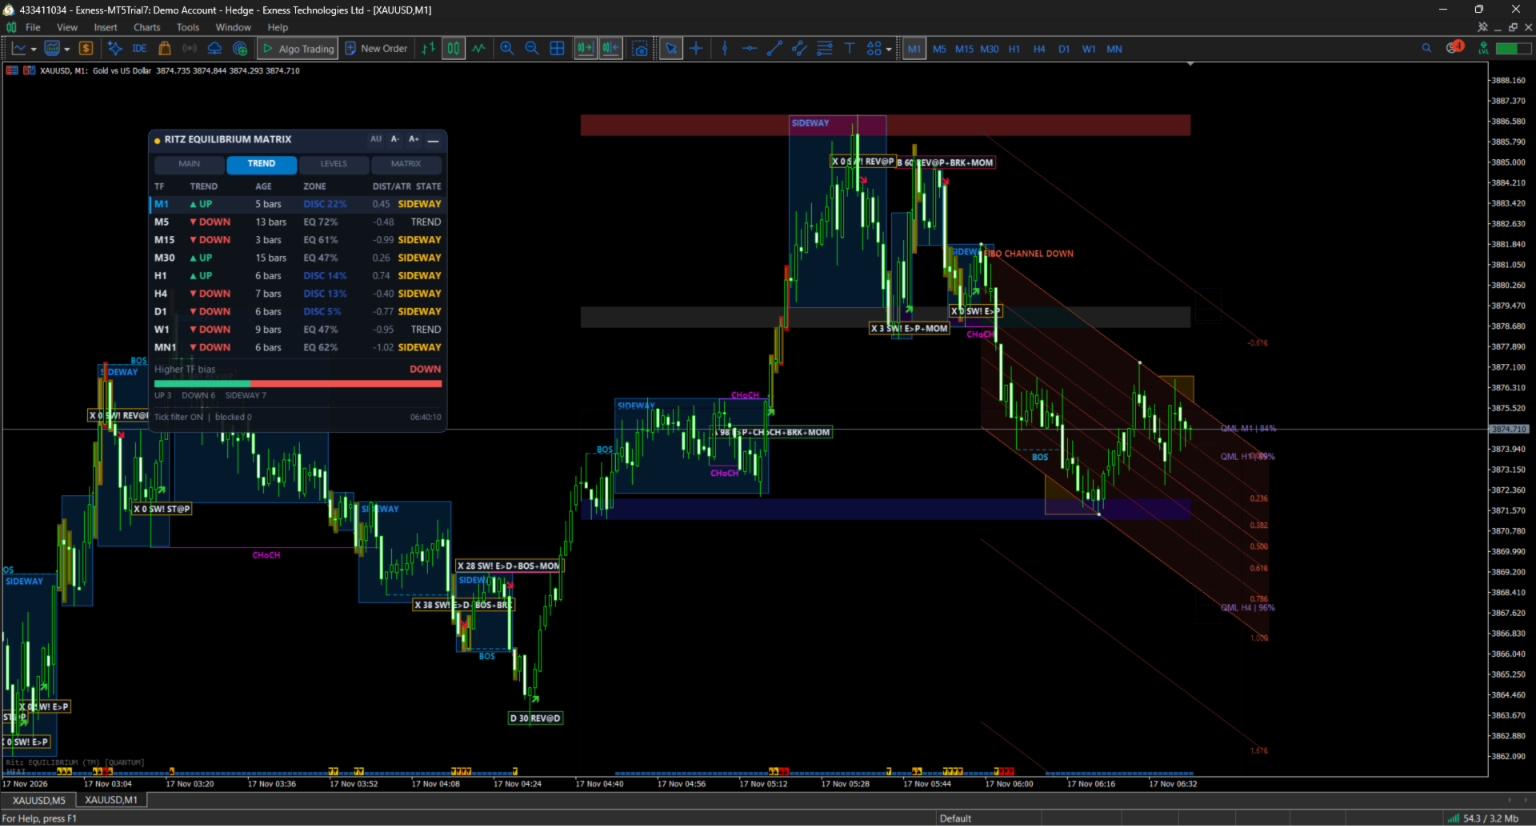
9. Professional Canvas dashboard Tabs: MAIN (key values) | TREND (active trend on every timeframe) | LEVELS (SL/TP and status) | MATRIX (multi-timeframe PDE map). - Auto font scaling to fit any chart size, plus A+ / A- manual control - Minimize / maximize - Drag with the mouse without moving the chart - Position and tab remembered per chart
10. Stable arrow placement on every symbol Arrows use a pixel offset, so distance from the candle looks the same on forex, crypto, metals and indices, on any timeframe.
--------------------------------------------------
CORE FUNCTION
Each timeframe shows three dynamic zones based on the recent High-Low range (LookbackBars):
| Zone | Calculation | Interpretation |
|---|---|---|
| Premium | > 0.95 x High + 0.05 x Low | Expensive area - potential SELL zone |
| Equilibrium | Between mid-ratios (~52.5%) | Fair value - wait and observe |
| Discount | < 0.95 x Low + 0.05 x High | Cheap area - potential BUY zone |
Zones are semi-transparent so candles stay visible.
--------------------------------------------------
MULTI-TIMEFRAME VISUALIZATION
With AutoDetectAllTF = true, the indicator reads High-Low from M1, M5, M15, M30, H1, H4 and D1 and draws all PDE zones on one chart, each timeframe in its own color. The TREND tab of the dashboard shows the Supertrend direction and PDE zone of every timeframe side by side.
Example: price in Discount on H1 but Premium on M5 suggests a short-term retrace before continuation upward.
--------------------------------------------------
HOW TO READ THE CHART
| Price location | Interpretation | Bias |
|---|---|---|
| Premium | Expensive, exhaustion | SELL bias |
| Equilibrium | Balance, indecision | Neutral / range |
| Discount | Cheap, undervalued | BUY bias |
Pro tips:
- Trade arrows that agree with the higher-timeframe trend in the TREND tab.
- Avoid entries while the sideway warning is active. Wait for the HeatBar breakout.
- Prefer arrows with a higher grade (BOS/CHoCH + zone + trend all aligned).
- Strong setups: H1 = Discount aligned with H4 = Equilibrium or Discount.
--------------------------------------------------
VISUAL DESIGN
- Soft transparency, candles always visible (overlay drawn behind price)
- Equilibrium uses lighter alpha for balance emphasis
- Optimized for dark and light chart themes
- ASCII-only text, no special characters
--------------------------------------------------
PERFORMANCE AND STABILITY
- Heavy analysis runs on new bars; live updates are lightweight
- Multi-timeframe scan and projection are throttled (about 1 second)
- Works on all symbols and all timeframes
- Cleans all objects and canvases on removal
- Alerts: signal, zone and breakout notifications
--------------------------------------------------
IMPORTANT NOTES
- Signals are decision support, not a guarantee of profit. Always use your own risk management; SL/TP levels are suggestions.
- Past behavior does not predict future results. Test on a demo account first.
Trade with balance. Understand the flow. Matrix the equilibrium.