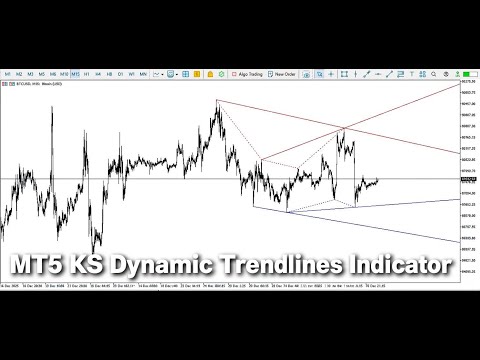
KS Dynamic Trendlines Indicator
- Indicatori
-
Kulvinder Singh
 KULVINDER SINGH
MQL5 Developer | Python Developer | Forex Trader | Software Product Creator
📞 +91-9996327555 | ✉ Kulvinder99@gmail.com
🌐 smarttradingpip.com | advocateprosuit.in | cctvpeoplecounting.com - Versione: 2.4
- Aggiornato: 15 gennaio 2026
- Attivazioni: 5
DESCRIZIONE:
-----------
KS Dynamic Trendlines è un indicatore avanzato che rileva automaticamente i punti di swing
e traccia linee di tendenza intelligenti che si adattano alle condizioni di mercato in tempo reale.
CARATTERISTICHE PRINCIPALI:
------------
Rilevamento automatico dei massimi/minimi di swing
Generazione dinamica di linee di tendenza che collegano i punti di swing
Rilevamento in tempo reale delle rotture: le linee di tendenza rotte scompaiono automaticamente
La successiva linea di tendenza più forte appare quando quella attuale viene rotta
Supporto Multi-Timeframe: rileva su H4, visualizza su M15
Filtraggio delle linee di tendenza parallele: rimuove le linee ridondanti
Filtraggio per distanza: nasconde le linee di tendenza troppo lontane dal prezzo
Colori, spessori e stili personalizzabili
Visualizzazione a Zigzag con punti di swing etichettati
RILEVAMENTO SWING:
- DetectionTimeframe: Scegli il timeframe per il rilevamento degli swing (CURRENT, M1-MN1)
- SwingBars: Numero di barre a sinistra/destra per la convalida dello swing (predefinito: 10)
- ThresholdPoints: Distanza minima tra i livelli di swing (predefinito: 50)
VISUALIZZAZIONE ZIGZAG:
- ShowZigzag: Visualizza le linee a zigzag che collegano gli swing
- UpperZigzagColor/LowerZigzagColor: Colori per le linee a zigzag
- ZigzagWidth: Spessore della linea
- ZigzagStyle: Stile della linea (continua, punteggiata, tratteggiata, ecc.)
LINEE DI TENDENZA DINAMICHE:
- ShowTrendlines: Abilita/disabilita la funzione linee di tendenza
- MaxTrendlines: Quante linee di tendenza mostrare per tipo (1-10, predefinito: 3)
- MaxDistancePoints: Nasconde le linee di tendenza più distanti di X punti (0 = illimitato)
- ParallelFilterPoints: Nasconde le linee parallele più vicine di X punti (predefinito: 50)
- UpperTrendColor/LowerTrendColor: Colori per le linee di tendenza
- TrendlineWidth: Spessore della linea
- TrendlineStyle: Stile della linea
- ExtendTrendlines: Estende le linee verso sinistra
- HideOnBreak: Nasconde automaticamente le linee di tendenza rotte