Support and Resistance Screener Pro MT5
- Indicatori
-
STE S.S.COMPANY
 Hello,
my name is Ashraf a fintech Software Engineer.
I create amazing forex indicators and expert advisors for Metatrader 4 and Metatrader 5, the best trading platforms.
Use my service and let me build your trading strategies ( Indicator coding or EA coding ) by click on bellow link - Versione: 13.20
- Aggiornato: 13 dicembre 2023
- Attivazioni: 10
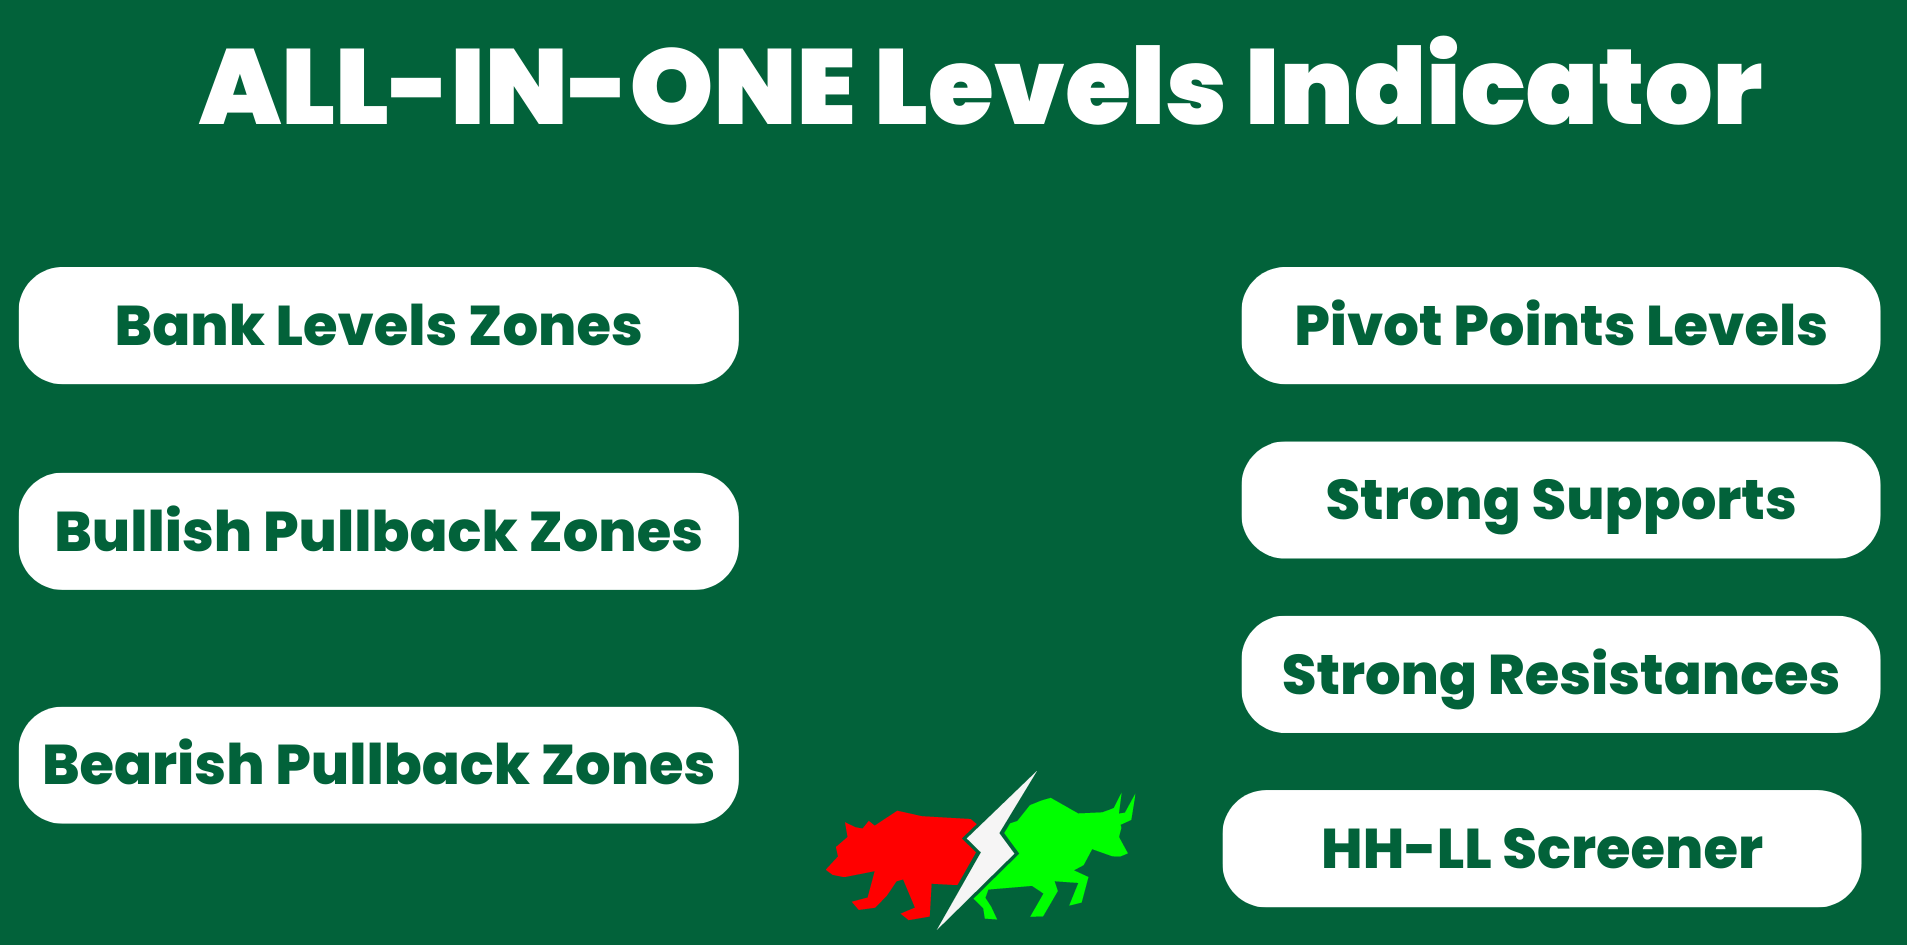
Support And Resistance Screener è in un indicatore di livello per MetaTrader che fornisce più strumenti all'interno di un indicatore. Gli strumenti disponibili sono:
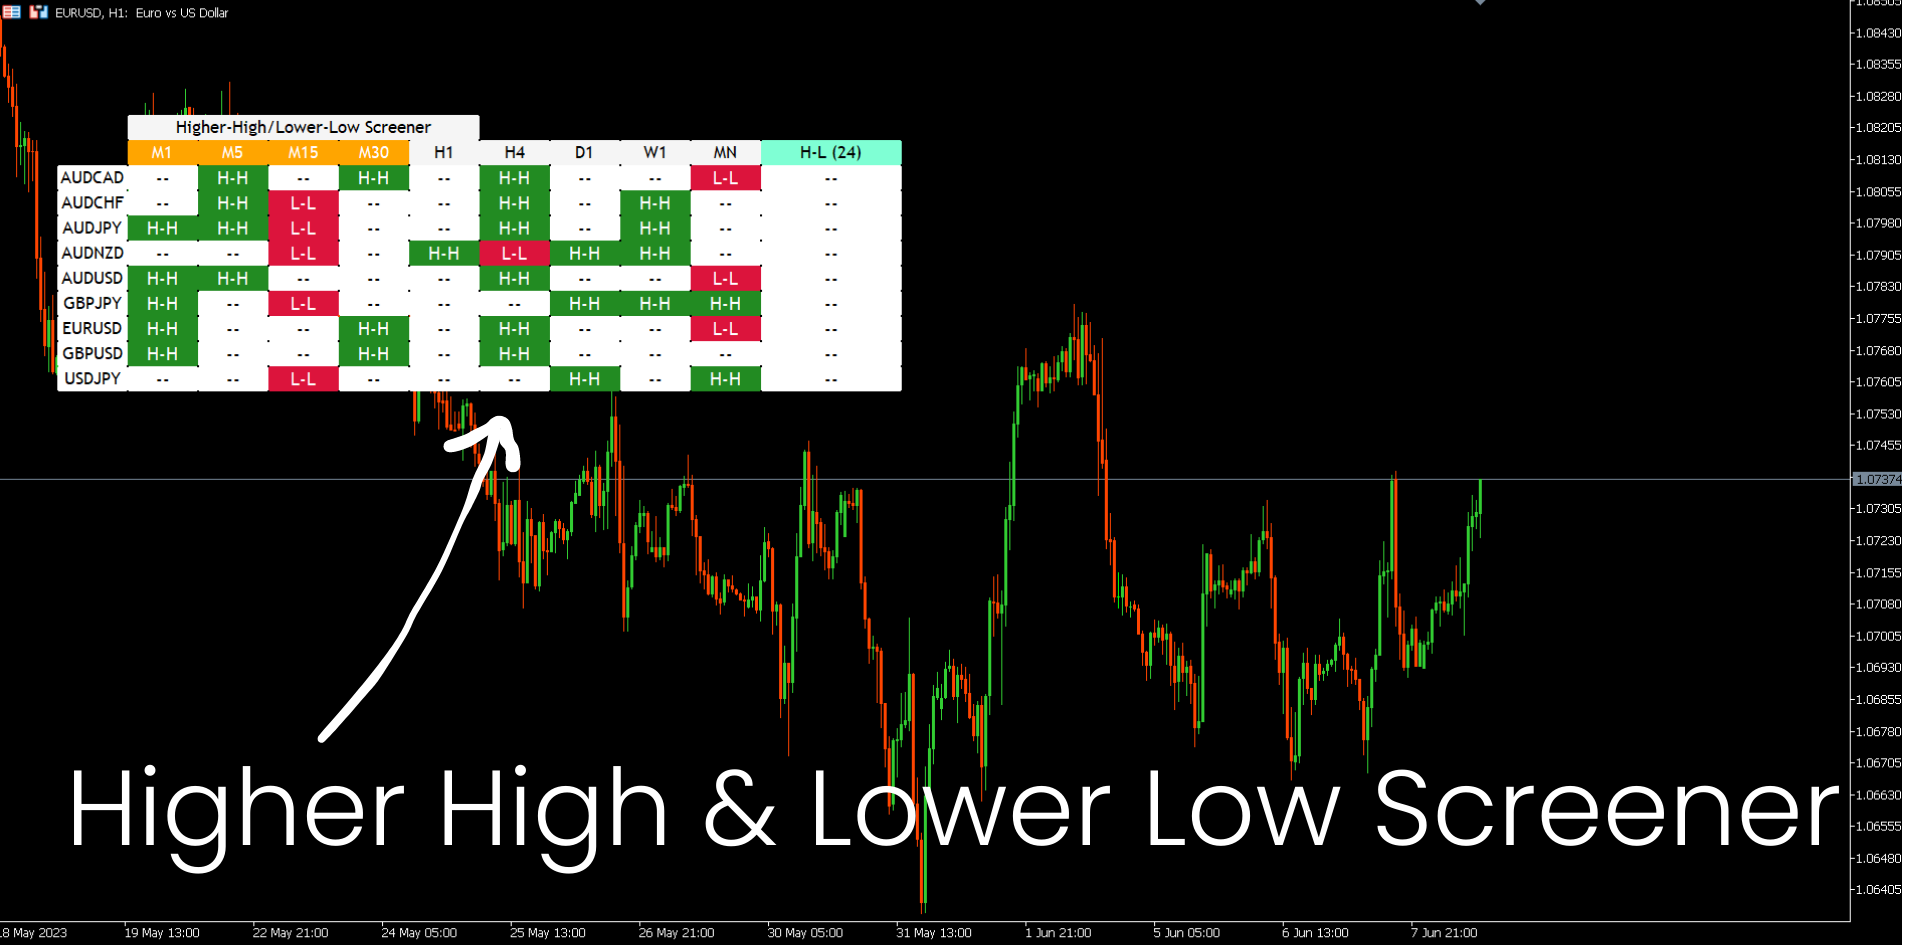
1. Screener della struttura del mercato.
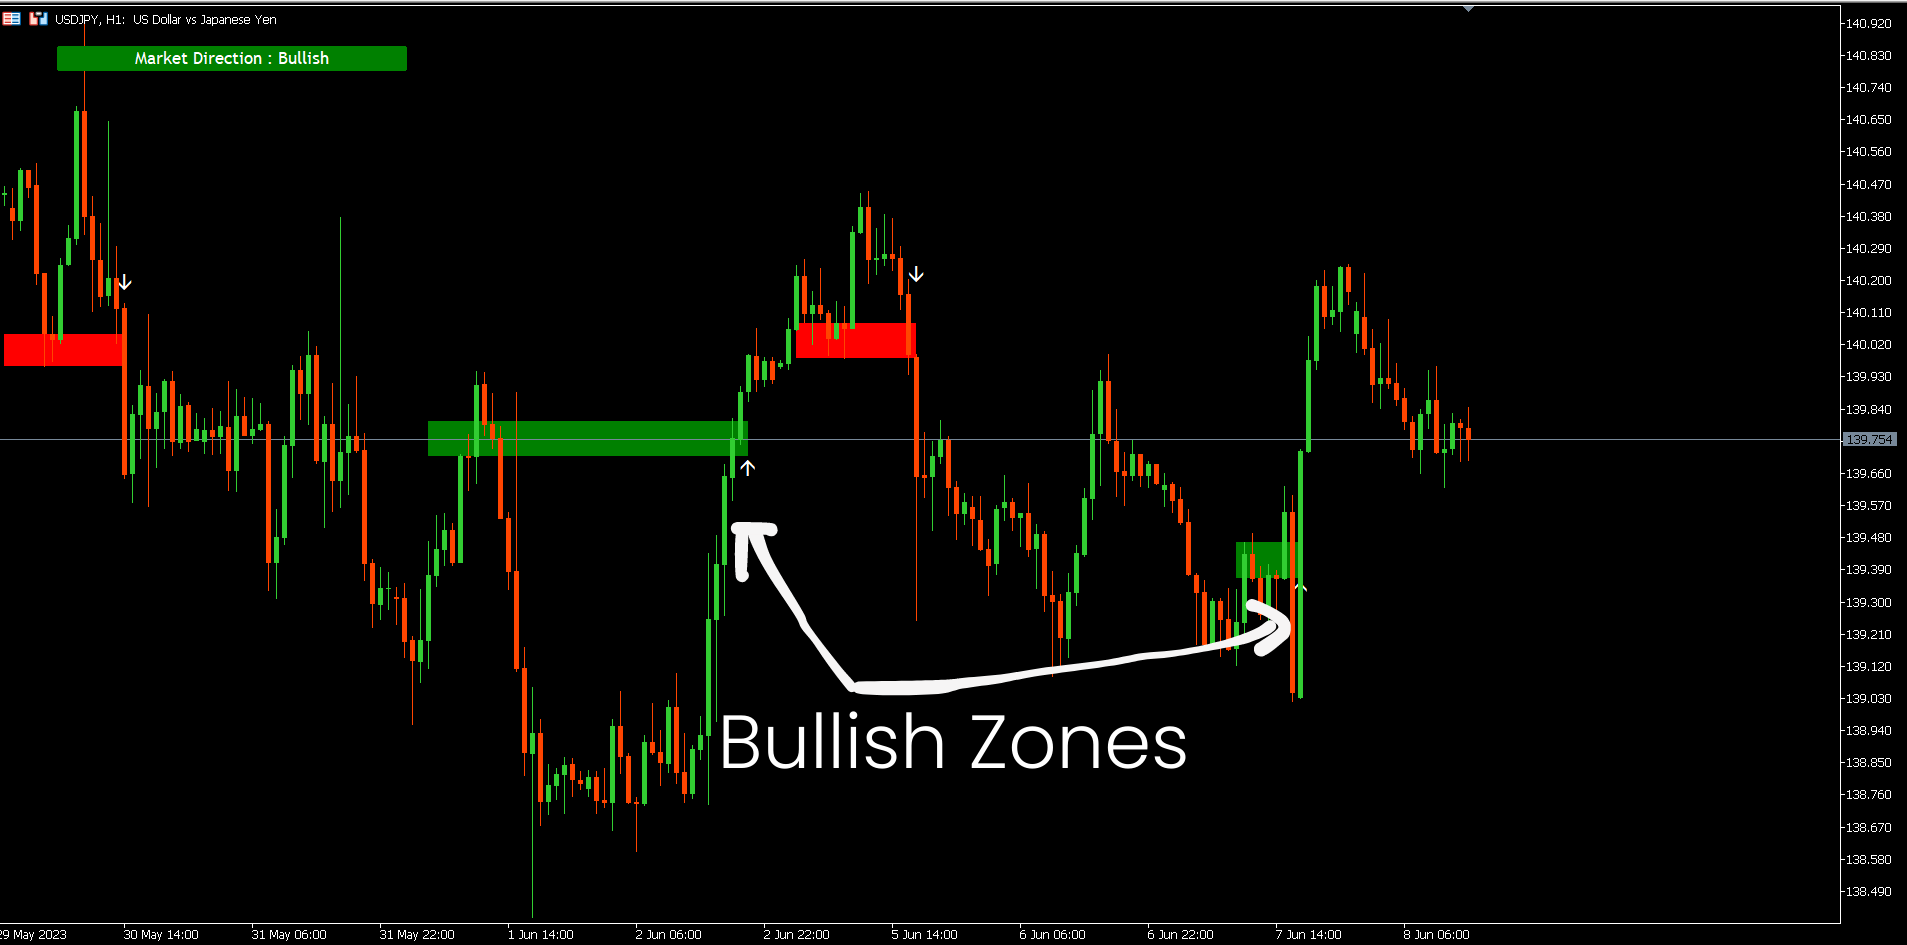
2. Zona di ritiro rialzista.
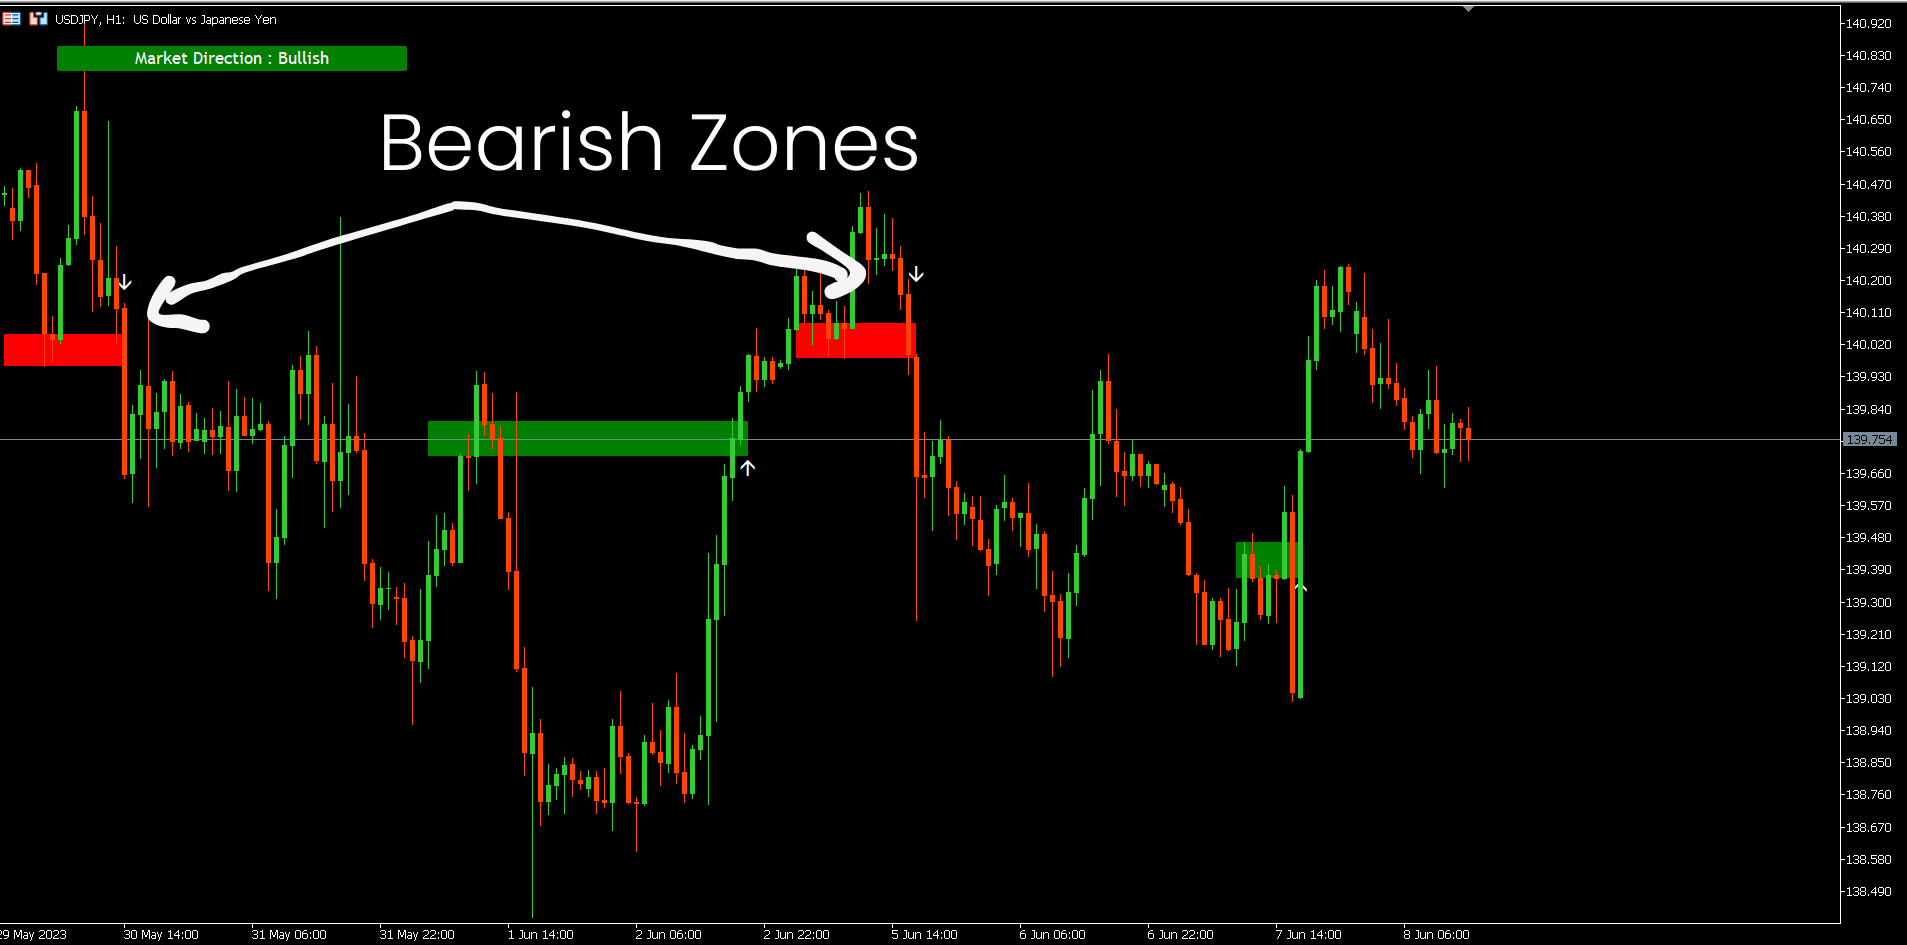
3. Zona di ritiro ribassista.
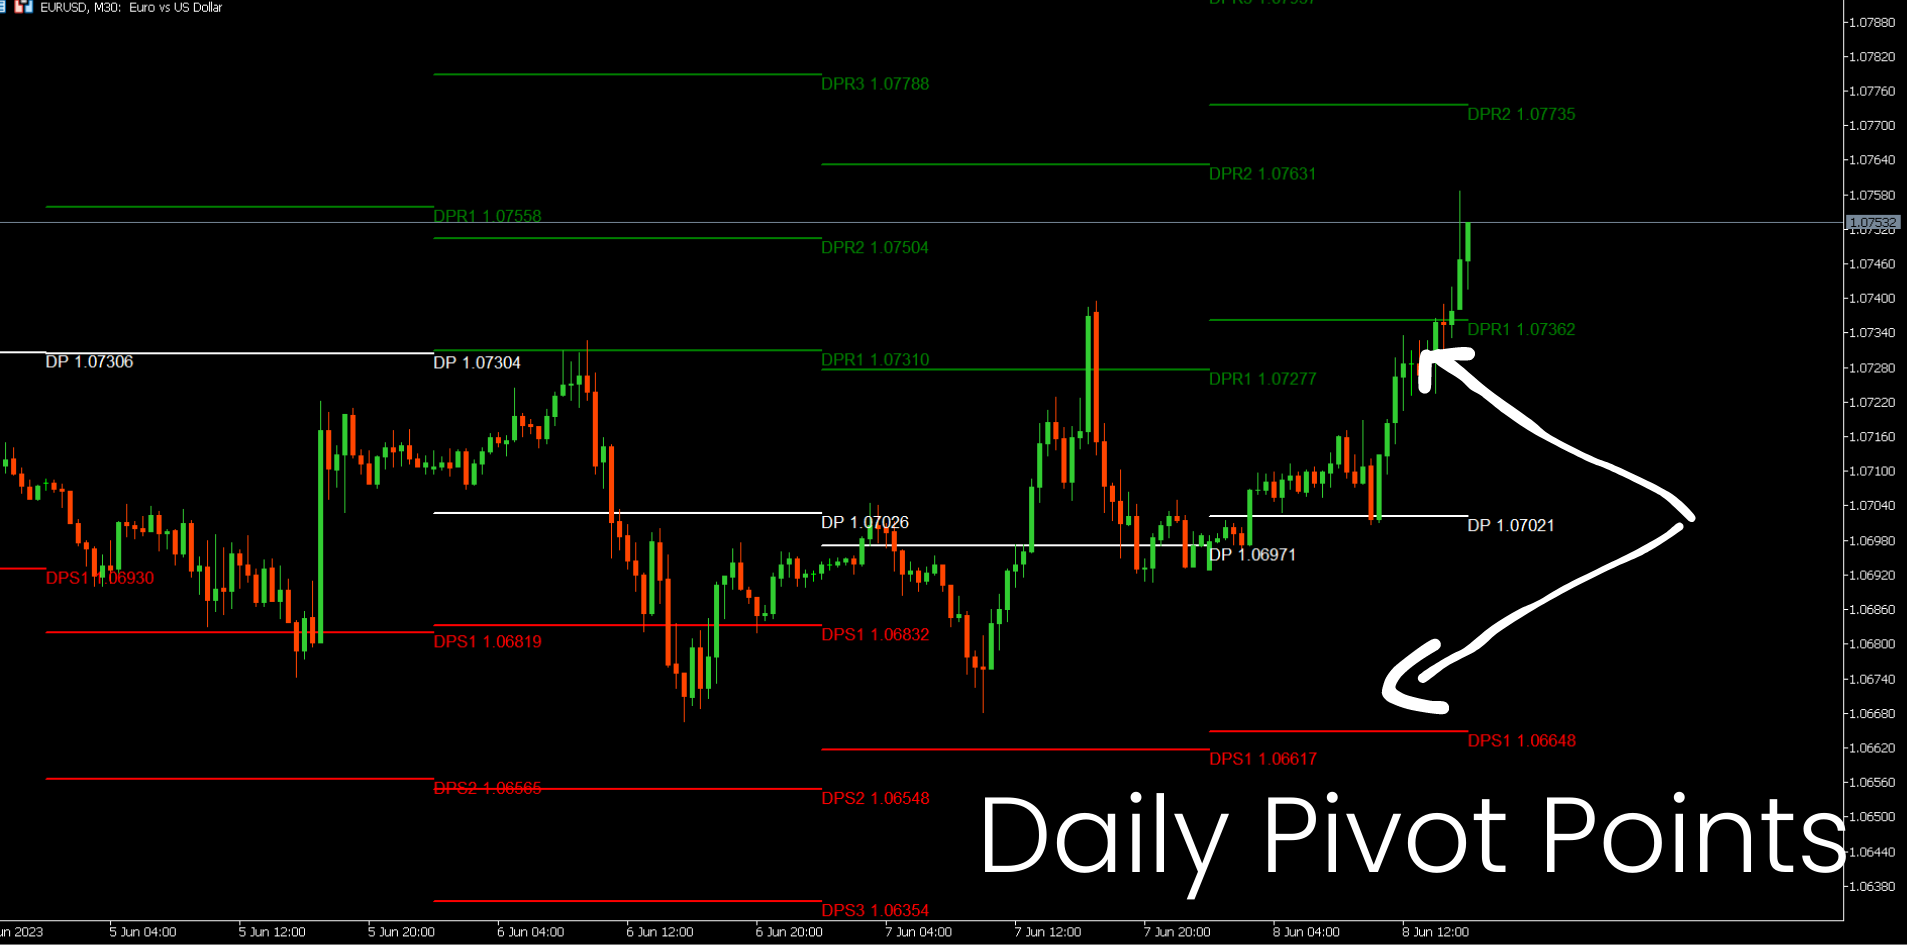
4. Punti pivot giornalieri
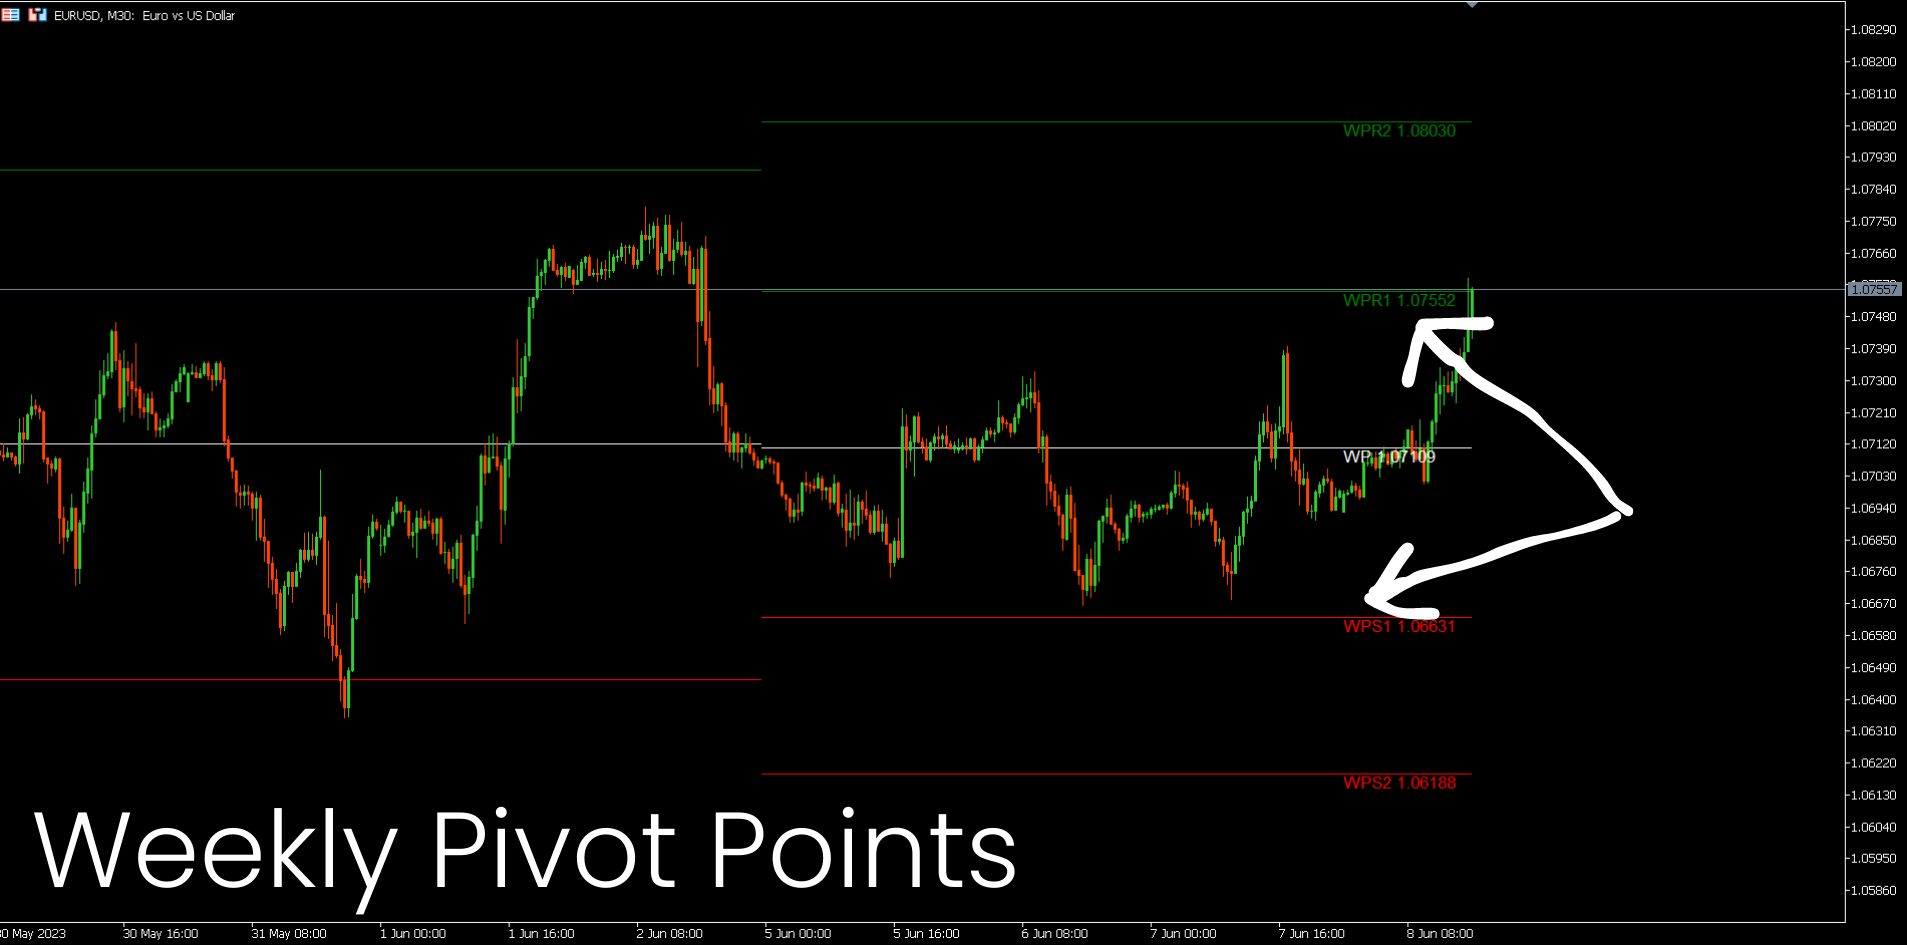
5. Punti pivot settimanali
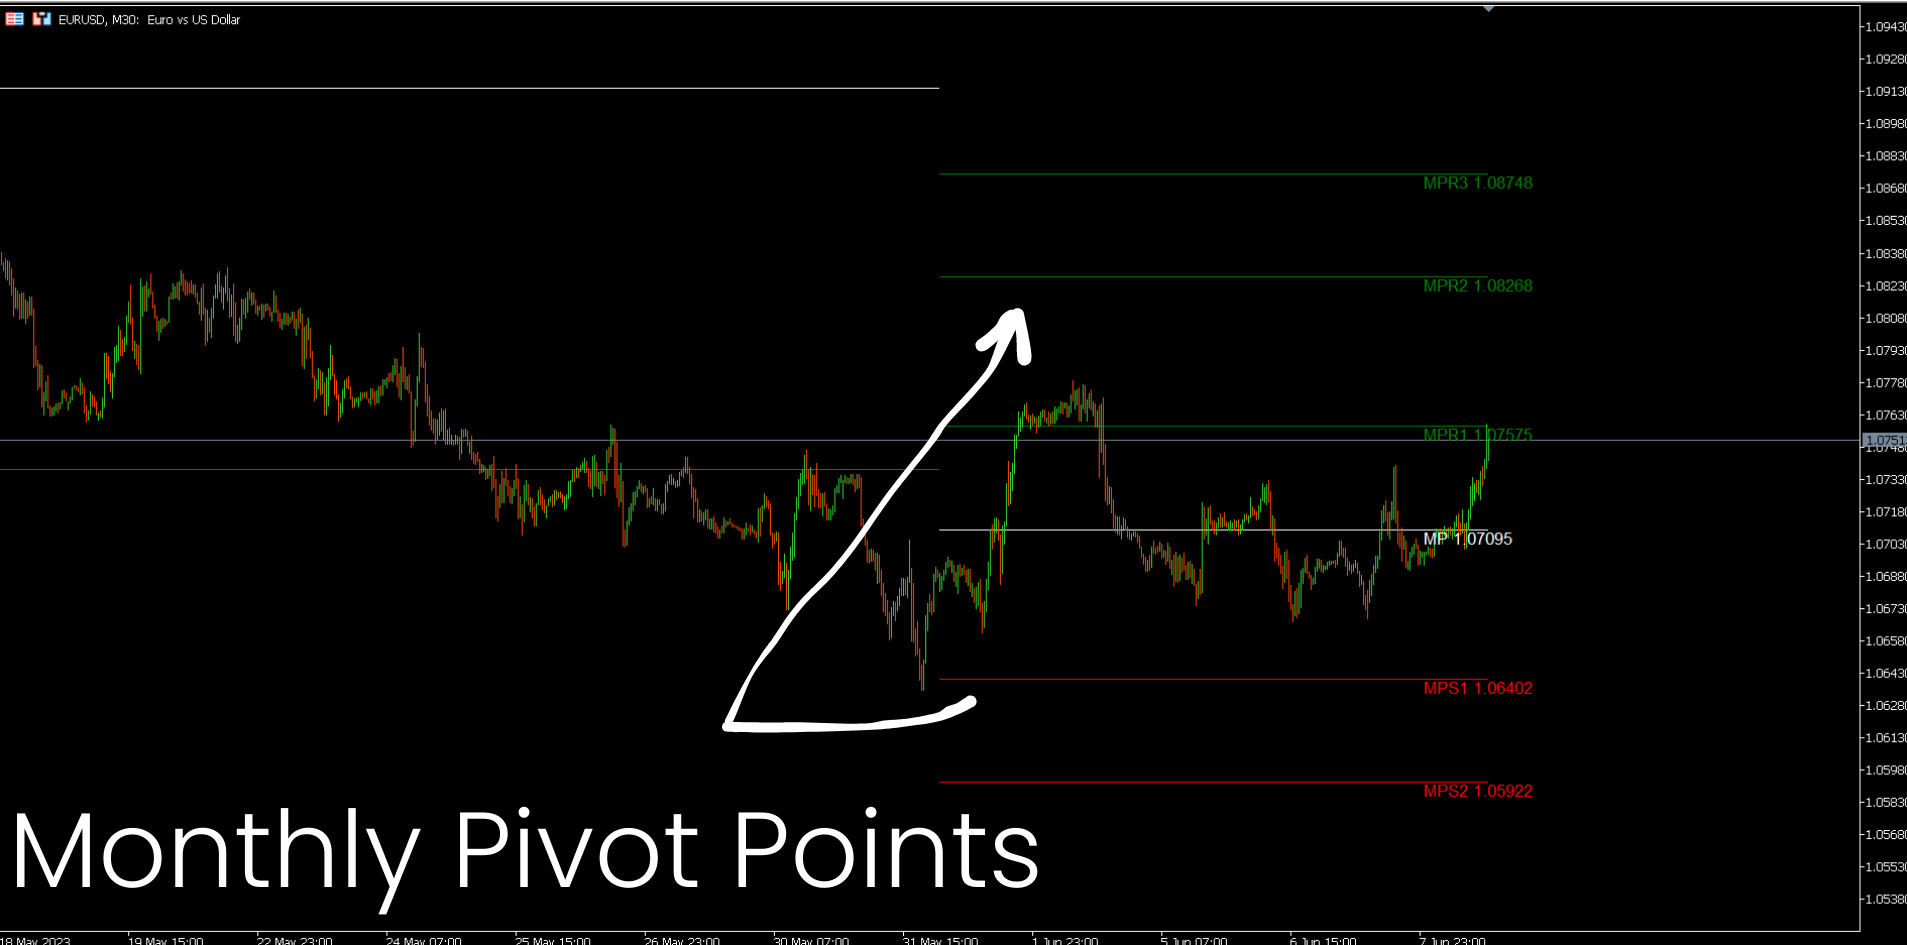
6. Punti pivot mensili
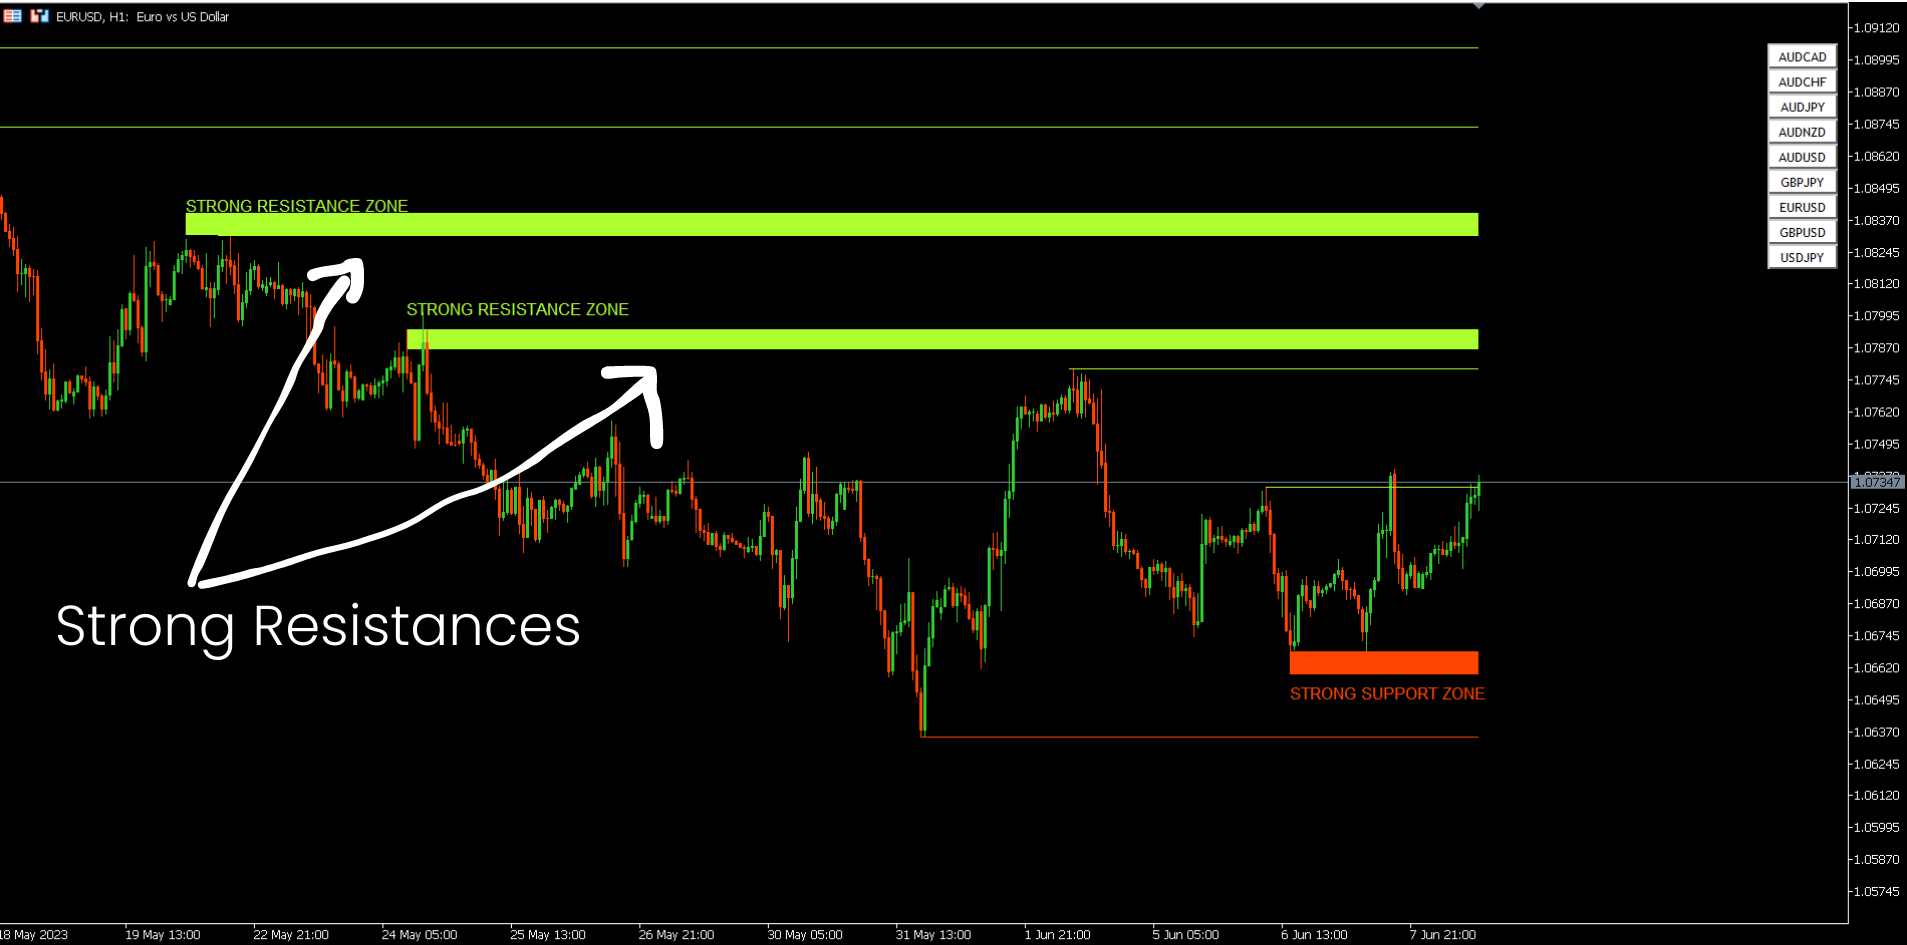
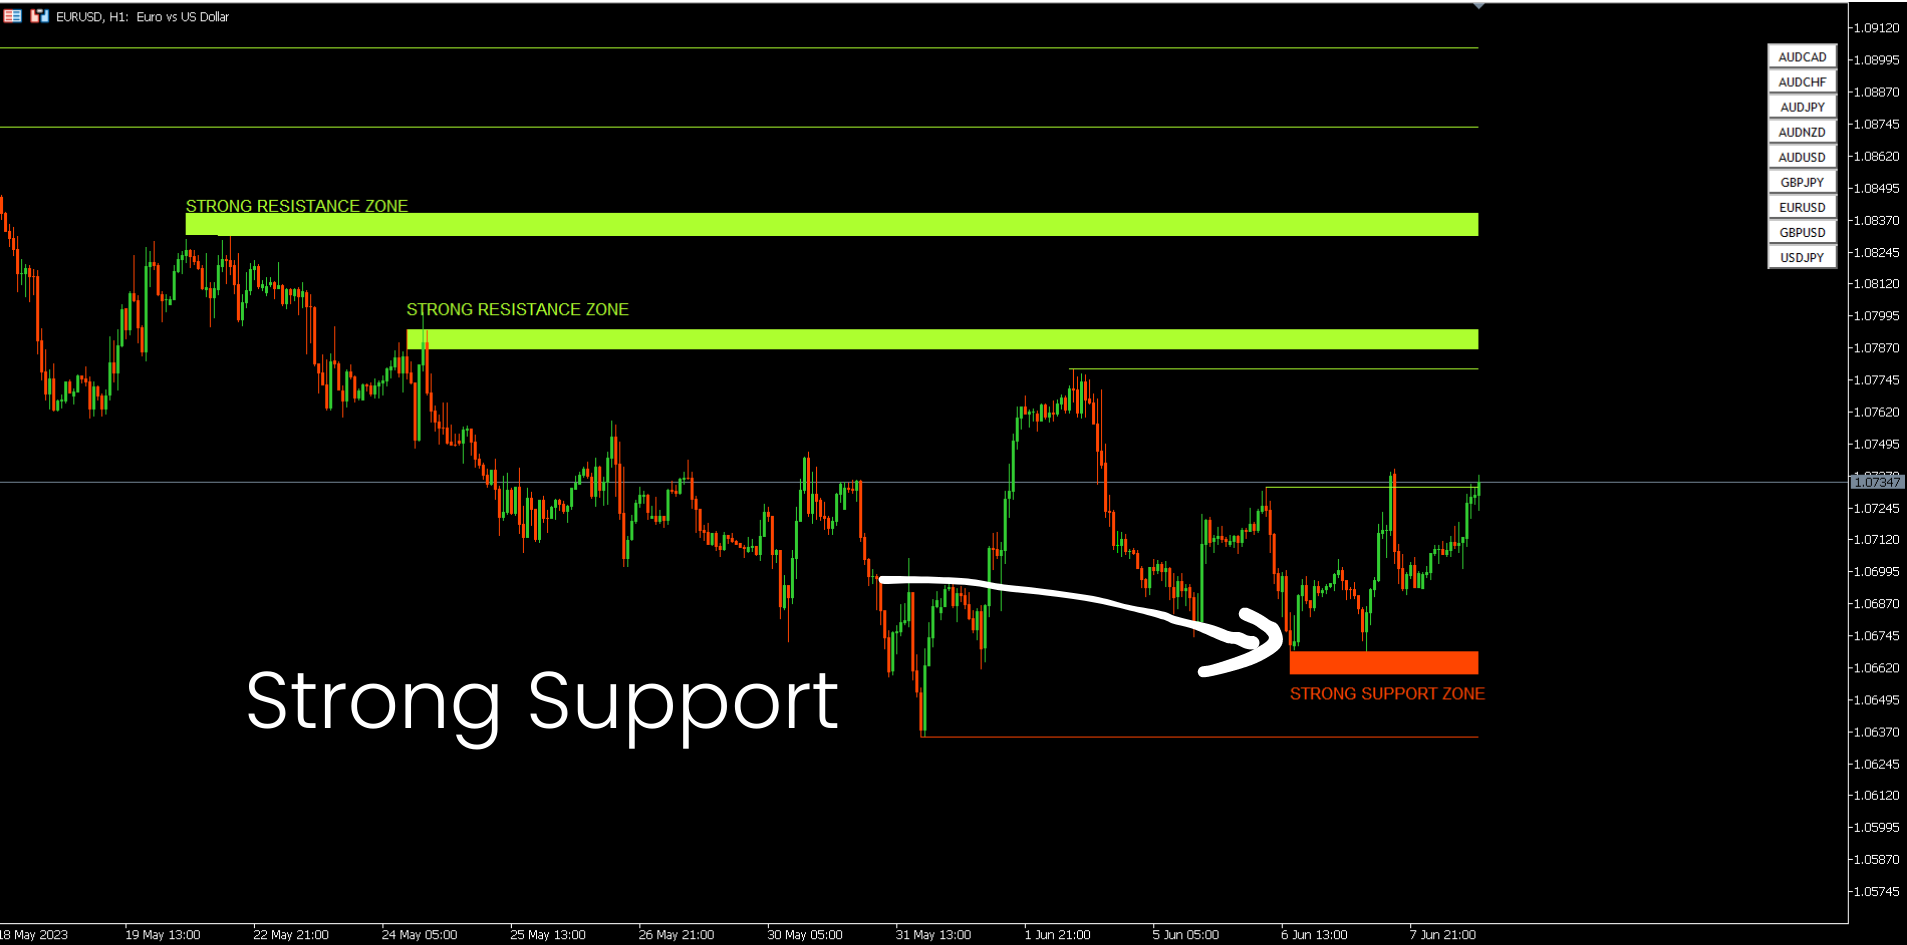
7. Forte supporto e resistenza basati sul modello e sul volume armonici.
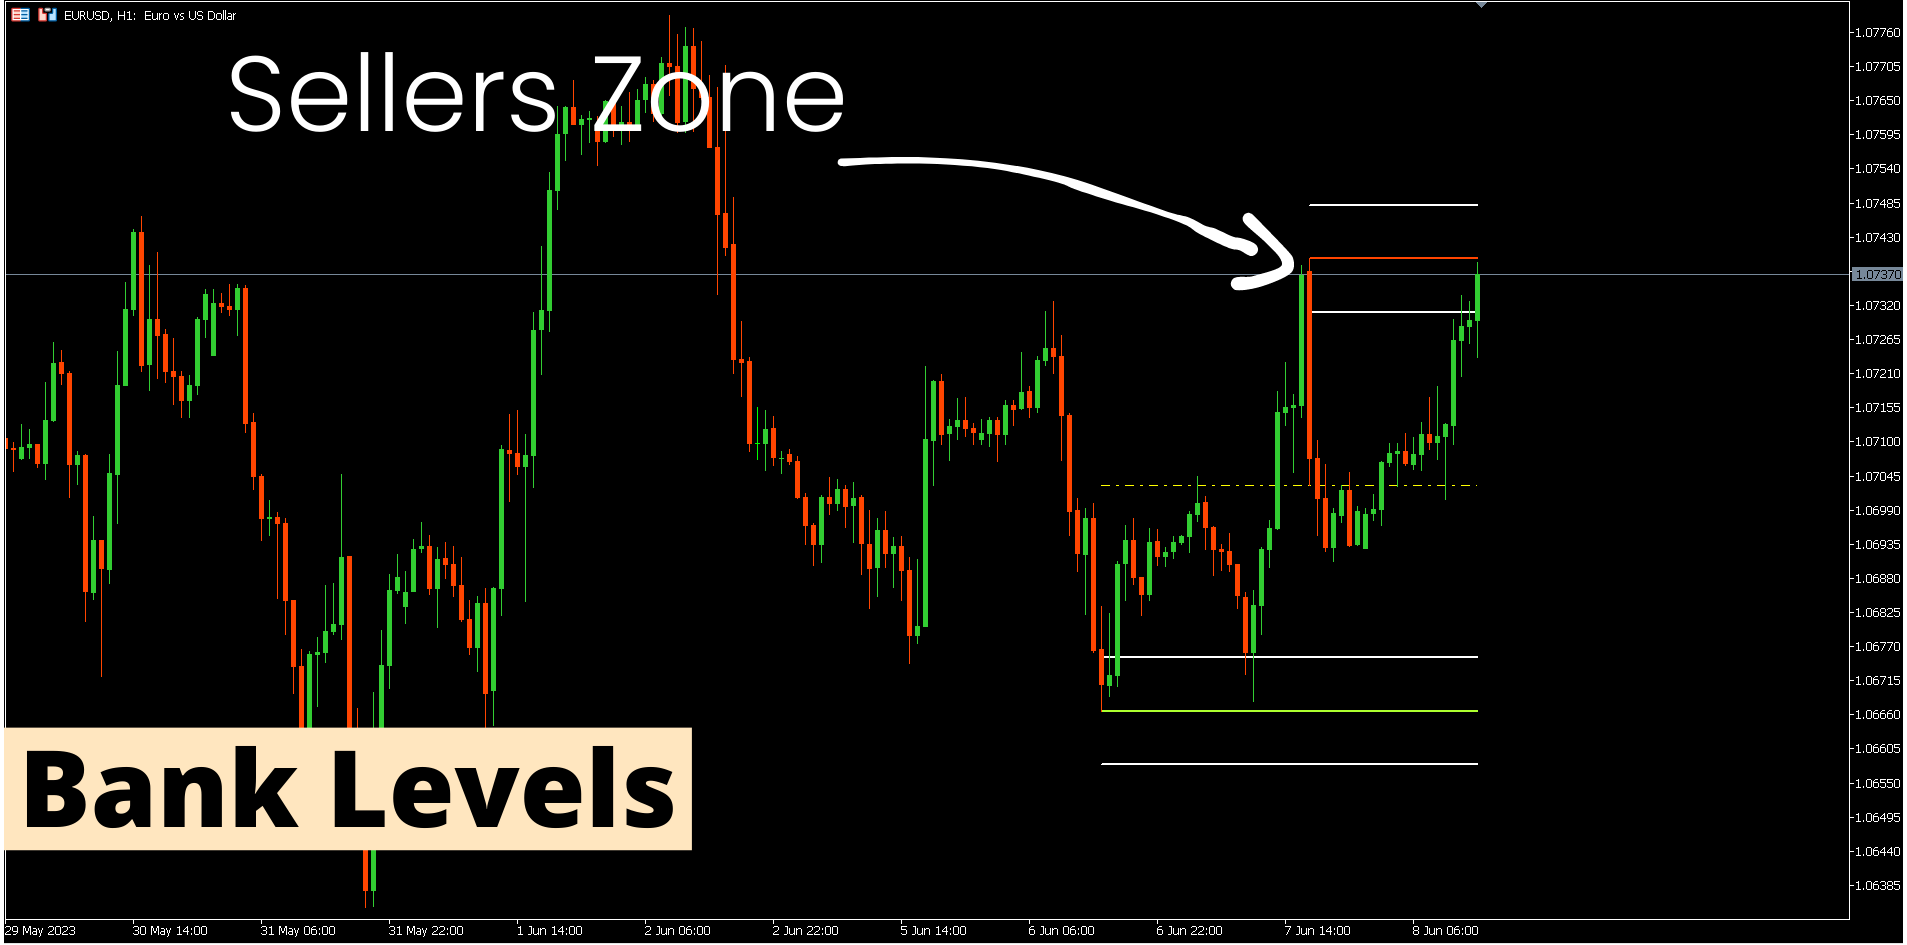
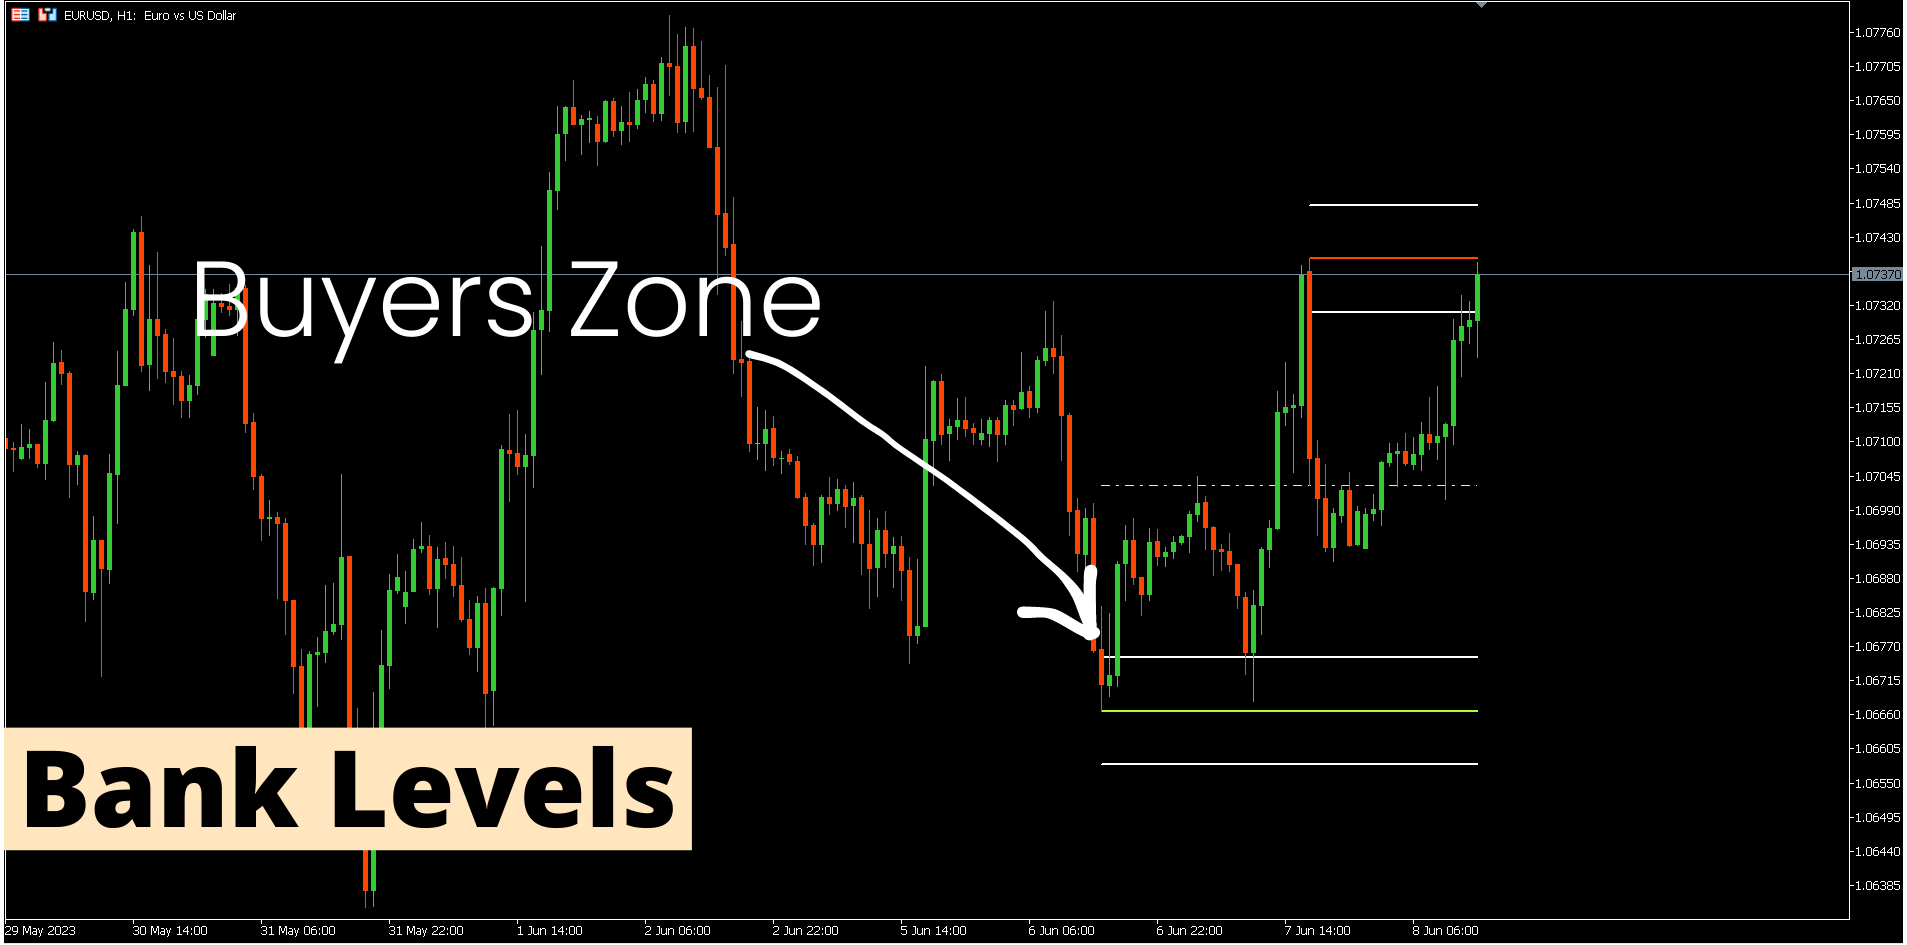
8. Zone a livello di banca.
OFFERTA A TEMPO LIMITATO: il supporto HV e l'indicatore di resistenza sono disponibili per soli 50 $ e a vita. ( Prezzo originale 125 $ )
Accedendo al nostro Blog MQL5, puoi trovare tutti i nostri indicatori premium con esempi di analisi: Clicca qui
Caratteristiche principali
- Forte supporto e zone di resistenza basate su algoritmi di armoniche e volume.
- Zone di pullback rialzista e ribassista basate su algoritmi Harmonic e Volume.
- Screener della struttura del mercato.
- Punti Pivot giornalieri, settimanali e mensili.
Documentazioni
Tutta la documentazione di Support and Resistance Screener (Istruzioni) e i dettagli sulla strategia sono disponibili in questo post nel nostro blog MQL5: Clicca qui. Contatto
Autore
SAYADI ACHREF, ingegnere del software fintech e fondatore di Finansya 


The Best Support and Resistance Indicator on the Market This indicator clearly outperforms every other support and resistance tool I have used in MetaTrader. Support and Resistance Screener Pro MT5 delivers highly accurate and meaningful levels, institutional zones, pivots, structures, and key points that would normally take a lot of time to analyze manually. What I like the most: - Very precise detection of real market zones. - Multi-timeframe and multi-symbol scanning. - Clean and organized visual presentation without noise. - Helps me take faster and better trading decisions. After using it, my market analysis improved immediately. It is a professional and reliable tool with no repainting. I fully recommend it 100%.