SmartBubbles MT5
- Indicatori
-
Vincent Jose Proenca
 Faccio il trader da oltre dieci anni, specializzato principalmente nei CFD. Ciò che amo del trading è la logica, la disciplina e la creazione di strumenti che semplificano il processo decisionale. Non trovando indicatori adatti al mio approccio, ho iniziato a programmarli io stesso — prima per
 - Versione: 2.0
- Aggiornato: 5 dicembre 2025
- Attivazioni: 5
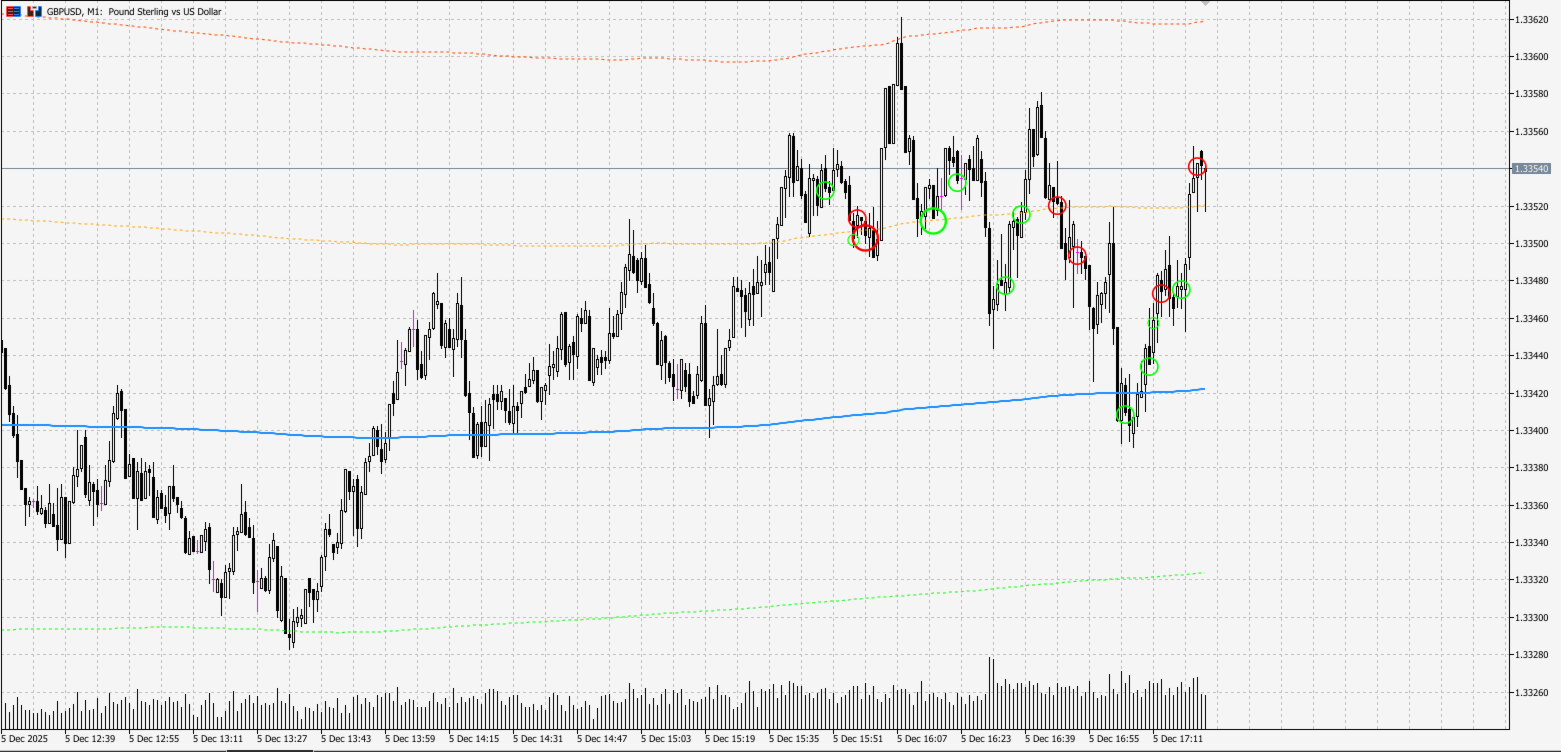
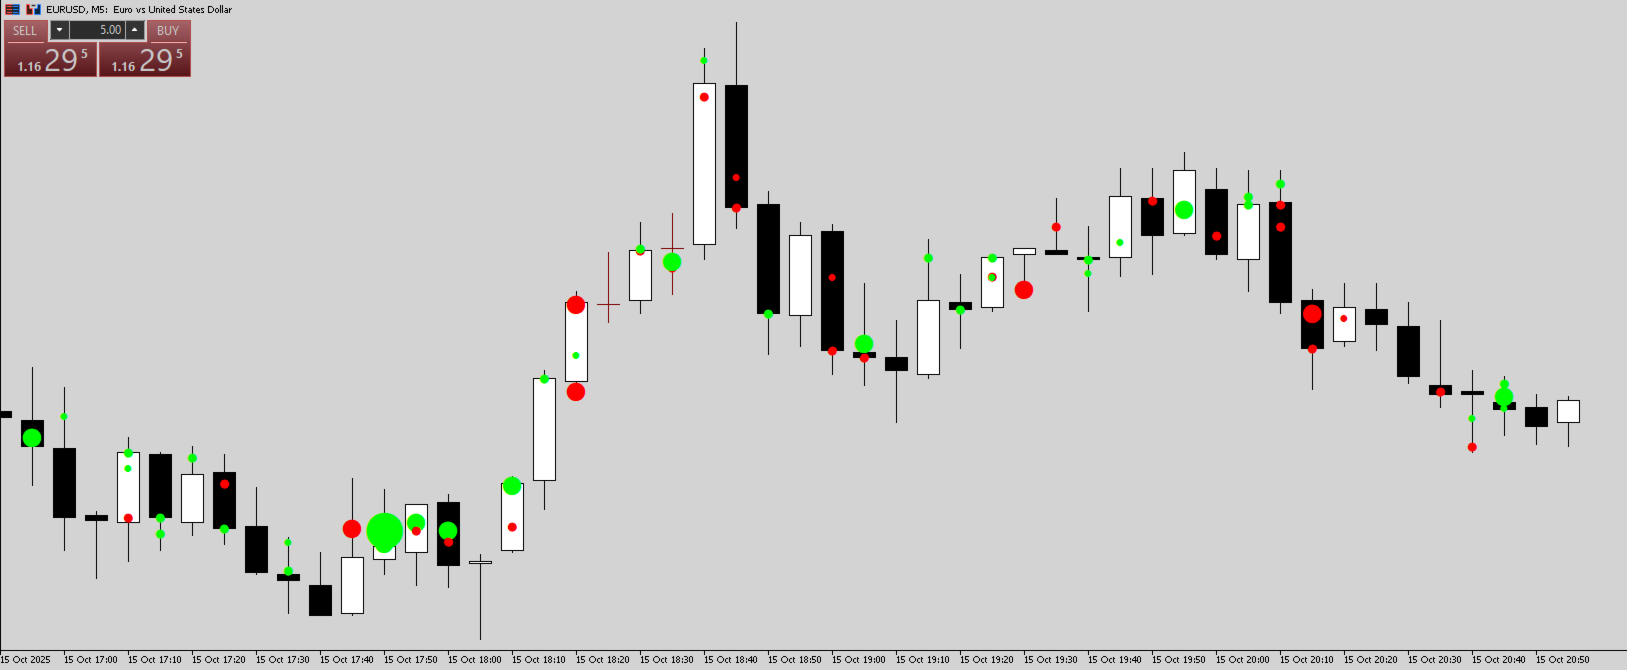
Indicatore a Bolle — Rallentamento del Prezzo + Picco di Volume
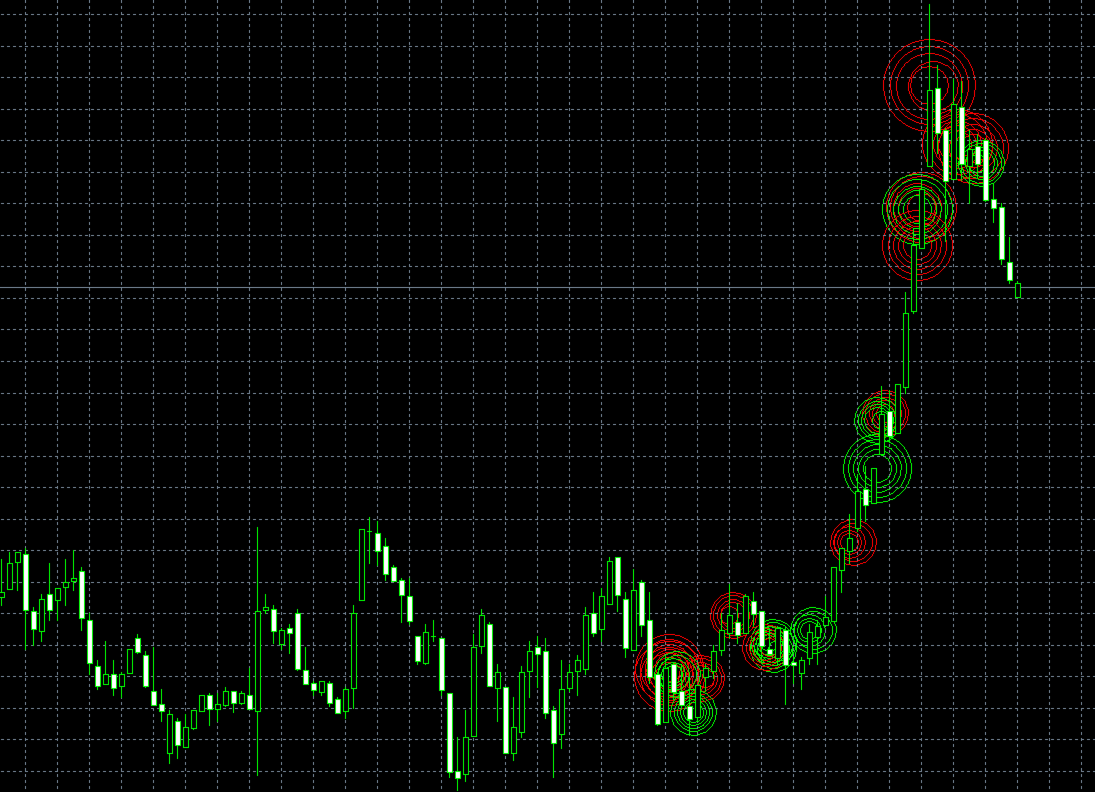
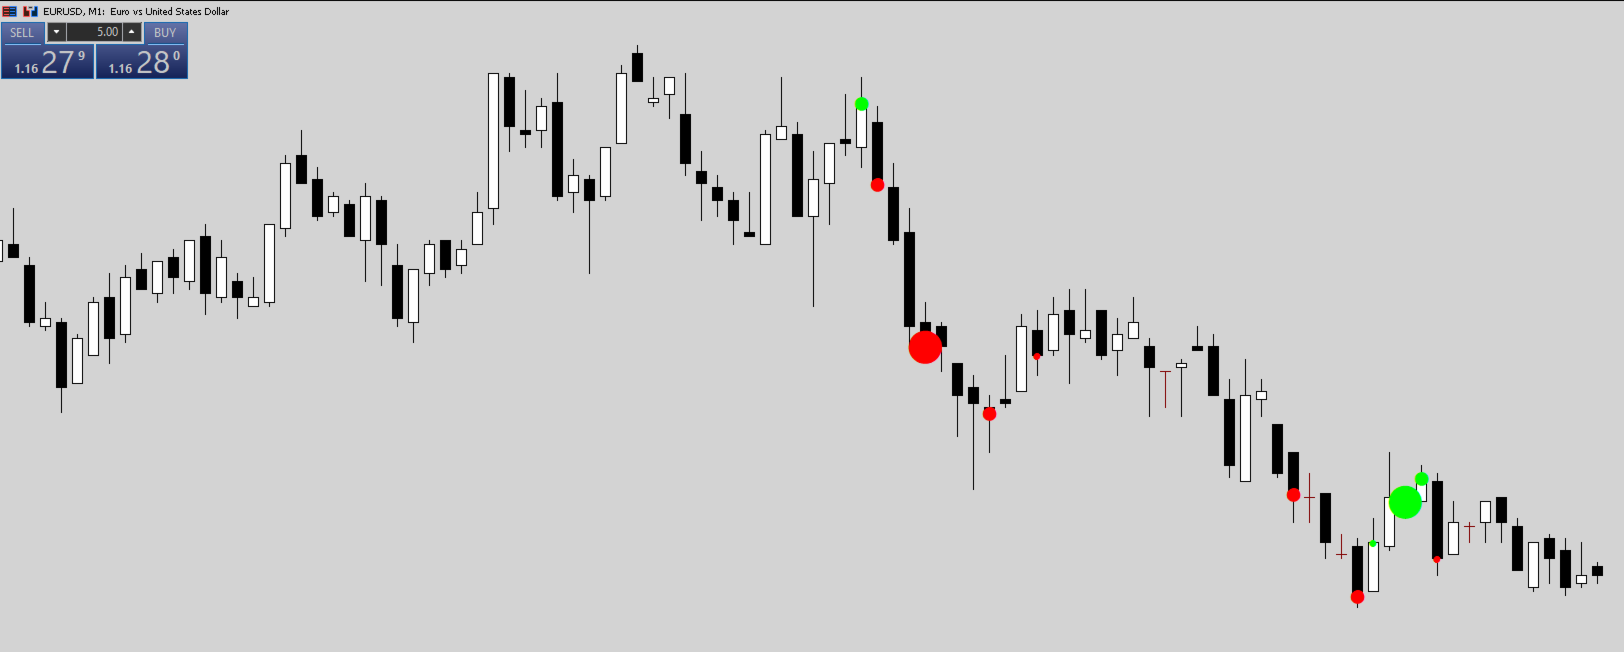
Uno strumento visivo semplice che mostra quadrati colorati sul grafico quando il prezzo rallenta improvvisamente accompagnato da un picco di volume.
(Funzione di riempimento con effetto bolle concentriche)
Aiuta a individuare i momenti chiave in cui il mercato si prepara a muoversi.
Cosa fa l’indicatore:
-
Rileva i momenti in cui il mercato “esita” prima di muoversi
-
Mostra dove entra grande volume senza variazioni significative di prezzo
-
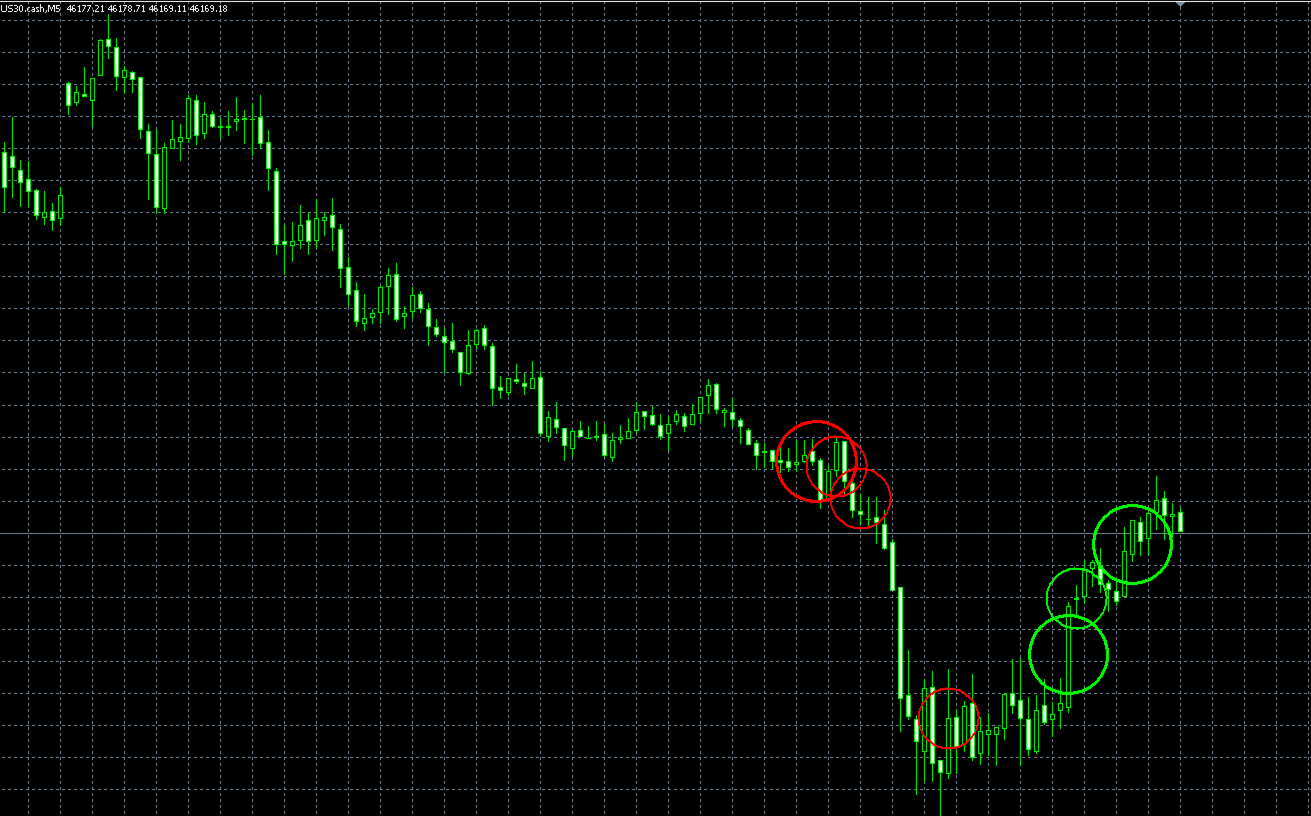
Aiuta a prevedere possibili breakout o inversioni
Come funziona:
-
Analizza timeframe più piccoli rispetto al grafico attuale
-
Rileva candele anormalmente piccole (rallentamento del prezzo)
-
Verifica la presenza di volumi insolitamente alti (picco di volume)
-
Mostra quadrati verdi (rialzisti) o rossi (ribassisti)
Impostazioni principali:
-
Sensibilità del prezzo: più basso è il valore, più sensibile è la rilevazione
-
Moltiplicatore di volume: più alto è il valore, più selettiva è l’analisi
-
Dimensione delle bolle: regola la visibilità dell’indicatore
Perché è utile:
-
Semplice e visivo
-
Nessun calcolo complicato
-
Evidenzia configurazioni di mercato interessanti
-
Completamente personalizzabile
Perfetto per il trading in range, i breakout o per comprendere meglio la dinamica del mercato.