Range Exhaustion MT5
- Indicatori
-
Robert Gerald Wood
 Sviluppatore di software professionista da oltre 25 anni, ora costruisce strumenti per me stesso e li condivide con la comunità più ampia.
 - Versione: 1.0
- Attivazioni: 10
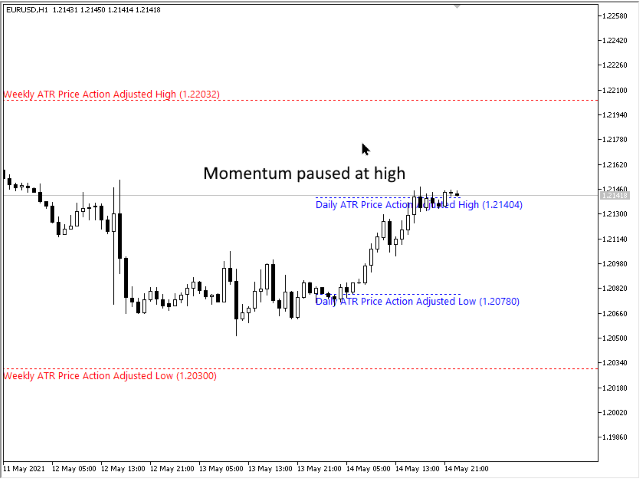
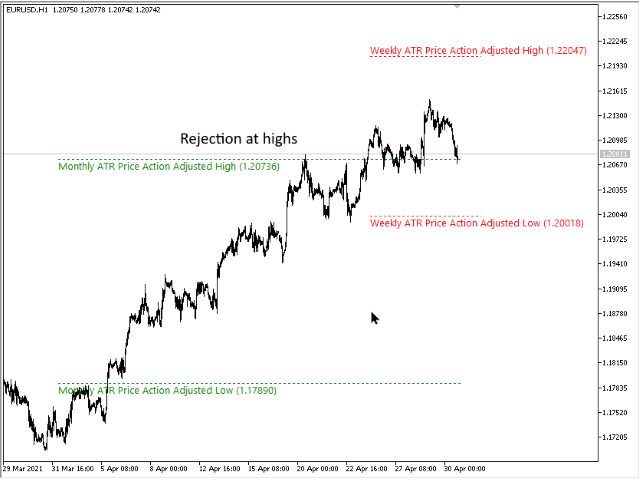
L'esaurimento dell'intervallo si verifica quando il prezzo raggiunge o supera l'intervallo previsto per il periodo corrente. A questi livelli, il prezzo inizia a perdere slancio rispetto all'inizio del periodo, quindi è un buon punto per assicurarsi di non assumere nuove posizioni.
Questo indicatore ti mostrerà dove è probabile che ciò accada sul tuo grafico, mostrando i livelli per periodi giornalieri, settimanali e mensili.
Quando vedi che il prezzo supera questi livelli di esaurimento, ti sta dicendo che lo slancio dietro la mossa è molto forte e probabilmente si sta dirigendo verso il livello temporale più alto.
L'indicatore può utilizzare il calcolo dell'Average True Range (ATR) o dell'Average Range (ADR), a seconda delle preferenze. Per impostazione predefinita utilizziamo ATR poiché riteniamo che funzioni meglio sui grafici Forex, ma ADR ha un vantaggio su indici e simboli basati su azioni.
L'indicatore ha una serie di modalità di disegno, descritte di seguito, che consentono di adattarlo alle proprie esigenze.
IMPOSTAZIONI
Modalità di calcolo
Scegli tra AverageTrueRange (ATR) o AverageDailyRange (ADR) per calcolare i livelli.
Modalità disegno
L'indicatore può essere visualizzato in diversi modi.
- Disegna la linea aggiustata del prezzo - Il livello si adatta durante il periodo, in base ai massimi e ai minimi raggiunti. Questo è il metodo predefinito e più comunemente utilizzato.
- Disegna il massimo previsto - Il livello è un valore fisso, essendo la chiusura dell'ultimo periodo più o meno il valore ATR o ADR.
- Disegna entrambe le linee - Mostra entrambe le righe precedenti.
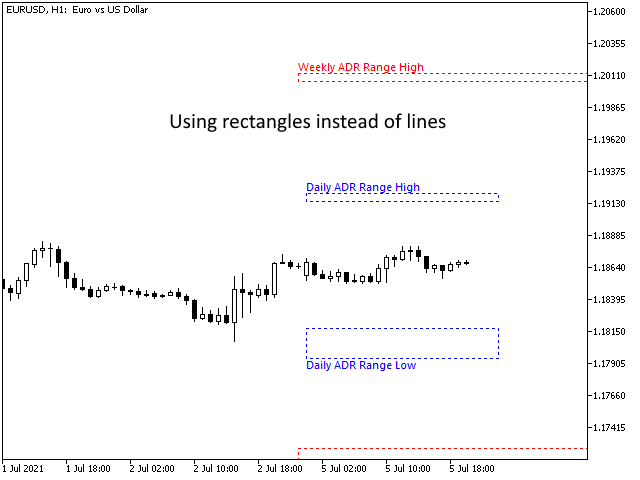
- Disegna rettangoli - Mostra un singolo rettangolo in cui le linee superiore e inferiore sono il prezzo rettificato e il massimo/minimo previsto
Periodo di revisione
Il periodo da utilizzare per il calcolo dei valori ATR/ADR.
MostraDailyLimits
Quando vero, disegna i livelli di esaurimento giornaliero.
Mostra limiti settimanali
Quando vero, disegna i livelli di esaurimento settimanale.
Mostra limiti mensili
Quando vero, disegna i livelli di esaurimento mensile.
Mostra Descrizioni
Se vero, disegna etichette descrittive per i livelli. Se falso, viene tracciata solo la linea, ma le linee hanno dei suggerimenti se hai bisogno di sapere cosa rappresentano.
MostraPrezzoInDescrizione
Se vero, il valore del livello verrà aggiunto alla descrizione e al tooltip.
DescrizioneFontSize
Dimensione del carattere da usare quando si disegnano le descrizioni
EstendiLinee
Quando vero, invece di tracciare le linee fino alla fine del periodo, le linee si estendono a destra del grafico all'infinito.
Appaiono le seguenti impostazioni per ogni fascia oraria, D1, W1 e MN1
XX_Colore
Il colore da utilizzare quando si disegnano le linee e la descrizione
XX_LineWidth
La larghezza della linea da disegnare. Se LineStyle è diverso da Solid, questo valore viene ignorato. Solo le linee continue possono avere una larghezza su MetaTrader.
XX_LineStyle
Il tipo di linea da tracciare dalla selezione standard.