Guarda i video tutorial del Market su YouTube
Come acquistare un Robot di Trading o un indicatore
Esegui il tuo EA
hosting virtuale
hosting virtuale
Prova un indicatore/robot di trading prima di acquistarlo
Vuoi guadagnare nel Market?
Come presentare un prodotto per venderlo con successo
Nuovi indicatori tecnici per MetaTrader 5 - 17
Turn your chart into a professional trading dashboard that shows where price is flowing and when the next shock is coming —without loading a single extra window. This indicator combines a price-following MA ribbon with a live news radar directly on the chart, giving you both trend and event risk in one glance. Trend Ribbon – Read the market bias instantly A smooth, step-style moving average ribbon follows price action bar by bar. Color change shows the active trend: aqua for bullish flow , gold

This indicator will help traders quickly identify inside bars, which are often used in price action trading strategies as potential consolidation or continuation patterns. An inside bar formation is a counter trend candle on both sides as it didn't break the previous candle high or low.
Key feature: Identify inside bars in real-time. Colours inside bars while keeping normal bars. Configurable history bars. Optional pop-up alerts and phone notifications with symbol name and time of detection. W
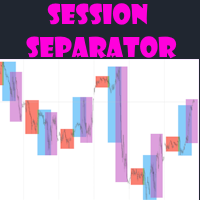
Session separator indicator draws boxes for each trading session to show the trader open and close hours with its high and low.
Key features: Option to set hours and colours for 3 trading sessions. Boxes update immediately when breaking out of high/low. Hour shift or auto time zone. Choose the amount of days to draw session boxes. Indicator works on H1 and lower for visibility. Choose border style
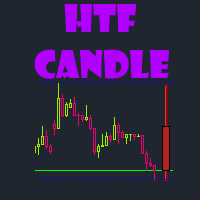
HTF Candle helps traders by drawing selected higher timeframe candle on your open chart.
This way it is easier to manage your bias without having to switch time frames which costs time. Key features: Select the higher time frame to retrieve data from. Enter the amount of candles to draw Personalize the drawn candle colours Optional horizontal lines for high and low Works on any time frame
FRAMA Matrix Pro is a multi-layer trend and momentum intelligence panel designed for traders who demand clarity, precision, and confirmation before entering the market.
The system combines several advanced filters into one clean, informative dashboard: FRAMA Trend Engine (fast adaptive trend detection) Dual EMA Bias Structure (20 & 200) ADX Strength Filter RSI Directional Bias Force Index Volume-Price Power ATR Candle Structure Analysis Fractal Dimension (D) Noise Filter Stochastic PRO Logic FRA
SuperTrend Pro MT5 - The Ultimate Trend Following System
Unlock the full potential of the SuperTrend indicator on MetaTrader 5. Designed for serious traders who need precision and performance. SuperTrend Pro MT5 is a next-generation trading system built for the modern trader. It combines the proven reliability of the classic SuperTrend with advanced Multi-Timeframe (MTF) analysis and Smart Filtering to give you the highest probability setups on the powerful MT5 platform. Why SuperTrend Pro
This is SMC rules based swing structure tool wich help you to analyze the swing points and stay up-to-date about market structure in real time for batter trade decisions making about buy sell its easy to use and great thing is this you dont need to do any manual drawing for this it will auto analyzes the chart key swing points and print labels on it to know the exact level and about it with a tiny dot its bullish or bearish swing
Indicator shows balance curves based on magic number for portfolio analysis. It allows to visually estimate different strategies performance on a single symbol. Any of magic number can be hidden by clicking on the value in legend. Parameters: HideAllOnStart - all magics are hidden and can be activated by clicking on its value; MAMode - shows average profit from trades; MAPeriod - Moving average period; Magics - a string with magic numbers separated by comma like "1,2,123". If this field is empty

Overlay higher timeframe candles onto the lower timeframe candles for both live time trading and back testing to see how higher timeframe candles are formed with lower timeframe candles. Helps traders to see the multi timeframe alignment between timeframes in each moment to find refined entry within market structure. Give the trader a full view of price across all timeframes by just looking at one timeframe.

Key Features Visual Risk/Reward Planning Spawns interactive rectangles on the chart for Buy and Sell setups. Pink Box: Represents your Risk (Entry to Stop Loss). Green Box: Represents your Reward (Entry to Take Profit). The Green box automatically adjusts its size based on your preferred Reward Ratio (e.g., 1:2). Auto-Lot Calculation Automatically calculates the correct Lot Size based on your Account Balance and defined Risk Percentage. Takes into account the symbol's Tick Value and Cont
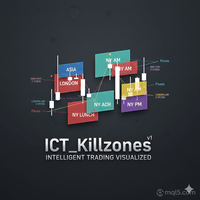
ICT Kill zones Professional Automate your ICT & Smart Money analysis with precise, dynamic session tracking and liquidity pivots. Product Description Stop wasting time drawing boxes and lines every single day. ICT Killzones Professional is the ultimate session management tool designed specifically for traders utilizing Inner Circle Trader (ICT) concepts, Smart Money Concepts (SMC), and Liquidity-based strategies. This indicator automatically highlights the key trading sessions— Asia, London,

Liquidity Channels Pro MT4 HERE is a sophisticated Smart Money Concepts (SMC) tool designed to automate the identification of Buy Side Liquidity (BSL) and Sell Side Liquidity (SSL) . Unlike standard support and resistance indicators, this tool doesn't just draw lines; it projects dynamic expanding channels based on volatility (ATR) from key pivot points. Crucially, it follows the "Mitigation" logic used by institutional traders: once liquidity is taken (price touches the level), th
N/B: All our product purchase comes with our free ‘’DAILY SCALPER EA’’ - bit.ly/4qlFLNh Whatsapp Developer for yours after successful purchase
Premium Breakout Scanner Indicator: Your Institutional-Grade Breakout Trading System
DISCOVER HIGH-PROBABILITY BREAKOUTS BEFORE THEY HAPPEN
THIS IS A FOUR-CANDLE BREAKOUT STRATEGY/SYSTEM WITH 70%+ ACCURACY .
Tired of missing breakout moves? Entering too late? Getting stopped out by false breakouts? The Premium Breakout Scanner combines instit

Order Blocks SMT is not “just another indicator”.
It’s the tool that lets you read institutional order flow and make decisions with the same logic used by banks and funds – directly in MetaTrader 5 (MT5) . What this MT5 Order Blocks Indicator Does for You With Order Blocks SMT (an advanced Smart Money / ICT Order Blocks indicator for MT5), you can: Stop guessing supply & demand and start trading clear, objective, repeatable levels . See on one chart the Order Blocks from up to 4 timeframes (M15,

Product Overview:
Extreme Confirmation is a sophisticated oscillator designed to filter market noise and provide clear, visual confirmation of trend direction and potential reversal points. By combining dual-period momentum analysis with a dynamic signal cloud, this indicator helps traders identify high-probability entry and exit zones. Key Features: Dual-Line Crossover: Utilizes a Fast (13) and Slow (34) period calculation to identify trend shifts early. Dynamic Momentum Cloud: The colored

VWAP WAVE [Riz] - MT5 Indicator Advanced VWAP Divergence Detection System
VWAP Wave is a professional-grade Volume Weighted Average Price indicator with built-in divergence detection system. It identifies high-probability reversal and continuation signals by analyzing price-VWAP relationships across multiple timeframes.
FREE
Overview QuantumEdge Oscillator is a professional-grade trading indicator that combines advanced momentum analysis with sophisticated trend detection algorithms. This 30-day trial version provides full access to all features, allowing you to thoroughly test its capabilities in live market conditions before making a purchase decision. Key Features Dual-Signal System : Combines RSI moving average with smoothed ATR-based volatility bands Multi-Timeframe Analysis : Built-in support for higher timefr
FREE

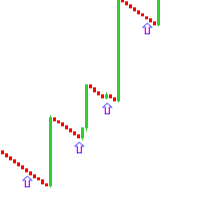
Point and Fignure (P&F) chart plots price against changes in direction by plotting a column of Xs as the price rises and a column of Os as the price falls.
Features Support for several kinds of price types - High/Low and Close. Clean and easy-to-read chart. Displays column high and low prices as indicator values. Support for both 4 and 5-digit brokers. Customizeable colors.
Advantages Filter insignificant price movements and noise. Less noise and more stable work. Focus on important price move
Smash FX System — Inside-Bar Breakouts, Reversals & Continuations (Indicator) Tagline: Smash the noise, catch the clear moves — high-clarity inside-bar breakout, reversal and continuation arrows designed for clean entries and professional journaling. Short promo Smash FX System pinpoints high-probability inside-bar breakouts, smart reversals and continuation setups with on-chart arrows and exact levels — built for traders who want clear, repeatable setups and perfect order-management handoffs f
Session Range Pro – Professional Session & ADR Analytics for MetaTrader 5 See what really moves the market – by session, by day, with stats that actually matter. What is Session Range Pro? Session Range Pro is a professional-grade MetaTrader 5 indicator that highlights the true behavior of price during the three main trading sessions: Asia London New York It draws clean, color-coded session ranges directly on your chart, and powers them with deep statistics : average session range, breakout win
Overview QuantumEdge Oscillator is the ultimate momentum and trend detection tool for serious traders. After extensive testing and refinement, this professional indicator delivers reliable signals across all market conditions and timeframes. Used by discretionary traders and algorithmic systems worldwide. Advanced Algorithm The indicator employs a sophisticated dual-layer approach: Primary Engine : Exponential moving average applied to RSI for smooth momentum tracking Volatility Adjustment : Smo
LES PIDO POR FAVOR QUE CUANDO ADQUIERAN EL PRODUCTO SE COMUNIQUEN CONMIGO PARA DARLES LOS PARÁMETROS CORRECTOS
Este indicador de trading funciona en los pares de índices sintéticos; Boom 1000, boom 900, boom 600, crash 1000, crash 900, crash 600 , en la temporalidad de M1 y este indicador es mas preciso con indicador y para obtenerlo te puedes comunicar al 0967713191 te obsequiare dos indicadores por la compra de este. Este indicador sirve para cazar picos y si quieres mas precisión y confian

VISUAL THEME SWITCHER PRO v3.2
Professional chart theme switcher for MetaTrader 5 with advanced features and multi-language support.
KEY FEATURES: • 9 Professionally Designed Themes • Drag & Drop Panel Interface • Multi-language Support (5 languages) • 7-Day Fully Functional Trial • Fullscreen Mode Toggle • Auto-Generated Theme Buttons • Professional Security System • Position Restoration • One-Click Theme Application
PROFESSIONAL THEMES INCLUDED: 1. NEON - Futuristic black and gree

Fast Multi-Timeframe Pivots – Precision Levels from M1 to W1 • Ultra-fast pivot detection across M1–W1
• Clean, stable architecture with zero repaint
• Perfect for breakout, trend, and reversal strategies
• Automatic color-coded levels for instant clarity
• Works on all assets: Forex, Crypto, Metals, Indices
• Lightweight design – ideal for real & prop-firm trading Fast Multi-Timeframe Pivots (M1 to W1) A high-performance pivot indicator designed for professional traders, automated systems, and

MercariaPattern1-2-3 відстежує рух ціни, знаходить трьоххвильові структури 1-2-3 та підсвічує момент, коли сценарій підтверджується пробоєм ключового рівня. MercariaPattern1-2-3 tracks price movement, detects three-leg 1-2-3 structures and highlights the moment when the scenario is confirmed by a key level breakout. Індикатор збирає локальні свінги в компактну фігуру 0–1–2–3 , чекає підтвердженого пробою та будує стрілку входу з готовими рівнями SL/TP. The indicator combines local swings into a
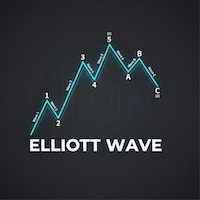
Teoria delle Onde di Elliott Automatizzata 1. Conteggio automatico e riduzione della soggettività Onde d'Impulso (1-2-3-4-5): Usa regole rigide per mostrare la struttura corretta. Onde Correttive (A-B-C): Aiuta a trovare opportunità di rientro nel trend. 2. Analisi Multi-Grado Analizza 3 livelli: Minor: Movimenti rapidi. Intermediate: Trend principale. Primary: Quadro generale. 3. Obiettivi di prezzo e Ingresso Proiezione di Fibonacci: Calcola i target futuri. Linee di Breakout: Mostra dove entr
CLICCA QUI PER VEDERE TUTTI I MIEI PRODOTTI GRATUITI
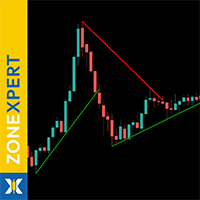
ZoneXpert è il tuo analista visivo di mercato per MetaTrader 5 - sviluppato per rilevare automaticamente le zone di Support e Resistance , evidenziarle con colori e aggiornarle in tempo reale. L’indicatore analizza strutture di prezzo, massimi, minimi e aree di volume per mostrarti esattamente dove il mercato reagisce - e dove rompe i livelli. Con ZoneXpert vedi immediatamente dove si accumulano le forze di mercato - e operi nei punti in cui
FREE
CLICCA QUI PER VEDERE TUTTI I MIEI PRODOTTI GRATUITI
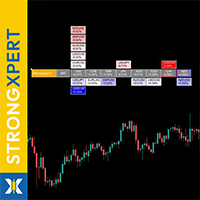
StrongXpert è il tuo strumento preciso per monitorare in tempo reale la forza delle valute nel mercato globale. È stato sviluppato per mostrarti dove il capitale sta realmente entrando - e da dove sta uscendo dal mercato . L’indicatore misura la forza relativa delle otto principali valute (USD, EUR, GBP, JPY, AUD, CAD, CHF, NZD) e trasforma movimenti di prezzo complessi in un pannello visivo semplice e leggibile - direttamente sul grafico. I
FREE
Multi-Currency Strength Dashboard PRO MT5 (v2.6) – Misuratore di forza delle valute con dashboard visiva Multi-Currency Strength Dashboard PRO è un indicatore per MetaTrader 5 che misura in tempo reale la forza relativa di 8 valute principali (USD, EUR, GBP, JPY, CHF, CAD, AUD, NZD) analizzando fino a 28 coppie Forex (in base ai simboli disponibili presso il tuo broker). L’obiettivo è fornire una visione rapida e strutturata della forza/debolezza delle valute, aiutando a selezionare le coppie da

Market Time Watch Un outil de suivi du temps léger, propre et essentiel pour chaque trader Market Time Watch est un affichage professionnel du temps sur graphique, conçu pour les traders qui ont besoin de voir l’heure locale, l’heure du serveur et le compte à rebours de la bougie en cours. Tout cela directement sur le graphique, sans interface lourde ou encombrée. Que vous fassiez du scalping, du day trading, du trading sur les news, ou que vous ayez simplement besoin d’une référence temporelle
FREE

Smart Risk Manager Pro – Trada con fiducia trascinando sul grafico Smart Risk Manager Pro è uno strumento professionale di gestione del rischio sul grafico che calcola la dimensione della posizione in base al tuo rischio in dollari. Ti basta cliccare e trascinare sul grafico e l’indicatore mostra immediatamente: Direzione (Buy / Sell) Distanza in punti Lotto consigliato in base al valore di RiskUSD Lo strumento è ultra leggero, estremamente veloce ed è pensato per i trader che vogliono un grafic

King Smart Liquidity MT5 è un indicatore analitico avanzato progettato specificamente per tracciare i flussi di denaro istituzionali e le grandi banche nel forex, oro, indici, Bitcoin e altri mercati. Questo indicatore è stato sviluppato sulla base della metodologia "Smart Money Concept", che si basa sulla comprensione dell'azione del prezzo, delle zone di liquidità e di come si comportano le principali istituzioni finanziarie nel mercato. Questo indicatore non si limita a disegnare linee o zon
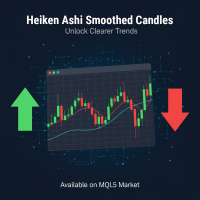
Indicatore Heiken Ashi Smoothed per MT5 Heiken Ashi avanzato con filtro di smoothing. Riduce il rumore, elimina falsi segnali e individua trend precocemente. Ideale per Forex, indici e crypto (H1-D1). Come funziona e come viene levigato? L'Heiken Ashi tradizionale calcola le candele mediando i valori di apertura, chiusura, massimo e minimo dei periodi precedenti, riducendo già l'impatto delle fluttuazioni minori. Tuttavia, l' Heiken Ashi Smoothed eleva questo approccio applicando un filtro di le
FREE
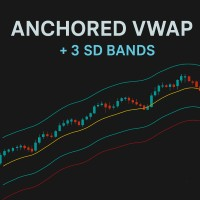
VWAP Ancorato (AVWAP) con Bande di Deviazione Standard – MT5 Porta il tuo trading al livello successivo con VWAP ancorati precisi, arricchiti da bande dinamiche di deviazione standard. Progettato per trader che richiedono velocità, chiarezza e informazioni operative sul mercato. Caratteristiche principali: Molteplici ancore: Aggiungi VWAP illimitati con date e orari di inizio personalizzati. Bande Std Dev avanzate: Fino a 3 bande per VWAP con moltiplicatori completamente regolabili per un’analis
FREE

NeoBull Predictive Ranges è un sistema completo di analisi tecnica per MetaTrader 5. Combina calcoli avanzati di volatilità con un'analisi dei trend basata sui volumi. Questo strumento è stato progettato per fornire ai trader informazioni precise sulla struttura del mercato e sull'Order Flow. Offro questo strumento professionale gratuitamente alla community. Dettagli Tecnici: Predictive Ranges: L'indicatore proietta zone di supporto e resistenza adattive basate sull'ATR. Volumatic VIDYA: Il cuor
FREE
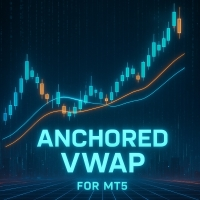
Anchored VWAP (AVWAP) per MT5 Aggiungi facilmente più linee Anchored VWAP su un singolo grafico con ancore di data e ora precise. Progettato per i trader che vogliono un’analisi veloce, chiara e flessibile dei livelli chiave di prezzo. Caratteristiche principali: Ancorare più VWAP per grafico Impostare data e ora di inizio personalizzate per ogni linea Interfaccia intuitiva e facile da usare Ideale per il trading intraday e swing Analizza le tendenze, identifica supporti/resistenze dinamici e pr
FREE

[ Il mio canale ] , [ I miei prodotti ] Il Lorentzian Distance Classifier è un indicatore di trading basato sul machine learning che utilizza la distanza di Lorentz come metrica principale all’interno del framework degli Approximate Nearest Neighbors (ANN). Invece di fare affidamento sulla tradizionale distanza euclidea, tratta l’azione dei prezzi finanziari come se avvenisse in uno spazio “distorto” prezzo-tempo (simile al modo in cui gli oggetti massicci curvano lo spazio-tempo nella relativit

Indicatore di segnali per opzioni binarie, che può essere applicato in modo efficace anche sul Forex e su altri mercati. È adatto al trading a griglia di breve periodo su M1–M5 e include segnali per l’aumento graduale delle posizioni. L’indicatore utilizza un’adattività a due livelli: un profilo di velocità di base (impostazione “veloce/morbido” fin dall’inizio) e un’auto-adattamento basato sui risultati delle operazioni, che regola i filtri in base al mercato corrente tenendo conto delle serie
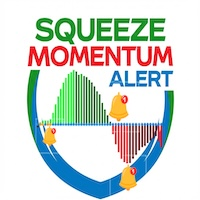
Squeeze Momentum Alert 1. Identifica i Punti di "Esplosione" del Prezzo (The "Squeeze") Il vantaggio principale è la capacità di catturare i momenti di "consolidamento" prima di un grande movimento. Perché è utile: Lo strumento ti dice: "Il grafico si sta comprimendo, preparati al prossimo scatto" , assicurandoti di non perdere l'inizio di un trend. 2. Distingue la "Forza" del Trend (Color Coded Momentum) L'istogramma usa 4 colori : Verde Lime (Lime): Rialzo forte. Verde Scuro (Dark Green): Rial
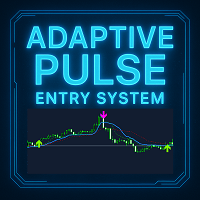
Adaptive Pulse - Sistema Professionale di Segnali di Trading Descrizione Breve Adaptive Pulse è un indicatore professionale di segnali di trading basato sulla tecnologia di analisi adattiva del mercato. L'indicatore si adatta automaticamente alla volatilità e genera segnali precisi di acquisto e vendita con frecce visive sul grafico. Funziona su tutti i timeframe e strumenti finanziari. Caratteristiche Principali L'indicatore fornisce un sistema di analisi a tre livelli con tre linee adattive in

Adaptive NeuroMatrix Trend è un indicatore di direzione del prezzo che utilizza un modello matriciale adattivo invece dei classici MA/RSI/MACD. I segnali vengono generati sulle caratteristiche quantitative del movimento dei prezzi e dei volumi. Sul grafico sono presenti tre stati: Buy / Flat / Sell; i segnali vengono fissati alla chiusura della barra (senza repaint), il che semplifica il controllo e l’analisi delle operazioni. Caratteristiche principali Modello adattivo proprietario al posto dei
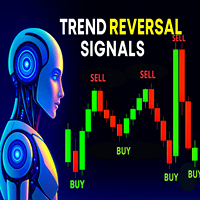
TREND REVERSAL SIGNALS – segnali precisi di inversione di tendenza TREND REVERSAL SIGNALS è un indicatore avanzato progettato per identificare i punti di inversione del trend con la massima precisione. Analizza i dati di prezzo (OHLC) e riconosce le principali formazioni di candele che segnalano possibili cambiamenti di direzione. Combinando price action, volatilità (ATR) e struttura del mercato, fornisce chiari segnali di ACQUISTO o VENDITA direttamente sul grafico. Fondamenti analitici:

AutoLevels – Rilevamento intelligente di supporti e resistenze AutoLevels è un indicatore avanzato che identifica automaticamente le zone chiave del mercato utilizzando i dati del grafico in tempo reale. Analizza i punti di swing (massimi e minimi locali) , la volatilità del mercato (ATR) e le reazioni ripetute del prezzo per individuare livelli di supporto e resistenza affidabili. Basato su: Swing High e Swing Low con sensibilità regolabile (LeftBars e RightBars) Larghezza dinamica delle

AutoLevelsPro — un indicatore che analizza i dati di prezzo e segna automaticamente zone di supporto e resistenza .
È stato progettato appositamente per funzionare su timeframe bassi , in particolare sul grafico a 15 minuti , dove il mercato mostra le reazioni più dinamiche. Dati utilizzati: High — prezzo massimo della candela Low — prezzo minimo della candela Close — utilizzato per il calcolo dell’ATR Timestamp di ogni candela per posizionare correttamente le zone ️ Processo di
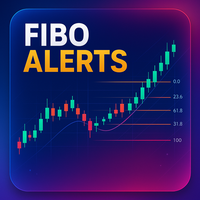
Fibonacci Alerts è un indicatore che invia un avviso e una notifica al tuo cellulare quando il prezzo raggiunge un livello di Fibonacci. Puoi scegliere il livello a cui verrà attivato l'avviso. Funziona su tutti i mercati e su tutti gli intervalli temporali e include anche uno strumento di gestione del rischio.
Caratteristiche:
- Funziona su tutti i mercati e su tutti gli intervalli temporali.
- Può essere visualizzato su più grafici contemporaneamente.
- Livello di Fibonacci selezionabile.
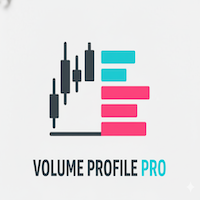
Indicatore Volume Profile Pro Questo indicatore è lo strumento Volume Profile Pro , che aiuta ad analizzare "a quale prezzo avviene la maggiore attività di trading". Presenta le seguenti capacità speciali: Modalità di Visualizzazione (Display Modes) Volume Profile (Normale): Mostra il volume totale degli scambi (Total Volume) a ogni livello di prezzo per identificare zone chiave di supporto e resistenza. Delta / Money Flow: Mostra la "differenza" tra pressione di acquisto e vendita (Buy vs Sell)

SISTEMA DI PUNTEGGIO DI MERCATO – Indicatore Avanzato Multi-Timeframe Sistema professionale di analisi del mercato che combina indicatori tecnici, modelli di machine learning e conferme multi-timeframe per generare segnali di trading estremamente accurati. CARATTERISTICHE PRINCIPALI Analisi Multi-Timeframe:
Conferma dei segnali su diversi timeframe (M5, H1) per una maggiore probabilità Motore di Punteggio Intelligente:
Calcolo di trend, range e incertezza analizzando le ultime 25 candele Rilev
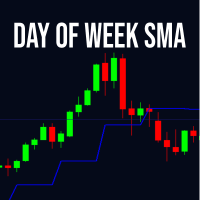
L'indicatore SMA del Giorno della Settimana calcola una media mobile basata sui prezzi di chiusura di un giorno specifico della settimana scelto dall'utente. Supporta vari tipi di medie mobili tra cui Semplice (SMA), Esponenziale (EMA), Smussata (SMMA) e Ponderata Lineare (LWMA). Il periodo definisce quante istanze del giorno selezionato includere nel calcolo. Questo strumento è utile per analizzare i pattern settimanali nei mercati finanziari, aiutando i trader a identificare trend specifici di
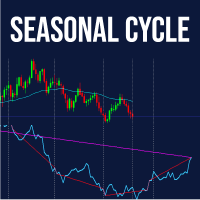
Seasonal MT5 Indicator Scopri la potenza della stagionalità del mercato con l’indicatore Seasonal MT5, progettato per il timeframe giornaliero. Analizza e visualizza schemi di prezzo ricorrenti basati su dati storici. Funzionalità principali: Traccia una linea di tendenza stagionale basata su dati giornalieri. Mostra una linea retta tra gli estremi stagionali. Disegna linee mensili per evidenziare variazioni cicliche. Linea verticale personalizzabile per il giorno attuale. Dati normalizzati in f
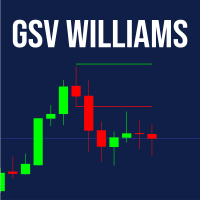
GSV – Guided Swing Value Levels Il GSV – Guided Swing Value Levels è un indicatore esclusivo sviluppato per i trader che desiderano individuare aree di prezzo in cui il mercato tende a reagire con maggiore precisione statistica.
Il suo calcolo è ispirato ai concetti presentati da Larry Williams nel libro “Long-Term Secrets to Short-Term Trading” , dove viene evidenziata l’importanza della media statistica degli swing del mercato per prevedere zone in cui il prezzo probabilmente si fermerà, corre
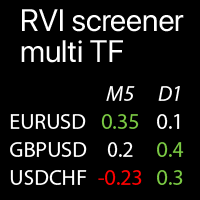
Valori RVI multi-timeframe sui Simboli selezionati: confronta le tendenze attuali del mercato L' indicatore mostra i valori dell'Indice di Vigore Relativo (RVI) da tutti i timeframe e Simboli selezionati in una singola tabella , che ti consente di analizzare rapidamente le tendenze attuali dei prezzi di mercato . La mia utilità multifunzionale : 66+ funzionalità | Contattami per qualsiasi domanda | Versione MT4 Ogni Simbolo può esse
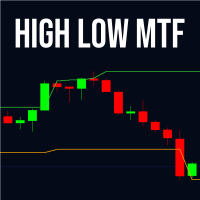
High Low MTF – Massimi e Minimi Multi-Timeframe High Low MTF è un indicatore professionale che consente ai trader di visualizzare potenti aree di supporto e resistenza basate sui massimi e minimi di qualsiasi timeframe. Mostra questi livelli provenienti da periodi più alti o più bassi direttamente nel grafico corrente, fornendo una visione completa del mercato su più timeframe. È adatto per scalping, day trading, swing trading e anche per sistemi algoritmici tramite iCustom. L’indicatore identif
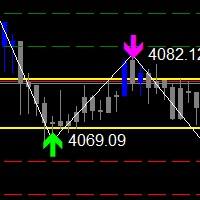
The Zigzag Price Arrow indicator is an enhanced version of the classic Zigzag indicator, combining the traditional zigzag pattern with advanced visual features. It not only identifies major market turning points but also provides clear trading signals through: • Directional arrows: Displays colored arrows (green for buy, magenta for sell) indicating potential trend directions.
• Price labels: Shows the exact price values at each pivot point directly on the chart.
• Improved visual clarity: Make
FREE
Red and Green Light – Intelligent Trading Signal Indicator Product Overview Red and Green Light is a professional trading signal indicator based on the multi-stage T3 smoothing algorithm. It integrates a visual traffic light system, intelligent signal recognition, risk alerts, and multiple notification features. Whether you're a manual trader or an Expert Advisor (EA) developer, this indicator helps you capture market opportunities with greater precision and effectively avoid the risks of
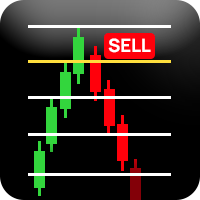
️ IMPORTANT: EVALUATION VERSION - LIMITED SYMBOL SUPPORT This indicator is currently available for EVALUATION PURPOSES ONLY and supports only: EURUSD Volatility 50 (1s) Index The indicator will not function on any other trading symbols. Richchild Quarters Theory Indicator EVALUATION Professional Market Structure Analysis Tool Overview This is a professional trading indicator designed to analyze market structure using dynamic range calculations and quarter-based price analysis. The indicator
FREE
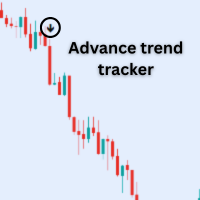
Features: 1. Buy arrows= when Up trend start. 2.Sell arrows = when Down trend start 3.Alert System= when Signal appear then Mt5 itself Pop up a alert Box. 4. You can get notifications on your phone real time through Mt5 app.
Note: this indicator will work on trending market. So try to trade volatile market.
Best Pair: Only trade in New York session NASDAQ (US100) S&P ( US500) Dow Jones (US30)
Note : Don't Trade Forex pair.
FREE

Enigma 112 Indicator - User Manual Enigma 112 Indicator Complete User Manual - Ultimate Trading Solution Introduction The Enigma 112 is a comprehensive multi-timeframe trading indicator that combines advanced technical analysis concepts including Tesla 3-6-9 Gates, Huddleston Theory, PO3 Dealing Ranges, and sophisticated risk management systems. Tesla 3-6-9 Gates Based on Nikola Tesla's vortex mathematics for precise support and resistance levels Huddleston Theory Volume-based market

**“Multi Trendline Channel With Regression Bands” – Linear Regression Channel + Standard Deviation Band Indicator (MT5)**
This indicator automatically plots multi‑period linear regression channels together with standard deviation bands, giving traders instant clarity on trend direction, price dispersion, and key support/resistance zones. By turning complex analysis into simple, intuitive visuals, it provides discretionary traders with a clear market context at a glance.
### Key Features
FREE
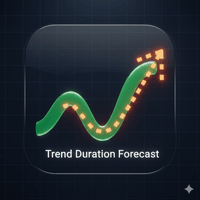
Trend Duration Forecast It utilizes a Hull Moving Average (HMA) to detect trend direction and statistically forecasts the probable duration of the current move based on historical market behavior. Key Features Smooth Trend Detection: Uses the Hull Moving Average (HMA) to filter noise while minimizing lag, providing clean Bullish/Bearish signals. Real-Time Duration Counter: Displays a dynamic label at the start of the current trend showing the "Real Length" (number of bars the trend has b
FREE
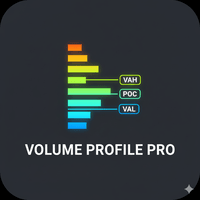
Daily & Composite Volume Profile This is a professional-grade market profile tool designed for MetaTrader 5. It utilizes a Dual-Profile System to visualize supply, demand, and liquidity concentrations. Key Features Left Side: Daily Session Profiles Automatically identifies the start and end of every trading day. Generates a unique Volume Profile for each individual day. Allows you to see how value migrated from yesterday to today (e.g., Is today's volume higher or lower than yesterday?).

Keltner Channels Enhanced - Professional Indicator with Alerts
Full Description:
Keltner Channels Enhanced is a professional-grade technical indicator that brings the classic Keltner Channels to a new level with advanced features and complete customization.
KEY FEATURES
Advanced Calculation Exponential Moving Average (EMA) based middle line. Average True Range (ATR) for dynamic channel width. Customizable price type (Close, Open, High, Low, Median, Typical, Weighted). Horizontal shift o
FREE

## FutureSight CCI — See Beyond, Trade Ahead
### What It Is FutureSight CCI is a next‑gen oscillator that upgrades the classic CCI. It combines trend detection, cross signals, Bollinger Bands, alerts, and logs into one powerful tool.
Paired with the **second‑chart generator**, it gives you total control of the ultra‑short‑term market. Perfect for scalping and binary options where speed and precision matter most.
---
### Highlights - **Extended CCI**: Three custom lines for deep
FREE
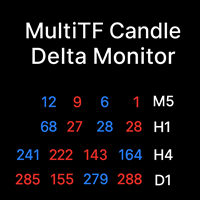
MultiTF Candle Delta Monitor — Multi-Timeframe Difference Panel (Visualizing candle changes as numeric values)
Overview: Monitor candle differences across multiple timeframes in a compact numeric panel. Each row represents a timeframe, and each cell shows the recent close-to-close difference (pips/ticks). Blue = upward, Red = downward, Gray = no change. Since it uses label rendering only, it is lightweight and does not interfere with the chart.
Key Features: - Multi-timeframe support (M1, M5,
FREE
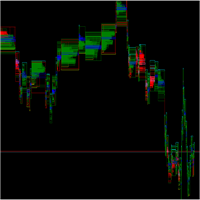
O SpreadFlow é um indicador para MetaTrader que gera um gráfico totalmente baseado no comportamento do fluxo de negócios, em vez de se limitar apenas a candles de tempo ou volume.
Ele organiza as informações de cada tick em quatro dimensões principais: Spread – monitora a diferença entre BID e ASK ao longo do tempo, mostrando momentos de compressão e alargamento do spread, associados a maior ou menor liquidez. Negócio no mesmo preço – identifica quando sucessivos negócios ocorrem no mesmo nível
FREE
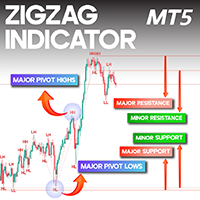
ZigZag Indicator for MetaTrader 5 The ZigZag Indicator in MetaTrader 5 is a powerful tool that highlights key highs and lows on price charts. By marking significant turning points—often referred to as Pivot Highs and Lows (HH, HL, LH, LL)—it simplifies trend identification and helps traders better understand market structure. As price moves, it naturally forms consecutive peaks and troughs, which the ZigZag makes easier to see. Correctly interpreting these pivot patterns is essential for recogni
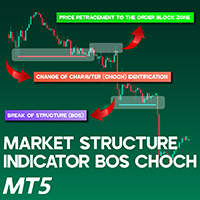
Market Structure Indicator BOS CHOCH MT5 The Market Structure Indicator (BOS-CHOCH) is an ICT-style tool built for MetaTrader 5 (MT5). It identifies both primary and secondary Change of Character (CHOCH) events and Breaks of Structure (BOS) across multiple levels, making it highly valuable for ICT and Smart Money traders. By simplifying the analysis of price behavior, this indicator enhances market structure interpretation and helps traders identify more accurate trading opportunities. Market

Candle Close Timer Matrix – MT5 Candle Countdown Indicator Candle Close Timer Matrix is a lightweight and powerful MetaTrader 5 (MT5) candle countdown indicator that shows exactly how many minutes and seconds are left before the current candle closes on any symbol and any timeframe. Live Signals & Products Whether you are a scalper , intraday trader or swing trader , knowing the exact candle close time helps you: Time your entries on candle close Avoid impulsive mid-candle decisions Sync your tr
FREE

MULTI INDICATOR SCANNER - PROFESSIONAL EDITION
PRODUCT DESCRIPTION
Multi Indicator Scanner is the most comprehensive technical analysis scanner on the market. It analyzes 10 different indicators simultaneously and provides you with clear BUY-SELL-NEUTRAL signals. No more checking dozens of indicators one by one!
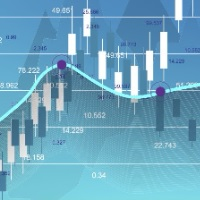
Linear Regression Channel (MTF) Indicator The Linear Regression Channel MTF is an advanced technical indicator that uses statistical analysis to plot a linear regression channel on the price chart, with the capability to display data from a different time frame (Multi Time Frame) for enhanced trend accuracy and analysis. Key Features of the Indicator: Main Line (Linear Regression Line):
Represents the overall price trend over the selected period, allowing traders to easily observe the general s
FREE
RSI Nexus Multi-timeframe (RSI-Nexus-MTF) RSI-Nexus-MTF is a multi-timeframe RSI engine designed to help algorithmic traders identify structure, context and trigger signals simultaneously. Inspired by Fractal Market Rhythm analysis, the indicator extracts the RSI trend from three layers of market flow: Long-Term Structure (HTF) Mid-Term Context (MTF) Short-Term Trigger (current timeframe) This makes the indicator especially powerful for robot developers , allowing EAs to read market conditions
MetaTrader Market - i robot di trading e gli indicatori tecnici per trader sono disponibili nel tuo terminale di trading.
Il sistema di pagamento MQL5.community è disponibile per tutti gli utenti registrati sul sito MQL5.com che effettuano transazioni su MetaTrader Services. Puoi depositare e prelevare denaro usando WebMoney, PayPal o una carta di credito.
Ti stai perdendo delle opportunità di trading:
- App di trading gratuite
- Oltre 8.000 segnali per il copy trading
- Notizie economiche per esplorare i mercati finanziari
Registrazione
Accedi
Se non hai un account, registrati
Consenti l'uso dei cookie per accedere al sito MQL5.com.
Abilita le impostazioni necessarie nel browser, altrimenti non sarà possibile accedere.