 MetaTrader 5
 专家
专家
 指标
指标
 程序库
程序库
 实用工具
实用工具
 窗口小部件
窗口小部件
 规则
规则
适用于MetaTrader 5的新技术指标 - 17
 技术指标的信号外汇和股票市场的开仓交易和平仓交易起着至关重要的作用。指标的本质就是一种交易品种的数学转换,旨在预测未来的价格变化。
测试技术指标可以更有利于预测市场行为并从中获利。
技术指标的信号外汇和股票市场的开仓交易和平仓交易起着至关重要的作用。指标的本质就是一种交易品种的数学转换,旨在预测未来的价格变化。
测试技术指标可以更有利于预测市场行为并从中获利。 
SIMBA POSITION MANAGER Trade Your Setup. Understand Your Position. You found the setup.
You opened the trade. Now what? This is where many traders struggle. Finding an entry is only one part of trading. Once a position is open, you still need to understand whether the trade is progressing, how much risk remains, when the position reaches important R-multiples, whether momentum is strengthening or weakening, and whether market conditions continue to support the trade. SIMBA Position Manager is de

**Know exactly where your grid or martingale basket blows up – before you trade it.**
Grid and Martingale Risk Simulator is a visual what-if tool for traders who use grids, martingale, averaging or hedged baskets. Place virtual BUY and SELL orders directly on the chart, drag them to any price, and the indicator recalculates your simulated account in real time: Balance, Equity, Margin, Free Margin, Margin Level, the Margin Call price and the Stop Out price.
The indicator never opens, modifies

KEYPAD SUPPORT RESISTANCE LOGIC MT5 Advanced Cluster-Based Support & Resistance • Multi-Timeframe Confirmation • Smart Market Analysis Stop relying on ordinary horizontal lines and isolated support/resistance levels. KEYPAD SUPPORT RESISTANCE LOGIC MT5 is an advanced technical-analysis indicator designed to help traders identify important support clusters, resistance clusters, market structure, trend direction, momentum and multi-timeframe confluence from one organized MT5 dashboard. Instead of

Gold Smart Entry is a chart indicator for Gold (XAUUSD) based on Smart Money Concepts (SMC) and ICT ideas. It marks liquidity sweeps, confirms the reversal that follows, and highlights the entry zone at a Fair Value Gap (FVG) or Inverted Fair Value Gap (IFVG). For every setup it draws the suggested entry price, stop level and three target levels directly on the chart. The indicator does not open or manage trades. It is a visual analysis tool that shows where a setup forms and how it developed. I

Stacked Imbalances - Footprint Order Flow Indicator Take your order flow analysis to the next level. This professional tool automatically detects and highlights Stacked Imbalances directly on the Footprint chart, helping you identify strong institutional buying and selling pressure with precision. What is a Stacked Imbalance? A standard imbalance occurs when the Bid or Ask volume at one price level is significantly larger than the opposite side, showing aggressive buying/selling.
A Stacked Imbal

Real CVD Light plots Cumulative Volume Delta as candles (Open / High / Low / Close) in a separate window. It is built tick by tick from real trade data, and it detects divergences between price and CVD. What it does Builds CVD candles from real tick flags (BUY / SELL) and real trade volume. Updates incrementally on every tick, so the live candle stays fast and accurate. Detects confirmed pivots on price (fractal highs and lows) and compares them with the CVD at the same pivots. Finds four types

Take the guesswork out of trading the London Open and high-impact news sessions. The Macro-Tech Fusion Range (MT5 Edition) is a professional-grade, custom MQL5 indicator built for serious day traders and prop-firm challengers. Important Note for Prop Firm Traders: This tool is a 100% manual decision-support indicator , not an automated Expert Advisor (EA). It complies perfectly with strict prop firm evaluation rules that ban automated trading bots. Core Features Built on Institutional Logic: Aut

ABC Breakout Pattern Finder (1-2-3 Pattern Algo) for MetaTrader 5 ABC Breakout Pattern Finder is a professional algorithmic trading indicator designed for MetaTrader 5 (converted from Pine Script v6). It automatically detects, validates, and visualizes classic 1-2-3 (A-B-C) Price Action patterns in real time, projecting dynamic entry levels, stop-loss orders, and multi-tier Fibonacci/ATR profit targets directly onto the chart.
Key Features Strict Structural Pattern Validation : Filters out fal

TrendRider MTF: Multi-Timeframe Trend & Pullback Execution System (M5 + M1) TrendRider MTF is a professional multi-timeframe signal indicator engineered for scalpers and day traders who want to catch explosive trend continuations while avoiding flat traps and whipsaws. By analyzing the broader structure on the M5 timeframe and executing precision entries on the M1 timeframe, the system synchronizes higher-timeframe momentum with micro-structure pullbacks. 100% Non-Repainting: All calculations a

SMC + Volume Profile + FVG: Indicator Guide Overview SMC + Volume Profile + FVG is an all-in-one indicator for MetaTrader 5. It combines three popular price-action tools on a single chart: Smart Money Concepts (SMC): market structure (swings, BOS, CHoCH) and Order Blocks Fair Value Gaps (FVG): price imbalances left behind by fast moves Volume Profile: where the most trading happened, shown as POC, Value Area High and Value Area Low Everything is drawn automatically. You can turn each part on or

To achieve a free-moving chart scale in MT5 similar to TradingView MT5 automatically allows you to click anywhere on the chart and drag it up/down. keeping the vertical scale constant while you move the view.
Vertical zoom (drag price axis) Dragging the price axis (right side) stretches or compresses the vertical scale. This is native MT5 behavior when scale fix is active.

Description
Range Breakout Line displays the high and low of a user-defined daily time range using broker server time. After the range forms, the indicator can extend both levels through a selected area of the day. An optional midpoint helps you see the center of the range. Use the levels to study price interaction with the range. Choose whether a level is considered reached when price touches it or when a candle closes beyond it. The indicator can recolor a reached level and send a notificat

Pro SMC Trading: Trade Like the Institutions Stop guessing where the market is going. Smart Money Trades Pro is your ultimate all-in-one trading weapon. It strips away the chaos of the markets and hands you institutional-grade setups on a silver platter. Whether you are a scalper, day trader, or swing trader, this tool automates your analysis so you can focus entirely on executing flawless, profitable trades. Why This Will Change Your Trading Game Instant Market Clarity: Automatically tracks B

EquiSentra Risk Desk Short description An MT5 risk dashboard for prop and personal accounts. Review SL/TP scenarios for open positions and pending orders, monitor configured loss limits and profit targets, and receive selectable mobile push notifications. Product description See your portfolio exposure, remaining loss allowance and profit target in one chart panel. EquiSentra Risk Desk is a MetaTrader 5 indicator designed for traders who manage prop accounts or want a clearer view of account ris
FREE

QCL Bollinger Trend Trail Follow trend direction with a clear, adaptive line directly on your price chart. QCL Bollinger Trend Trail combines trend detection with integrated volatility filtering to display a trailing reference line. Its two-color presentation helps you identify rising, falling, and unchanged trend conditions without adding a separate indicator window. The line advances as the trend develops and holds its position when conditions do not support further movement. Key Features Adap
FREE

# MiniBull Report (v1.06) — free
**Your market briefing in a sub-window. MiniBull Report answers the questions an intraday trader asks before every decision — in plain language, in your own time zone, and with the same answers on every chart timeframe.**
*Where is price against the monthly, weekly, daily and 4H trend? How far is it stretched? How much of today's typical range is used? Where are the nearest resistance and support? Is a high-impact event coming? What speaks for a long, what spe
FREE

# MiniBull Board
**Version 1.14 — MetaTrader 5 indicator (separate window)**
**11 languages: English, Turkish, Russian, Chinese, Spanish, Portuguese, Japanese, German, French, Italian, Korean** — automatically in the language of your MetaTrader terminal, or chosen with a single input.
MiniBull Board is a compact watch-list dashboard for MetaTrader 5. For every symbol you choose it shows where the price stands today, this week and this month: the current price, the day / week / month opening
FREE

Z-Score Range Boxes Breakout Z-Score Range Boxes Breakout is a statistical price-action indicator designed to identify potential reversal zones and subsequent breakouts using a smoothed Z-Score of price. The indicator calculates how far the current price has moved from its recent mean relative to its standard deviation. When the smoothed Z-Score reaches statistically extreme levels, the indicator automatically creates a range box around the price action.
MT5 Expert Advisor Collection Explore aut

Lookahead Safe RSI Divergence Detector
Most RSI divergence indicators mark a pivot the moment it looks like a swing high or low, so the last signal on the chart can silently shift or disappear as new bars form. This indicator only confirms a pivot after the number of bars set in Pivot Confirm Lag have genuinely closed, so a confirmed signal never repaints or moves.
What it detects Bearish divergence: price forms a Higher High while RSI forms a Lower High. Bullish divergence: price forms a Low

Fahmi Volume Profile Dashboard combines a session volume profile, value-area signals with stop loss and three targets, a multi-timeframe trend matrix and a built-in statistics lab that measures how the signals performed on your own chart history , so you can judge the edge before you trade it. Volume profile Session volume profile built from M1 tick volume, drawn in two colors (buying / selling volume) POC, VAH and VAL of the developing session, value area highlighted Previous session POC, VAH a

Overlay up to two other symbols on your chart as lines or candles, with a compact mini-window showing range and % change for today and two custom periods.
Symbol Compare Overlay draws up to two other symbols directly on the current chart, so you can see how gold, indices, currencies or any other instrument move against each other without switching windows.
Main features - Up to two compare symbols, each shown as a line or as candles. - Two overlay modes: - Fit to visible range: each symbol

Spread Guard Candle Timer is an essential trading utility for news traders, scalpers, and prop firm traders (FTMO, FundedNext, MFF). High spread spikes during volatile news releases like NFP, CPI, and FOMC can instantly trigger slippage or fail prop firm risk limits.
This indicator acts as your real-time risk shield and precision timekeeper directly on your chart, alerting you immediately when trading conditions become unsafe.
KEY FEATURES: - Real-time Server Time Sync: Accurately calculates

ICT Turtle Soup Advanced MT5 is a visual trading indicator designed around ICT-style liquidity concepts and the Turtle Soup reversal model. The indicator monitors the chart for a structured sequence of events: Liquidity → Purge/Sweep → Market Structure Shift → FVG → Retest → Entry Context → Standard Deviation Targets It is designed as a chart-analysis tool , not an automated trading EA. The goal is to help traders visually identify liquidity events, displacement, structure shifts, imbalances, se

THE SMASH
The Indicator That Proves Itself: Locked Out-of-Sample Validation on Real Tick Data Gold (XAUUSD) first. Nasdaq-proven. Any symbol, any timeframe.
The Smash is a developing-day breakout indicator built around the proprietary Smash Line — a daily level derived from the volume and price-action properties of the developing session. When a closed bar breaks the developing day's extreme AND holds beyond the Smash Line, the session has committed to a direction. The Smash marks that commit

Trend Target Ribbon Pro (MT5) - Advanced ALMA Trend & Target Tracker Trend Target Ribbon is a next-generation MT5 indicator that combines the advanced ALMA (Arnaud Legoux Moving Average) and ATR-based risk management to provide precise market trend visualization and automated Take-Profit (TP) / Stop-Loss (SL) levels. Most Powerfull Renko Main Chart (Working on Main Chart Not Like an Separate Window Indicator) is Aslo Available: Renko Main Chart Click Here to Download Now Advance Features: Wic

Session Flow Board A session scoreboard for XAUUSD and NAS100. One glance tells you who has been leaning on the session: buyers, sellers, or neither. It splits session tick volume into a buy proxy and a sell proxy from where each bar closed inside its range. Close near the high, the bar counts more as buy. Close near the low, more as sell. That running difference is the session CVD. What you see Session buy and session sell Session CVD and the last closed bar's delta Tilt, in percent POC, VAH an

Super SMC Indicator (Smart Money Concepts + RSI Divergence & Live HUD) Developed by Alphabet Academy Super SMC Indicator is an institutional-grade technical analysis suite engineered for MetaTrader 5 by Alphabet Academy . Combining core Smart Money Concepts (SMC) with an automated RSI Divergence detection engine and a Live Trader HUD , this system provides institutional market order flow insights without chart clutter. Optimized for Forex, Gold (XAUUSD), Indices (US30, NAS100), and Crypto market

Precision Sniper Pro: User Guide Description Precision Sniper Pro is an institutional-grade, multi-indicator trading script engineered specifically for MetaTrader 5 (MT5). It is designed to give discretionary traders, prop firm operators, and algorithmic developers a definitive statistical edge by synthesizing four foundational technical pillars: Exponential Moving Averages (EMA), Relative Strength Index (RSI), Moving Average Convergence Divergence (MACD), and Average Directional Index (ADX). M

StealthTrail SuperTrend: User Guide Description StealthTrail SuperTrend is an advanced, adaptive volatility indicator built for MetaTrader 5 that revolutionizes traditional trend-following strategies. Standard SuperTrend indicators rely on rigid, static ATR multipliers that frequently fail when market volatility shifts abruptly from low-volatility consolidation to high-volatility expansions. StealthTrail overcomes this limitation by implementing an automated smoothing and dynamic scaling framew

AK_TREND_ID_HTF Two-Timeframe Trend Radar with Instant Cross Signals Most trend tools show you one timeframe and leave you guessing about the bigger picture. AK_TREND_ID_HTF reads the trend on your chart AND a higher timeframe at the same time — and paints the line so you instantly see when both agree. One glance, full picture. One Line, Five Colors — Read the Market at a Glance GREEN — both timeframes bullish and rising: strongest momentum BLUE — both bullish but cooling: trend losing

All in One Trading Tool — Multi-Indicator Trading Assistant All in One Trading Tool is a comprehensive MetaTrader 5 indicator that combines several popular technical analysis tools into one convenient and easy-to-use interface. Instead of adding multiple indicators separately to your chart, this tool allows you to control EMA, Market Structure, Momentum, RSI, MACD, ADX, and ATR from a single interactive panel. Key Features EMA Group Display five Exponential Moving Averages directly on the mai

SMT Divergence Multi Pair compares the swing highs and swing lows of the chart symbol with up to two correlated symbols and marks where they disagree. This is the Smart Money Technique (SMT) divergence used in ICT and Smart Money Concepts trading: one market sweeps a previous high or low while its correlated market fails to confirm the move. Discount Ends Soon — Next Price: $99 HOW IT WORKS The indicator finds confirmed swing highs and lows on the chart symbol and compares each new swing with th

VectorQuant — индикатор AM QuantLab для графика. Сделок не открывает. Показывает, в какую сторону идёт тренд и где в него входить. Тренд считается по закрытию свечи. Цена выше EMA 200 — тренд вверх. Ниже EMA 200 — тренд вниз. У самой линии — флет. EMA 50 показывает короткий наклон внутри этого движения: если цена под ней и средняя за 5 свечей идёт вниз, наклон медвежий. Стрелка на графике — место входа. Она появляется, когда уверенность не ниже порога, по умолчанию 80%. Лонг отмечается только в

ALYAS Market Sentiment ALYAS Market Sentiment is a lightweight real-time market sentiment indicator for MetaTrader 5, designed to provide a quick visual overview of the current bullish and bearish pressure on the chart. Instead of relying on a single technical indicator, ALYAS Market Sentiment combines several market factors into one weighted sentiment score and displays the result in a simple Buy / Sell percentage bar . Key Features Multi-Factor Market Analysis The indicator combines six differ

EquiSentra P&L transforms your MetaTrader 5 (MT5) account history into a clean, institution-ready performance report. You can filter closed deals by any date range, review full profit-and-loss details—including swaps, commissions, and all trading costs—and export a professional PDF accompanied by CSV data and checksums for easy reconciliation and audit. The report is self-generated directly from terminal data, so it is not a broker-certified statement and is not GIPS verified, but it provides t
FREE

Set your risk before you place a trade. RiskLot shows the lot size as you move Entry, Stop Loss, and Take Profit on your MT5 chart. It is a calculator, not a trading robot. It does not open, change, or close orders. Choose risk as a percentage of balance, a percentage of equity, or a fixed cash amount. Move the Entry, Stop Loss, and Take Profit lines on the chart. See money at risk, potential reward, and the reward-to-risk ratio in one panel. Check the price distance and current spread before pl
FREE

SMC Sniper Pro MT5 SMC Sniper Pro by QuantFlow Labs is a chart indicator for liquidity-based intraday analysis. It combines session ranges, tracked liquidity sweeps and three selectable entry models in one configurable workspace. It displays setup context and entry references; it does not open, manage or close trades. Three selectable entry models Model 1 - Inverse Fair Value Gap breakout: after an eligible liquidity sweep, the indicator waits for a confirmed close through the relevant fair valu

Auto Optimized SpeedAngle 是一款机构级的动量向量化系统,通过持续的前瞻优化(Walk-Forward Optimization, WFO)彻底消除了曲线拟合(curve-fitting)。该指标没有采用在市场 状态转换时容易失效的静态输入参数,而是利用出样外验证(Out-of-Sample, OOS) dynamically 动态重新校准设置,从而确保显示的 信号代表真正的统计优势,而非历史巧合。 核心机构级架构 前瞻优化引擎(Walk-Forward Optimization Engine): 核心算法持续扫描数千种回溯周期(lookback)与阈值组合,严格将数据划分为样本内(in-sample)和样本外(out-of-sample)。只有当参数配置在未知数据环境中证明具备数学优越性时,系统才会对其进行 adoption。 量化目标函数(Quantitative Objective Functions): 优化引擎不一味追求绝对毛利,而是聚焦于机构级的稳定性指标。用户可针对系统质量数(SQN)、期望值(每笔交易的平均 R 倍数)或净 R 值进行优化,从而优

Adaptive Price Action Engine 买指标,免费送EA 自适应多时间框架趋势与K线形态智能分析系统 市场环境始终在变化,不同的市场阶段中,并非所有 Price Action 形态都具有相同的参考价值。 Adaptive Price Action Engine 旨在适应不断变化的市场条件,将 趋势结构、多时间框架分析、K线形态与统计优化 整合到一个统一的分析框架中。 两种自适应模式 Dual Alpha Trend Mode(双 Alpha Trend 模式)
自动搜索适合的 Alpha Trend 参数,并结合低周期与高周期市场结构,使指标能够根据近期市场行为动态调整趋势识别。 Candlestick + Alpha Mode(K线 + Alpha 模式)
将 Alpha Trend 市场状态与 22种多空K线形态 相结合。系统不会简单地对所有形态一视同仁,而是对不同的形态组合进行统计评估,并识别在特定市场环境下表现出更强历史统计特征的配置。 主要功能 趋势参数自动优化 多时间框架市场状态分析 22种多头与空头 Price Action K线形态 对数千种可能

Tokyo Indicator(东京指标)直观地展示了趋势方向、潜在交易信号及市场状况。 其采用颜色编码的阶梯式趋势线,以蓝色标识看涨阶段,以洋红色标识看跌阶段。配套的方向箭头会在趋势发生变化时,标示出潜在的买入与卖出机会。 内置的综合仪表盘将当前信号、市场倾向、动能、波动率及信号质量整合于同一视图中,方便交易者在观察价格走势的同时评估指标数据,无需在不同面板间切换。 凭借清晰的图表显示和简洁的市场概览,Tokyo Indicator 支持以系统化的方式进行趋势分析与交易确认。 适用于任何时间周期及各类交易品种,尤其适合黄金交易。 购买后请立即联系我,以获取专属赠品!您可以免费获得我们的“强力支撑与趋势扫描”(Strong Support and Trend Scanner)指标,请私信我! 设置说明与使用手册请见此处。 请注意:我不会在 Telegram 上出售我的 EA 或特殊参数设置(set files);我的 EA 仅在 Mql5 平台上提供,而参数设置文件仅在我的博客(此处链接)上发布。请务必警惕诈骗,切勿从他人处购买任何参数设置! 设置 ShowHUD —— 在图表上显示

MTZoom 是一款适用于 MetaTrader 5 的免费工具,让图表的缩放和移动像 TradingView 一样流畅自然。
MetaTrader 默认只有六个固定的缩放级别,每次缩放时图表都会跳动,很难精确地看到您想看的区域。MTZoom 彻底解决了这个问题,让您可以按照自己的习惯自由查看图表。
您将获得: - 使用鼠标滚轮以小步幅平滑缩放,不再有突然的跳动 - 按住 Ctrl 或 Shift 键并滚动鼠标,可以让K线变宽或变扁,自由调整纵向比例 - 用鼠标抓住图表,向任意方向自由拖动,包括上下左右 - 按下 FIT 按钮(或 Q 键),一键恢复到清晰整洁的默认视图
您的图表保持不变:所有的智能交易系统、指标、画线和交易都会像以前一样正常工作,MTZoom 不会修改或干扰它们。
完全免费,适用于 MetaTrader 5,由 TradeToolsOfficial 提供。
FREE

RelicusRoad 是适用于 MetaTrader 4 和 MetaTrader 5 的流动性价位指标,围绕一条中线绘制一组基于波动率的价位通道,让你一眼看出价格是接近近期均值,还是已经伸展到该设定目标位与止损位的边缘。 中线是近期价格的加权均值。上方是三条 Sell 价位,下方是三条 Buy 价位,每一条都比前一条再远一个固定步长,因此只有当价格已经远离均值时,才会到达最外侧的线。 每条线告诉你什么 标记为 Safe Close 的 Neutral 线:近期价格的平衡点;交易回到这里,算是完成了它份内的普通任务。 标记为 TP/SL-1 的 Level 1:一次摆动的正常幅度;在趋势中,价格常常沿趋势一侧贴着这条线运行。 标记为 TP/SL-2 的 Level 2:价格已经伸展;可以在这里落袋部分仓位或收紧止损。 标记为 TP/SL-3 的 Level 3:极值位置;把它当作当前交易的目标位,而不是在同方向开新仓的地方。 上下带宽不对称:上下两侧分别测量,因此一轮强劲上涨之后,上方的带宽往往扩张得更多。 在通道内交易 在边缘反向交易:价格到达 Level 2 或 Level 3

Artemis RSI 是一款适用于 MetaTrader 5 的免费 RSI 指标,能够根据市场情况自动调整自身参数。
普通 RSI 始终使用相同的周期和相同的超买超卖水平线,但市场一直在变化:有时是震荡行情,有时是趋势行情,有时平静,有时波动剧烈。固定的设置无法适应所有这些情况。Artemis 同时测试六十种不同的 RSI 设置,并实时显示当前最适合市场的那一种,让您无需手动反复调整参数。
您将获得: - 最适合当前市场的 RSI 线,随行情变化自动更新 - 随市场变化而移动的动态超买和超卖水平,而不是固定的 70 和 30 - 一个小型信息面板,清楚显示市场当前状态:震荡、趋势、平静或嘈杂 - 自动绘制在图表上的常规背离和隐藏背离,帮助您发现可能的反转和趋势延续 - 在市场转折点出现的买入和卖出箭头,方便您快速识别机会
适用于任何交易品种和任何时间周期,包括外汇、黄金、股票指数和加密货币。
请注意:Artemis RSI 是一款帮助您阅读图表和理解市场的分析工具。它不会自动交易,也不会替您做出交易决定,最终决定始终由您自己做出。
完全免费,适用于 MetaTrader
FREE

Arrow Master
是 MetaTrader 5 主图指标,用三层彩色带显示趋势方向,并可显示买卖箭头。 色带采用类似 HalfTrend 的翻转逻辑:对最高价和最低价按 Arrow Pulse 周期做均线,并用 Arrow Shield 作为价格缓冲。满足翻转条件后,色带变色,并可画出箭头。同一逻辑用于当前周期和多周期面板。 图表功能: 三条不同粗细的彩色趋势线 可选向上/向下箭头 可选 ATR 入场、止盈、止损区域(仅当前信号;价格触及 TP 或 SL 后删除) 可选面板:当前状态、信号价格与时间、当前趋势持续根数、M15 / H1 / H4 / D1 趋势,以及四周期多空比例条 可选提醒:终端警报、声音、邮件、推送 主要参数:DrawArrow、ArrowPulse、ArrowShield;提醒组;ShowDashboard 及位置/缩放;ShowATRZones、ATR_SLMultiplier、ATR_RiskReward。 本产品仅用于图表分析,不下单,不保证收益。历史信号不代表未来表现。请仅使用可承受风险的资金,并遵循自有交易规则。 支持与社群: 官方 MQL5 群

Stop Target Position Planner 是一款适用于 MetaTrader 5 的免费工具,功能类似于 TradingView 上的风险回报比工具,让您在下单之前就能清楚看到每笔交易的风险和目标。
使用方法非常简单:先点击您的入场位置,再点击您的止损位置。工具会自动在图表上画出止损线、入场线,以及任意数量的止盈目标线。每个目标按照 R 的倍数(例如 1R、2R、3R)计算,每条线上都会清楚显示点数和对应的 R 值。
所有设置都可以在图表上的小型面板中完成:目标数量、颜色和线条样式,都能根据您的习惯自由调整。
每个工具都是一个独立的图表对象:您可以选中它、调整大小、移动位置或删除它。图表上可以同时保留任意数量的工具,方便您同时规划多笔交易。
完全免费,适用于 MetaTrader 5,由 TradeToolsOfficial 提供。
FREE

Apollo Global Trends FX - 这是一个趋势指标,旨在预测任何货币对以及任何交易工具(包括金属、指数、股票、加密货币和其他交易工具)的市场趋势变动。该指标可用于任何时间范围。该指标适用于长期和短期交易。该指标可以作为主系统或指标的过滤器。该指标完美过滤市场噪音。该指标非常易于使用。你只需要跟随信号 该指示器提供所有类型的通知,包括发送到您的移动设备的通知。指标中没有设置。指标本身会根据您使用的图表进行调整,从而使交易尽可能简单和高效。 购买后,一定要写信给我! 我将与您分享使用该指标进行交易的建议。我还将免费为您提供一个指标,这将使交易更加有利可图和舒适。 感谢您的关注!祝您交易成功并盈利!

DELTA FUSION PRO 10.0 是一款专为 MetaTrader 设计的专业指标,旨在实时分析订单流 (Order Flow) 和机构压力(Ask/Bid 价差)。 主要特点 智能自动调校:根据市场(外汇、加密货币、股指、大宗商品、股票、期货)、时间框架和波动率 (ATR) 自动进行校准。 核心功能: NetDelta 与累积 Delta:通过 EMA 平滑跟踪方向性压力。 价格/成交量背离:检测常规/隐藏背离(分为 Strong/Medium/Weak 级别),并提供无重绘 (No-Repaint) 信号。 矢量不平衡与注入成交量 (Imbalance & Infusion Volume):识别成交量失衡和异常高压 spike(机构高潮)。 POC 与 Delta 分析图 (Delta Profile):精准定位具有最高激进成交量集中的价格水平。 VWAP Delta:基于激进成交量计算的成交量加权平均价。 交互式面板: UCP:可在图表上直接通过拖放 (drag-and-drop) 方式控制所有功能的开启/关闭。 情绪与多时间框架 (Sentiment & MTF):

Volume Profile Multiple — 多区块成交量分布指标,带缓冲区数据接口,支持算法交易 还在为每次切换周期都要重新绘制、重新计算成交量分布图而烦恼吗? Volume Profile Multiple 可在图表上自动绘制多个连续的成交量分布区块,揭示机构资金在市场各个阶段的真实活动区域——而不仅仅局限于最近可见的价格区间。 功能说明 该指标将历史价格按每 N 根K线划分为若干区块(区块数量和每区块的K线数量均可自定义),并为每个区块计算完整的成交量分布数据:控制点(POC)、价值区上下沿(VAH/VAL),以及高成交量节点和低成交量节点(HVN/LVN)。最终呈现的是一幅逐区块的市场结构可视化地图,便于识别基于真实成交量的筹码集中区、支撑阻力位,以及价格在不同价值区之间的轮动情况。 同样为算法交易而设计 与大多数成交量分布指标不同,本指标不仅提供可视化功能:它还输出 3个数据缓冲区 (最新区块的 POC、VAH、VAL),完全兼容 StrategyQuant X 以及任何 MQL5 智能交易系统(EA)。这意味着您可以直接基于这些关键价位构建交易策略,无需重新编写成交量

Breakout Force SMC —— 专为 MetaTrader 5 打造的市场结构管理中心。 指标会自动识别市场结构突破(BOS)以及趋势性质变化(CHoCH)。每出现一个信号,指标都会立即建立完整的交易计划:入场点、四个目标位 TP1–TP4,以及基于 ATR 计算的止损位(SL)。同时,指标会直接在图表上显示这些目标位过去被触及的频率。 这不是一个堆砌了上百种功能的“全能型”指标。它专注于一件事情:标记市场结构、计算交易水平,并对自身产生的信号进行透明、真实的统计。 工作原理 识别摆动点(Swing)——关键的高点和低点。 确认结构突破:BOS 表示趋势延续,CHoCH 表示趋势反转。通过 ATR 强度过滤器过滤弱势突破。 绘制入场点、TP1–TP4 和 SL,并对目标区域和止损区域进行填充。 统计有多少信号分别到达了每一个目标位。 核心特点 通过图表上的控制面板进行点击操作:模式和过滤器可以即时切换,无需进入指标设置 TP1–TP4 每个目标位都有实时统计数据,并直接显示在图表上 透明的统计方式:从入场信号所在 K 线开盘开始追踪;如果同一根 K 线同时触及 TP1

AriFocus - Non-Repainting Buy/Sell Signals
AriFocus - one clear signal.
AriFocus marks buy and sell signals directly on the chart and suggests a stop-loss level for each one. Every signal is confirmed on bar close and never repaints.
- Buy/sell arrows, confirmed on bar close - Suggested stop-loss level for every signal - Trend band and candle coloring to show direction at a glance - 10 ready-made presets, or your own settings (14 calculation methods) - Pop-up, push and email alerts with entr

YLLI Session Liquidity Pulse is a MetaTrader 5 indicator for analyzing session ranges, liquidity concentration, price sweeps, reclaim conditions and post-session expansion. The indicator does not open, close or modify trades. It provides chart-based analysis, setup states, optional alerts and informational entry levels. How it works The indicator first builds a configurable trading session using broker server time. During the selected session, it measures the session high, session low, equilibri

Order Block Scorecard 在您的图表上标记供给区与需求区,并为每一个区域记录来自您自己历史数据的三项数值:价格进入该区域的次数、其中有多少次被守住,以及此后价格走出的最远距离。 这三个数字描述的是您眼前这个品种与周期上已经发生的事情。它是过去行为的记录,不是预测。 区域规则 只有一条规则,完整写出,您可以在任何一根K线上用肉眼验证: 供给区 - 下跌前的最后一根阳线,且该下跌在允许的K线数量内走完所需距离 需求区 - 上涨前的最后一根阴线,条件相同 区域就是这根K线,取整根或仅取实体,由您选择。没有隐藏过滤,没有平滑处理。 每个区域的记录 从区域生成的那一刻起,指标沿历史向前推演并记录发生了什么: 测试次数 - 价格进入该区域的次数 守住次数 - 其中有多少次之后出现了足够大的离开走势 最佳 - 触及后价格从区域边界走出的最远距离 当一个区域结束时它会变灰:或者因为有K线收盘穿过了它的远端边界,或者因为它已被测试到您允许的次数上限。结束的区域仍留在图表上,因为失效的区域同样是记录的一部分。 大幅走势上的箭头 当一次触及之后出现了超过您设定阈值的走势,会从区域边界画出一
FREE

解锁聪明钱的秘密:Area of Interest + Exact Fibs! 您是否厌倦了假突破和错误的入场?您想知道大型机构和银行究竟在哪里下买单和卖单吗? 了解 Area of Interest (AOI) — 这款用于 MT5 的终极精准指标, 将先进的 Pine Script 逻辑直接引入您的 MetaTrader 5 图表。 该指标自动检测做市商留下的隐藏供需区域(Supply and Demand zones), 并将其与高精度的动态斐波那契回撤系统相结合。 停止猜测您的入场点, 开始以狙击手般的精度进行交易! 核心功能(为什么这是最好的指标): 自动供需框 (Auto Demand & Supply Boxes): 在您的实时图表上自动且准确地绘制支撑和阻力区域(兴趣区域)。 精确的 Pine 自动斐波那契 (Exact Pine Auto-Fibs): 使用高级逻辑识别最新且已确认的高低枢轴点, 自动绘制关键斐波那契水平 (0. 236, 0. 382, 0. 500, 0. 618, 0. 786)。 100% 不重绘算法 (Non-Repainting): 一旦信

Crypto_Forex 指标“带动态超卖/超买区域的 RVI”适用于 MT5,无需重绘。 - Relative_Vigor_Index (RVI) 本身是一个技术动量指标,在趋势市场上非常有用。 - 它非常适合从动态超买区域卖出和从动态超卖区域买入。 - 指标可以在任何时间范围内使用,但它在大时间范围内尤其适用:D1、H4、H1、M30。 - 动态超买区域 - 红线上方。 - 动态超卖区域 - 绿线下方。 - 带有 PC 和移动警报。 ............................................................................. Click here to see high quality Trading Robots and Indicators! 这是仅在此 MQL5 网站上提供的原创产品。

MTF OPEN LINE PRO MT5 概述 MTF Open Line Pro MT5是一款只读型MetaTrader 5指标,用于在同一张图表上整理多个时间周期的参考开盘价和基于已完成K线确认的形态事件。面板、输入参数和消息均使用英语。 级别与配置 可使用Scalping M5、Day M15、Day H1和Custom四种配置。最多8个级别槽可组合当前周期开盘价、前一周期开盘价、年度开盘价、经纪商交易时段开盘价、自定义日期时间锚点,以及Opening Range的高点、低点或中点。面板还显示距最近有效级别的点数、百分比和ATR距离,以及相邻级别的重合度。 已完成K线形态 PB用于观察级别附近的回调和拒绝,BR用于观察突破后的回测,FR用于观察假突破后的重新站回。各模式可单独或同时启用。事件只在K线完成后确认;当前未完成K线不会用于最终确认。同一根K线上出现相反方向候选时会抑制信号。 Entry箭头标记检测到的形态事件。Exit箭头根据失效、虚拟目标、反向事件或时间规则结束内部虚拟形态。这些只是图表分析记录,不是真实交易、订单、持仓或业绩声明。 面板、通知与CSV 面板可切换配

TM Price Stretch Map 在图表上显示价格通道,帮助交易者观察蜡烛图收盘价突破通道后,下一根已收盘蜡烛图是否回到通道内。 实线通道采用因果高斯核计算,仅使用当时已经可用的价格。红点表示蜡烛图收盘价高于上轨,青绿色点表示收盘价低于下轨。若上轨突破后的下一根已收盘蜡烛图收盘价回到两条轨道之间,则显示向下箭头;下轨突破后以同样方式返回时显示向上箭头。圆点和箭头始终依据实线通道计算。 可选的虚线通道采用回顾性平滑,新蜡烛图出现后,其历史曲线可能重绘。虚线仅用于视觉分析,不参与圆点或箭头的计算。带宽、通道宽度、价格来源、历史显示数量、颜色、中线和标记均可设置。本指标不会自动交易,标记也不保证价格反转。
FREE

不再在没有动能的趋势反转处入场。一条线,一张图,无需第二个指标。No repaint。
任何品种,任何市场,任何周期。2 分钟加载到您的图表。可在 Strategy Tester 中免费测试。
Get more indicators here
Baselines, volatility filters and oscillators. No repaint.
为什么需要它 您因为线条变绿而入场。价格漂移十根K线后反转。信号是真实的,但动能不是。每一次在弱反转上入场,都会让您损失一次止损和注意力。 您将获得什么 Fabii Essential Trend Baseline 是一款免费的基准线指标。它用一条线显示趋势,只标记价格确认的反转,让您不再按弱信号入场。 只有当收盘价越过偏差带时才出现趋势反转,价格仅触及线条不算,因此弱反转被过滤。 一条线一眼可读,上升为绿色,下降为红色,K线同步着色,让您更快决策。 阴影区域显示价格沿趋势方向突破偏差带的位置,让您看到动能确认的地方。 买入和卖出箭头位于偏差带之外,距离基于 Average True Range (ATR),让您看清每次反转
FREE
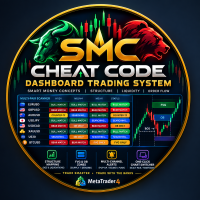
SMC Cheat Code Dashboard Trading System SMC Cheat Code Dashboard Trading System 是一款为 MetaTrader 4 打造的专业级机构市场结构指标。专为 Smart Money Concepts(SMC)和 ICT 交易者设计,该工具能够自动识别高概率结构突破、关键流动性区域以及多时间框架之间的动态订单流一致性,从而减少图表杂乱和主观分析。 无论您采用剥头皮交易、日内交易还是波段交易策略, SMC Cheat Code 都可以作为实时多品种扫描器,过滤低概率市场噪音,并实时突出显示关键市场结构的汇合区域。 核心功能与运行机制 1. 多品种 SMC Dashboard — 实时扫描器 实时跨品种扫描: 在单一图表窗口中监控您关注的交易品种(EURUSD、GBPUSD、AUDUSD、USDJPY、USDCAD 等)的市场结构一致性。 高时间框架(HTF)与低时间框架(LTF)矩阵: 自动评估关键 SMC 共振条件: H1 vs. D1 — 高时间框架趋势一致性。 M15 vs. H4 — 日内交易结构一致性。 M

ReversalZones Pro — 动态日内波动率与反转点分析指标 ReversalZones Pro 是一款专为 MetaTrader 4 设计的机构级日内波动率与枢轴点预测指标。与依赖移动平均线或平滑振荡器的传统滞后指标不同,ReversalZones 根据统计日幅扩展和斐波那契区间比例,在每个交易日开盘时即可精确计算并预测供需区和均值回归区域。 无论您是针对极值过度扩张进行 均值回归交易(反转) ,还是追踪突破动能的 突破延续交易 ,ReversalZones 都能结合机构级影线过滤机制,为您提供精确且不重绘的入场信号。 核心功能与优势 无滞后预测型区域绘制: 在开盘时根据日波幅( $High_{D1} - Low_{D1}$ )及斐波那契比例(38.2%、61.8% 和 100%)自动计算并绘制当日关键位置。 机构级拒绝影线过滤: 仅当价格触及关键边界 并且 收出强力拒绝影线(可通过 InpMinWickPercent 自定义)时才会触发信号,有效过滤盘整期的伪信号。 双重策略引擎(反转与突破): 反转信号: 当价格在 38.2% 触发线或 61.8%–100% 供需框受阻

Renko Main Chart After purchasing any of our products, you will receive lifetime free upgrades and updates from us. You will also receive support via comments. Renko Main Chart 是一款 MT5 图表指标, 旨在直接在主图表上显示 Renko(砖形)风格的价格砖块。 它提供可配置的 Renko 砖块大小、 影线显示模式、 可选的 EMA 线、 Supertrend(超级趋势)、 支撑和阻力位以及反转箭头。 该指标旨在提供一个结构化的图表视图, 用户可以结合 Renko 砖块以及可选的趋势和水平位工具来分析价格走势。 主要功能 Renko 砖块大小模式 • Pips Mode — 以点数(pips)定义 Renko 砖块大小。 • ATR Mode — 使用 ATR 动态计算砖块大小。 • Currency Mode — 直接以货币值定义所需的价格变动。 影线显示模式 • No Wicks — 显示实心的 Renko

PHSB VWAP PHSB VWAP 是一款技术指标,旨在以清晰、直观的方式显示价格在不同市场周期中的位置。 该指标将 简单移动平均线(SMA) 与 三条相互独立的 VWAP——日 VWAP、周 VWAP 和月 VWAP 结合在一起,使交易者能够在观察短期价格变化的同时,查看不同周期的重要成交量加权平均价格参考水平。 该指标的主要目标是在保持图表 简洁、实用且不过度拥挤 的同时,集中展示有价值的市场信息。 主要功能 简单移动平均线(SMA)
在图表上显示可自定义的简单移动平均线,为观察短期价格走势和方向提供直观的参考。 日 VWAP
显示从当前交易日开始计算的成交量加权平均价格。 周 VWAP
显示当前周的成交量加权平均价格,为交易者提供比日 VWAP 更长周期的价格参考。 月 VWAP
显示当前月的成交量加权平均价格,帮助交易者观察市场价格相对于更长期成交量加权平均水平的位置。 三条 VWAP 相互独立运行 ,用户可以分别启用或关闭。 同时还可以单独设置各条线的 颜色、宽度和线型 ,方便根据自己的图表风格进行调整。 图表附加信息 除了 SMA 和三条 VWAP 之外,PHS
FREE

MQL5 博客 = https://www.mql5.com/en/blogs/post/776162 MT4 版本 = https://www.mql5.com/en/market/product/188797 MT5 版本 = https://www.mql5.com/en/market/product/154022
CONTRARIAN ZONES [tambangEA] 是一款专业的市场区域指标,旨在通过结合波段结构(swing structure)、动能状况、波动率、成交量特征、价格拒绝(rejection)特征以及区域交互历史,来识别潜在的反转区域。
与传统的支撑和阻力指标不同,CONTRARIAN ZONES 不会同等对待每一个波段水平位。每个区域都通过多因素评分模型进行评估,并在价格与其发生交互时进行持续监控。
该指标侧重于两种主要的市场结构:
BUY-DIP 区域(逢低买入区)——围绕符合条件的波段低点形成的潜在看涨反转区域。
SELL-RIP 区域(逢高卖出区)——围绕符合条件的波段高点形成的潜在看跌反转区域。
其目标是帮助交易者识别价格可能出现过度延

SMC Ultimate 面向 MetaTrader 5 的机构级 Smart Money Concepts (SMC) / ICT 决策引擎。分析市场结构、流动性、Order Block 与 Fair Value Gap,并转换为评分、编码状态以及已确认的 Buy/Sell 信号。 可完全独立运行(图表面板、绘图与提醒),也可通过稳定的 4 缓冲区合约与固定的 88 个输入参数,可靠地与 iCustom 集成,供 EA 调用。 首个公开版本(version 1.0)上线价。价格可能在早期更新与评价之后上调。 主要功能 HTF 与 LTF 市场结构:摆动点、BOS 与 CHoCH 流动性地图:equal high/low 与扫损(sweep)检测 Order Block 与 Fair Value Gap(含触达/失效状态) Premium / Discount 上下文评分 可配置权重的多因子决策分,带迟滞锁定 Anti-Repaint:确认信号锁定在已收盘 K 线(shift 1) 图表仪表盘:趋势、区域、分数、信号与缓冲区读数 提醒:弹窗、声音、推送(冷却与每根K线一次) EA Mo

“Auto FIBO” Crypto_Forex 指标 - 是一款出色的交易辅助工具! MT5. ........................................................................... - 指标自动计算并绘制斐波那契水平线和局部趋势线(红色)。 - 斐波那契水平线指示价格可能反转的关键区域。 - 最重要的水平线是 23.6%、38.2%、50% 和 61.8%。 - 您可以将其用于反转剥头皮交易或区域网格交易。 - 您还可以使用 Auto FIBO 指标来改进您当前的系统。 ............................................................................. Click here to see high quality Trading Robots and Indicators! 这是仅在 MQL5 网站上提供的原创产品。

用低滞后的基准线更早发现趋势反转。五种快速均线。No repaint。
任何品种,任何市场,任何周期。可在 Strategy Tester 中免费演示。
Get more indicators here
Baselines, volatility filters and oscillators. No repaint.
为什么需要它 慢速均线在行情已经展开后才确认趋势。您发现反转晚,入场也晚。每一次晚入场,都会让您得到更差的价格和更远的止损。 您将获得什么 Fabii Responsive Trend Baseline 是一款带有五种快速移动平均线的基准线指标,让您比使用慢速均线更早看到趋势反转。 一个菜单包含五种快速均线,让您选择想要的反应速度。 这些均线旨在减少滞后,让线条贴近价格,反转更早出现。 只有当收盘价越过偏差带时才出现趋势反转,价格仅触及线条不算,因此弱反转被过滤。 阴影区域显示价格沿趋势方向突破偏差带的位置,让您看到动能确认的地方。 买入和卖出箭头位于偏差带之外,距离基于 Average True Range (ATR),让您看清每次反转而不杂乱。 趋势反转和穿越

在更平滑、小幅波动更少的线条上读取趋势。五种信号处理滤波器。No repaint。
任何品种,任何市场,任何周期。可在 Strategy Tester 中免费演示。
Get more indicators here
Baselines, volatility filters and oscillators. No repaint.
为什么需要它 嘈杂的线条会在每一次小幅波动时反转。您看到新信号,入场,然后行情反向。每一次错误反转,都会让您损失一次止损。 您将获得什么 Fabii Ehlers Trend Baseline 是一款带有五种信号处理滤波器的基准线指标,让您在更平滑的线条上读取趋势。 一个菜单包含五种滤波器,让您选出适合您市场的平滑程度。 Super Smoother 和 Low-Pass 滤除价格的小幅波动,FRAMA 跟随市场结构,让线条更安静。 只有当收盘价越过偏差带时才出现趋势反转,价格仅触及线条不算,因此弱反转被过滤。 阴影区域显示价格沿趋势方向突破偏差带的位置,让您看到动能确认的地方。 买入和卖出箭头位于偏差带之外,距离基于 Average True Ran

让基准线在噪音中放慢、在行情中加速,帮您留在趋势里。五种自适应均线。No repaint。
任何品种,任何市场,任何周期。可在 Strategy Tester 中免费演示。
Get more indicators here
Baselines, volatility filters and oscillators. No repaint.
为什么需要它 固定速度的均线在强势行情中滞后,在噪音中跳动。您要么入场太晚,要么在小幅波动上入场。这两种入场都不符合您所交易的市场。每一次过晚或受噪音影响的入场,都会让您损失一次止损。 您将获得什么 Fabii Adaptive Trend Baseline 是一款带有五种自适应移动平均线的基准线指标,让您不必再与速度固定、不适合市场的线条较劲。 一个菜单包含五种自适应均线,让您选出最能跟随您市场的那一种。 KAMA、VIDYA 和 ADXVMA 会根据市场状况调整速度,让线条平滑噪音并跟随真实行情。 只有当收盘价越过偏差带时才出现趋势反转,价格仅触及线条不算,因此弱反转被过滤。 阴影区域显示价格沿趋势方向突破偏差带的位置,让您看到动能确认的地

趋势交易者的终极交易系统
了解我们强大的顺势交易系统精简版(Lite),专为紧跟机构资金流向而设计,包含:
- Hexo 短期均线 & Hexo 长期均线
- Hexo K线颜色系统(6 种色调)
1. Hexo 移动平均线
Hexo 均线是一种采用独家专有平滑算法的高级跟踪指标,表现远优于传统的简单或指数移动平均线:
- 直观识别: 动态颜色转换,清晰指示多头强势( 绿色 )或空头强势( 红色 )。
- 噪点过滤: 极度平滑的曲线,有效消除价格剧烈短期波动时的虚假反复交错。
- 动态支撑与阻力: 均线充当价格防守区域,价格回调触碰后往往顺势反弹。
2. Hexo K线颜色系统
一款视觉化分析工具,基于严谨的数学模型逐根K线评估趋势强度,呈现 6 种不同色调:
- 上升趋势: 浅绿(预警/初期) | 绿色(确认) | 深绿(最大动能)
- 下降趋势: 粉红(预警/初期) | 红色(确认) | 深红(最大动能)
注意:颜色越深,代表动能与方向性成交量越强。
3. 交易规则
- 仅做多(买入): 短期均线位于长期均线上方并逐渐拉开距离,两条均线均为
FREE

Trend Target Ribbon [BOSWaves] Trend Target Ribbon [BOSWaves] 是一款面向 MetaTrader 5(MQL5)的高级多功能趋势跟踪与风险管理指标。它将平滑的 Arnaud Legoux Moving Average(ALMA) 核心与基于波动率和斜率的确认过滤器相结合,用于识别市场趋势、绘制动态颜色趋势带,并自动生成多层级 Risk-to-Reward($R$)交易目标。 核心功能 1. ALMA 趋势带与斜率过滤 ALMA Smoothing Engine: 使用 Arnaud Legoux Moving Average 核心线降低滞后,同时减少市场噪声影响。可调整 Length、Offset 和 Sigma 参数。 Volatility & Slope Validation: 通过测量标准差带以及相对于 Average True Range(ATR)的斜率阈值来确认趋势动能。 Color-Coded Ribbon Fill: 在主图窗口绘制自适应趋势带,根据市场动能偏多或偏空动态改变颜色。 2. 自动信号生成 Flip-
FREE

在一张图表上测试 18 种基准线,保留适合您市场的那一种。一个菜单,一套逻辑。No repaint。
任何品种,任何市场,任何周期。可在 Strategy Tester 中免费演示。
Get more indicators here
Baselines, volatility filters and oscillators. No repaint.
为什么需要它 适合一个品种的基准线,在另一个品种上可能滞后,或在震荡中频繁跳动。更换它意味着加载另一个指标并重建图表。于是您一直使用不适合自己市场的基准线。每一次在滞后或不稳定的基准线上入场,都会让您损失一次止损。 您将获得什么 Fabii Universal Trend Baseline 是一款集合 18 种移动平均线的基准线指标,让您不必来回更换指标就能找到适合您品种的均线。 下拉菜单提供 18 种基准线,让您在自己的图表上直接比较,无需加载其他指标。 所有基准线使用同一套趋势逻辑,让您比较的是均线本身,而不是规则。 只有当收盘价越过偏差带时才出现趋势反转,价格仅触及线条不算,因此弱反转被过滤。 阴影区域显示价格沿趋势方向突破偏差
您知道为什么MetaTrader市场是出售交易策略和技术指标的最佳场所吗?不需要广告或软件保护,没有支付的麻烦。一切都在MetaTrader市场提供。
