True Breakouts

Fai trading solo sui veri breakout che contano davvero.
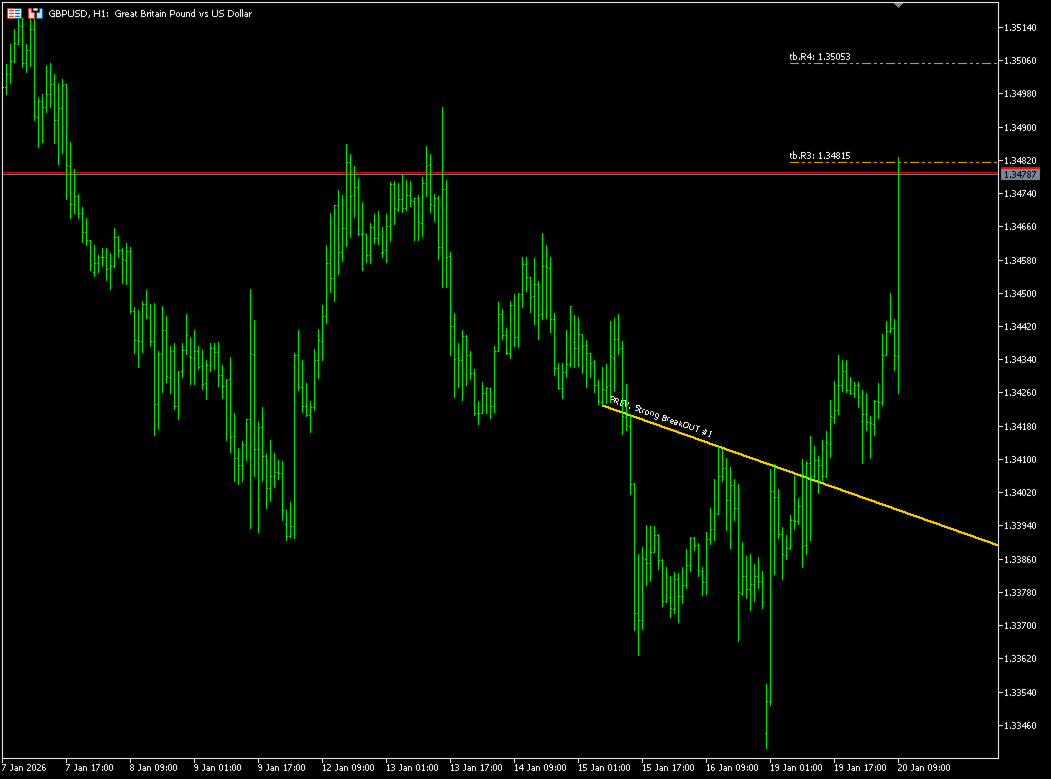
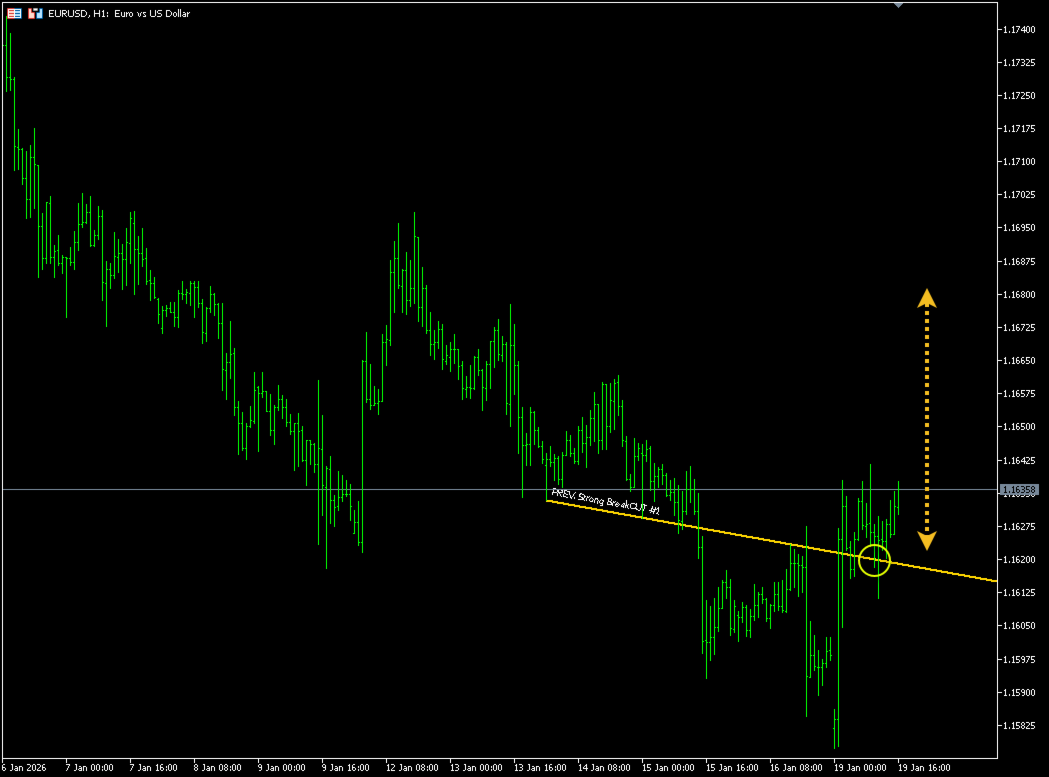
True Breakouts è un indicatore MT5 ad alta precisione che rileva i veri breakout di mercato utilizzando un pattern di breakout autentico e proprietario
- un concetto raro non presente negli indicatori convenzionali.


Full description in English: https://www.mql5.com/en/market/product/162325

True Breakouts identifica i veri breakout utilizzando:

un pattern proprietario unico,
che offre maggiore precisione,
una chiara conferma del breakout direttamente sul tuo grafico MT5
e può essere utilizzato su tutti i simboli nei conti MT5.
(forex, materie prime, indici, azioni, criptovalute, obbligazioni, ecc.)

Vantaggi principali.
Pattern di breakout autentico e proprietario.
Un concetto raro scoperto attraverso una vera ricerca di mercato, non una logica riciclata.

Maggiore precisione rispetto ai metodi convenzionali.
Progettato per superare le prestazioni dei comuni indicatori di breakout disponibili sul mercato.

Linee di breakout visive chiare.
Riconosci istantaneamente le zone di breakout valide direttamente sul grafico.

Ottimizzato per il trading reale.
Testato in diverse condizioni di mercato e timeframe.

Autonomo, leggero e mirato.
Intelligenza pura sui breakout senza inutili complessità.

Dotato di livello SR dal concetto integrato di True Breakout.

A chi è rivolto True Breakouts?
Trader di breakout che cercano conferme di qualità superiore
Trader di price action che apprezzano struttura e chiarezza
Scalper, day trader e swing trader
Trader stanchi di falsi breakout e segnali inaffidabili
Trada i breakout con fiducia strutturale.
True Breakouts non è solo un altro indicatore di breakout.
È il risultato di una rara scoperta di pattern, test a lungo termine e una reale comprensione del mercato.

Smettila di indovinare.
Smettila di inseguire falsi movimenti.
Trada solo i veri breakout.
Prodotti consigliati
Visual Heatmap Book Analyzer
Alexandre Moraes De Souza Lima
Visual Heatmap Book Analyser This indicator monitors the market liquidity and generates colors based on order patterns, quantities, and renewal activities in the book. This allows you to visualize the order flow and identify areas of high and low liquidity and activity. The indicator uses machine learning techniques to analyze the order behavior in the book, enabling it to detect patterns and trends in orders, allowing you to make informed decisions about your trading operations. The color pale
Forex Volume MT5
KEENBASE SOFTWARE SOLUTIONS
KT Forex Volume mostra il volume di acquisto e vendita di una coppia di valute sotto forma di istogramma colorato. Il volume è composto dalle transazioni di acquisto e vendita su un asset. Nel mercato Forex: Se il volume di acquisto supera quello di vendita, il prezzo della coppia di valute tende a salire. Se il volume di vendita supera quello di acquisto, il prezzo della coppia di valute tende a scendere. Caratteristiche Evita operazioni sbagliate confermandole con i dati di volume per tick. T
Delta Profile Volume
Teresinha Moraes Correia
Technical Description of the Indicator – Delta Profile for MetaTrader 5 The Delta Profile is an indicator developed for MetaTrader 5 focused on detailed analysis of volume flow within a defined range of candles. It organizes and displays information about the imbalance of positive volumes (associated with upward movements) and negative volumes (associated with downward movements) at different price levels. The result is a clear view of the chart points where the highest concentration of trades o
About indicator > The indicator is a function based on one value (open/high prices up to now) and then it is a mathematical representation of the whole function that is totally independent from any else values. So, if you ask yourself will the future be as it is on the graph... I can tell you - as it was the same as the trading function up to the moment "now"... In conclusion, the point of the indicator is  to try to show the future of the trading function into eternity. The graphic is sometime
RAD CRITICAL LEVES RAD indicator tracks “Relevant Volume” in real time, identifying accumulation and distribution processes, projecting them in the chart as SUPPORT or RESISTANCE zones. Natural   support   and resistance levels are generated by Volume Accumulation and Distribution processes. As these processes evolve, levels at which the relevant volume in the market place is positioned, become difficult areas to cross upwards or downwards. By using this information, traders can identify very s
WAPV Box Effort x Result
Eduardo Da Costa Custodio Santos
RISULTATO WA_PV_BOX_EFFORT X per MT5 Il WAPV Box Effort x Result Indicator fa parte del gruppo Package Indicators (Wyckoff Academy Wave Market). L'indicatore WAPV Box Effort x Result Indicator per MT5 ti aiuta a leggere il prezzo e il volume. La sua lettura consiste nell'assistere nell'identificazione dello sforzo x risultato in onde create dal grafico. L'indicatore WAPV Box Effort x Result Indicator per MT5 quando la casella è verde significa che il volume è a favore della domanda e quando la c
Call/Put Ratio is one of the most well-known indicators of the market sentiment. The indicator has been developed by Martin Zweig. It is based on real volumes of the CBOE option market. As we know, a Call option gives its owner the right to buy the underlying asset at a predetermined price. A Put option gives the right to sell it. Thus, increasing volumes for Call options indicate the increasing demand. The growth of Put option volumes shows that supply starts exceeding demand. If we divide the
This product is designed for the MT5 platform and offers two key features: VWAP (Volume Weighted Average Price) calculation and Volume Profile analysis. Advantages: VWAP Calculation: The product calculates the VWAP, which is a popular indicator used by traders to determine the average price of a security based on its trading volume. It helps identify potential buying or selling opportunities by comparing the current price to the average price weighted by volume. Volume Profile Analysis: The prod
Range profile
Mikhail Nazarenko
The indicator automatically calculates the level and   real volume       Point of control, and also displays the market profile for an array of candles, within the boundaries of a rectangle. If your strategy is based on taking profit on a rebound from price accumulations,   the Range profile indicator will become the main tool in scalping trading. Point of control is calculated based on the total volume for each tick or minute candles, depending on the settings and trading timeframe. In the abse
Volume Profil MT5
Vincent Jose Proenca
Volume Profile Rectangle – Descrizione del Prodotto Sommario Indicatore interattivo del profilo di volume che mostra un’analisi orizzontale del volume scambiato a ciascun livello di prezzo all’interno di un’area selezionata. Crea automaticamente un rettangolo mobile e visualizza barre colorate che rappresentano la distribuzione del volume rialzista e ribassista. Cosa fa: Mostra il volume orizzontale : Visualizza la distribuzione del volume a ciascun livello di prezzo tramite barre orizzontali An
Cyberdyne System
Giordan Cogotti
5 (2)
Pricing Schedule: First 5 Copies @ $199   [SOLD OUT: 5/5]   (80% OFF) Next 5 Copies @ $349   [OVERSOLD: 8/5 Claimed!]   (65% OFF) Current Price: $499   (50% OFF — Next 5 Copies) 1/5 Next Price: $699 Final Price: $999 LIVE SIGNAL: Cyberdyne System  Cyberdyne System - Institutional-Grade Autonomous AI Trading Intelligence   The evolution of algorithmic trading has followed distinct phases: from rigid rule-based systems dominant in early retail EAs, to the integration of adaptive machine learning
Reverse side scalper is the manual trading system, that works on choppy(anti-trend) market. As a rule markets are on 80% choppy and only 20% is trend phase. System is based on custom step Moving and RSI and reverse pattern. System defines up movement, down movement, trend / choppy phases. Indicator plots Buy signal arrow when current direction is down and phase is trend, Sell signal arrow is plotted when currently is up movement and phase is trend. As a rule it allows to "catch" local maximum/mi
Price Volume Distribution Indicatore Volume Profile che analizza la distribuzione del volume di trading per livello di prezzo. Visualizza POC, Value Area, picchi di volume e filtraggio segnali basato su zone per MT5. Panoramica Price Volume Distribution e un indicatore di analisi del volume per MetaTrader 5. Calcola e visualizza la distribuzione del volume sui livelli di prezzo utilizzando dati del timeframe M1, fornendo rappresentazione visiva tramite barre istogramma e linee di riferimento.
Volume Delta Candles offer a straightforward way to analyze trading activity within each candle, making it easier to see what's happening without needing an extra volume indicator. This tool uses lower timeframe or real-time data to show the percentage of buying and selling volume within a candle as a colored bar. Make sure you understand Volume and Volume Delta before jumping in. If you’re not sure, reach out to me first for a quick rundown. But if you're already familiar, you're good to go! Ke
Smart Candle Trigger
Mohammad Reza Noorhani
The SCT(Smart Candle Trigger) mt5 is designed for the manual trader who needs assistance to open and manage orders in defined SUPPLY and DEMAND zones. Trader based on his/her strategy define zones on the charts and SCT will open positions based on candle confirmation of Engulf and PinBar once price come into trader zones. SCT  works on all kinds of symbols: currency pairs, indices, metals, commodities, cryptocurrencies, etc. Benefits Save trader time and energy to follow candles of market for co
Session Control
Vitalii Zakharuk
Session Control session indicator. Depending on from which continent the trading activity takes place in a certain period, the entire daily routine is divided into several trading sessions. Due to the fact that at each separate time interval exchange and banking platforms from different parts of the world are connected to the trading process, and the Forex market operates around the clock. There are 4 main trading sessions: Pacific. European. American. Asian. This indicator allows you to se
UR VolumeTrend MT5
Krzysztof Jan Debski
UR VolumeTrend   UR VolumeTrend è l'indicatore di volume più chiaro che mostra la tendenza in corso in termini di volume. Funziona perfettamente con altri indicatori proprio come UR TrendExhaustion per segnalare massimi e minimi locali. Limitato a soli 2 parametri: più alti sono i valori, più lunghe saranno le tendenze che mostrerà. Gli estremi del gradiente mostrano possibili esaurimenti di volume per catturare una potenziale inversione. Due righe: l'andamento del volume e la media. Il migli
Automatic Vwap Midas
Ricardo Almeida Branco
5 (1)
The 3 Automatic Vwap (Midas) Indicator can be used for Price and Volume studyers to map the movement of market drivers. It automatically plots 3 Vwaps, two of which are dynamic and will be updated throughout the day if new highs or new lows emerge. The third Vwap is daily and can help if the trend is up or down. Also, an auxiliary indicator that plots (also dynamic) points of interest with OHLC prices (Open, High and Low of the current day and Close of the previous day) was inserted. Success and
place a vwap line starting from the line placed on the chart parameters: tick_mode: enable to use ticks instead of bars. this uses a lot more cpu processing power prefix: prefix to add for line created by indicator line_color: set the color of the line created line_style: set the line style of the line created applied_price: set the price of bar to use of the bar std_dev_ratio: set the multiplier for the std dev channel
Simple QM Pattern MT5
Suvashish Halder
5 (1)
Simple QM Pattern   is a powerful and intuitive trading indicator designed to simplify the identification of the Quasimodo (QM) trading pattern. The QM pattern is widely recognized among traders for effectively signaling potential   reversals   by highlighting key market structures and price action formations. This indicator helps traders easily visualize the QM pattern directly on their charts, making it straightforward even for those who are new to pattern trading. Simple QM Pattern includes d
FREE
Daily & Composite Volume Profile   This is a professional-grade market profile tool designed for MetaTrader 5. It utilizes a   Dual-Profile System   to visualize supply, demand, and liquidity concentrations. Key Features Left Side: Daily Session Profiles Automatically identifies the start and end of every trading day. Generates a unique Volume Profile for each individual day. Allows you to see how value migrated from yesterday to today (e.g., Is today's volume higher or lower than yesterday?).
Market Profile Heat indicator  — is a classic Market Profile implementation that can show the price density over time, outlining the most important price levels, value area, and control value of a given trading session. This indicator can be attached to timeframes between M1 and D1 and will show the Market Profile for daily, weekly, monthly, or even intraday sessions. Lower timeframes offer higher precision. Higher timeframes are recommended for better visibility. It is also possible to use a fr
️ Trade Manager oneclick  ( Reverse Trade,  Partial Close,  Breakeven, Close All Running Trade )   control – Smart Manual Trade Control for MT5 Trade Manager oneclick control is a powerful yet lightweight trade management utility built for manual traders who want precise control over their open positions — directly from the MT5 chart. This EA does not open or close trades automatically based on any strategy. It simply provides one-click management tools to handle your running trades efficient
FREE
Bullhouse Anchored VWAP
Luiz Vinicius Pereira Rocha -
Anchored VWAP Indicator Track the true market consensus price from any point on the chart. This Anchored VWAP (Volume Weighted Average Price) indicator allows you to anchor the calculation to any candle — highs, lows, breakouts, or key events — offering precise control to identify institutional interest levels. Follow buyer or seller pressure in real-time Add multiple anchors to track various key points of interest simultaneously Ideal for professional and institutional-level analysis
ArroX
Zahed Khodarahmi
ArroX Indicator Description ArroX is a technical analysis indicator designed for MetaTrader 5 platform. This indicator analyzes price movements and market trends to provide trading signals. Key Features: - Displays buy and sell arrows on the chart - Includes trend filtering capabilities - Provides multiple take profit levels - Shows market analysis information panel - Supports different signal sensitivity modes - Uses Bollinger Bands and moving averages for analysis - Includes stop loss calc
The   Real Flow Defense Levels   indicator is a proprietary tool designed to identify and plot   significant, high-conviction price zones   directly onto your main trading chart. It uses a dynamic, volume-based analysis to determine where the market has previously demonstrated the   strongest defense or concentration of activity . These plotted lines serve as   dynamic support and resistance levels , highlighting the prices where major participants are most likely to enter or defend their positi
Adjustable Consecutive Fractals  looks for 2 or more fractals in one direction and sends out a on screen alert, sound alert and push notification, for strong reversal points . Adjustable Consecutive Fractals, shows the fractals on chart along with a color changing text for buy and sell signals when one or more fractals appear on one side of price. Adjustable Consecutive Fractals is based Bill Williams Fractals . The standard Bill Williams fractals are set at a non adjustable 5 bars, BUT withe th
Aggression Volume Profile
Edson Cavalca Junior
4.55 (11)
This indicator plots the volume profile by Price on the chart There are 5 ways to view it: By Total Volume Traded (Premium Version); Volume Ticks(Forex) Separated by Buyers and Sellers (Premium Version); Buyers Only (Premium Version); Sellers Only (Premium Version); Business balance (Buyers - Sellers) (Premium Version); . It is possible to select how many days the profiles will be calculated.( Premium Version) On the current day it recalculates the histogram data for each new candlestick.
FREE
BBVectorDynamics_Robot is an innovative trading advisor specifically designed for volatile markets. Based on unique algorithms for analyzing market forces and identifying imbalances between buyers and sellers, this advisor helps you make precise and well-considered decisions in the trading process. Main features of the bb vector dynamics_robot advisor: Calculation of dynamic vectors. System determines the differences between the extreme price values and smoothed averages over a specified perio
Esse indicador mede o 1º Canal de referencia e a 1º  Zona Neutra * configurar o canal macro para verificar a frequencia MAIOR H1 H4 1D * configurar o canal micro para verificar a frequencia Menor 1M 5M 15M Como instalar o Indicador fimathe. E uma pré mentoria tem uma estrategia Secreta bonus nesse video . assitao o video para enteder as logicas que podemos iniciar com esse indicador. https://www.youtube.com/playlist?list=PLxg54MWVGlJzzKuaEntFbyI4ospQi3Kw2
Gli utenti di questo prodotto hanno anche acquistato
Se acquisti questo indicatore, riceverai il mio Trade Manager Professionale + EA  GRATUITAMENTE. Innanzitutto è importante sottolineare che questo sistema di trading è un indicatore Non-Repainting, Non-Redrawing e Non-Lagging, il che lo rende ideale sia per il trading manuale che per quello automatico. Corso online, manuale e download di preset. Il "Sistema di Trading Smart Trend MT5" è una soluzione completa pensata sia per i trader principianti che per quelli esperti. Combina oltre 10 indicat
Divergence Bomber
Ihor Otkydach
4.9 (81)
Ogni acquirente dell’indicatore riceverà inoltre gratuitamente: L’utilità esclusiva “Bomber Utility”, che gestisce automaticamente ogni operazione, imposta i livelli di Stop Loss e Take Profit e chiude le posizioni secondo le regole della strategia I file di configurazione (set file) per adattare l’indicatore a diversi asset I set file per configurare il Bomber Utility in tre modalità: “Rischio Minimo”, “Rischio Bilanciato” e “Strategia di Attesa” Una guida video passo-passo per installare, conf
Azimuth Pro
Ottaviano De Cicco
5 (1)
LAUNCH PROMO Azimuth Pro price is initially set at 299$ for the first 100 buyers. Final price will be 499$ . THE DIFFERENCE BETWEEN RETAIL AND INSTITUTIONAL ENTRIES ISN'T THE INDICATOR — IT'S THE LOCATION. Most traders enter at arbitrary price levels, chasing momentum or reacting to lagging signals. Institutions wait for price to reach structured levels where supply and demand actually shift. Azimuth Pro maps these levels automatically: swing-anchored VWAP, multi-timeframe structure lines, an
FX Power MT5 NG
Daniel Stein
5 (30)
FX Power: Analizza la Forza delle Valute per Decisioni di Trading Più Intelligenti Panoramica FX Power è lo strumento essenziale per comprendere la reale forza delle principali valute e dell'oro in qualsiasi condizione di mercato. Identificando le valute forti da comprare e quelle deboli da vendere, FX Power semplifica le decisioni di trading e rivela opportunità ad alta probabilità. Che tu segua le tendenze o anticipi inversioni utilizzando valori estremi di Delta, questo strumento si adatta
Atomic Analyst MT5
Issam Kassas
4.07 (28)
Innanzitutto, vale la pena sottolineare che questo indicatore di trading non è repaint, non è ridisegno e non presenta ritardi, il che lo rende ideale sia per il trading manuale che per quello automatico. Manuale utente: impostazioni, input e strategia. L'Analista Atomico è un indicatore di azione del prezzo PA che utilizza la forza e il momentum del prezzo per trovare un miglior vantaggio sul mercato. Dotato di filtri avanzati che aiutano a rimuovere rumori e segnali falsi, e aumentare il pote
Innanzitutto, vale la pena sottolineare che questo Strumento di Trading è un Indicatore Non-Ridipingente, Non-Ridisegnante e Non-Laggante, il che lo rende ideale per il trading professionale. Corso online, manuale utente e demo. L'Indicatore Smart Price Action Concepts è uno strumento molto potente sia per i nuovi che per i trader esperti. Racchiude più di 20 utili indicatori in uno solo, combinando idee di trading avanzate come l'Analisi del Trader del Circolo Interno e le Strategie di Tradin
Super Signal – Skyblade Edition Sistema professionale di segnali di tendenza senza repaint / senza ritardo con tasso di vincita eccezionale | Per MT4 / MT5 Funziona meglio su timeframe più bassi, come 1 minuto, 5 minuti e 15 minuti. Caratteristiche principali: Super Signal – Skyblade Edition è un sistema intelligente di segnali progettato specificamente per il trading di tendenza. Utilizza una logica di filtraggio multilivello per identificare esclusivamente i movimenti direzionali forti, supp
Trend Screener Pro MT5
STE S.S.COMPANY
4.84 (100)
Indicatore di tendenza, soluzione unica rivoluzionaria per il trading di tendenze e il filtraggio con tutte le importanti funzionalità di tendenza integrate in un unico strumento! È un indicatore multi-timeframe e multi-valuta al 100% non ridipingibile che può essere utilizzato su tutti i simboli/strumenti: forex, materie prime, criptovalute, indici e azioni. Trend Screener è un indicatore di tendenza che segue un indicatore efficiente che fornisce segnali di tendenza a freccia con punti nel gra
Grabber System MT5
Ihor Otkydach
4.82 (22)
Ti presento un eccellente indicatore tecnico: Grabber, che funziona come una strategia di trading "tutto incluso", pronta all’uso. In un solo codice sono integrati strumenti potenti per l’analisi tecnica del mercato, segnali di trading (frecce), funzioni di allerta e notifiche push. Ogni acquirente di questo indicatore riceve anche gratuitamente: L’utility Grabber: per la gestione automatica degli ordini aperti Video tutorial passo dopo passo: per imparare a installare, configurare e utilizzare
Gold Sniper Scalper Pro
Ich Khiem Nguyen
3.5 (8)
Gold Sniper Scalper Pro è un indicatore professionale per MetaTrader 5, progettato per supportare i trader nell'identificare punti di ingresso e gestire il rischio in modo efficace. L'indicatore fornisce un set completo di strumenti analitici che include un sistema di rilevamento dei segnali, gestione automatica di Entry/SL/TP, analisi del volume e statistiche delle performance in tempo reale. Guida utente per comprendere il sistema   |   Guida utente per altre lingue CARATTERISTICHE PRINCIPALI
AriX
Temirlan Kdyrkhan
1 (4)
AriX Indicator for MT5 A powerful trend-following and signal-evaluation tool AriX is a custom MT5 indicator that combines Moving Averages and ATR-based risk/reward logic to generate clear buy/sell signals. It visualizes dynamic SL/TP levels, evaluates past trade outcomes, and displays win/loss statistics in a clean on-chart panel. Key features include: Buy/Sell signals based on MA crossovers ATR-based SL/TP1/TP2/TP3 levels with visual lines and labels Signal outcome tracking with real-time stat
Berma Bands
Muhammad Elbermawi
5 (7)
L'indicatore Berma Bands (BBs) è uno strumento prezioso per i trader che cercano di identificare e capitalizzare i trend di mercato. Analizzando la relazione tra il prezzo e le BBs, i trader possono discernere se un mercato è in una fase di trend o di range. Visita il [ Berma Home Blog ] per saperne di più. Le Berma Bands sono composte da tre linee distinte: la Upper Berma Band, la Middle Berma Band e la Lower Berma Band. Queste linee sono tracciate attorno al prezzo, creando una rappresentazion
PZ Swing Trading MT5
PZ TRADING SLU
5 (5)
Protect against whipsaws: revolutionize your swing trading approach Swing Trading is the first indicator designed to detect swings in the direction of the trend and possible reversal swings. It uses the baseline swing trading approach, widely described in trading literature. The indicator studies several price and time vectors to track the aggregate trend direction and detects situations in which the market is oversold or overbought and ready to correct. [ Installation Guide | Update Guide | Tro
TPSproTREND PrO MT5
Roman Podpora
4.74 (19)
TPSproTrend PRO identifica il momento in cui il mercato cambia effettivamente direzione e forma un punto di ingresso all'inizio del movimento. Si entra nel mercato quando il prezzo sta appena iniziando a muoversi, e non dopo che il movimento si è già verificato.   Indicatore       Non ridisegna i segnali e visualizza automaticamente i punti di ingresso, lo Stop Loss e il Take Profit, rendendo il trading chiaro, visivo e strutturato. ISTRUZIONI RUS   -   VERSIONE MT4 Vantaggi principali Segnali
Shock Pullback
Suleiman Alhawamdah
5 (1)
Semplicemente, puoi iniziare a fare trading quando il movimento dei numeri bianchi — noti come "pips" — inizia ad apparire accanto alla candela corrente. I "pips" bianchi indicano che un'operazione di acquisto o vendita è attualmente attiva e si sta muovendo nella direzione corretta, come indicato dal colore bianco. Quando il movimento dei pips bianchi si interrompe e diventa di colore verde statico, questo segnala la fine della spinta attuale. Il colore verde dei numeri rappresenta il profitto
Trend Forecaster
Alexey Minkov
5 (7)
The Trend Forecaster indicator utilizes a unique proprietary algorithm to determine entry points for a breakout trading strategy. The indicator identifies price clusters, analyzes price movement near levels, and provides a signal when the price breaks through a level. The Trend Forecaster indicator is suitable for all financial assets, including currencies (Forex), metals, stocks, indices, and cryptocurrencies. You can also adjust the indicator to work on any time frames, although it is recommen
Ottieni l’indicatore AUX GRATUITO e il supporto EA Download diretto — Clicca qui [ D.I.C.E ] The DICE Indicator  Divergence in Chaos Environment è uno strumento MT5 specializzato per trader che applicano la Teoria delle Onde di Elliott nel contesto delle tecniche di Trading Chaos. Identifica divergenze nascoste e regolari nell’azione dei prezzi, sincronizzate con l’ambiente di mercato caotico descritto da Bill Williams. Caratteristiche principali Divergenza allineata alle Onde di Elliott: rilev
Market Structure Patterns
Samuel Manoel De Souza
4.47 (19)
Disponibile per   MT4   e   MT5 . Unisciti al canale Market Structure Patterns per scaricare materiale di studio e/o informazioni aggiuntive. Pubblicazioni correlate: Market Structure Patterns - Introduzione Acquistalo ora con 50% di sconto | Prezzo precedente $90 | Offerta valida fino al 31 dicembre | Un importante aggiornamento è in arrivo e il prezzo originale verrà adeguato. Market Structure Patterns   è un indicatore basato sui   Smart Money Concepts   che mostra gli   elementi SMC/ICT  
Advanced Supply Demand MT5
Bernhard Schweigert
4.5 (14)
La migliore soluzione per qualsiasi principiante o trader esperto! Questo indicatore è uno strumento di trading unico, di alta qualità e conveniente perché abbiamo incorporato una serie di funzionalità proprietarie e una nuova formula. Con questo aggiornamento, sarai in grado di mostrare fusi orari doppi. Non solo potrai mostrare una TF più alta, ma anche entrambe, la TF del grafico, PIÙ la TF più alta: SHOWING NESTED ZONES. Tutti i trader di domanda di offerta lo adoreranno. :) Informazioni imp
FX Volume MT5
Daniel Stein
4.79 (24)
FX Volume: Scopri il Vero Sentimento di Mercato dalla Prospettiva di un Broker Panoramica Rapida Vuoi portare la tua strategia di trading a un livello superiore? FX Volume ti offre informazioni in tempo reale su come i trader retail e i broker sono posizionati—molto prima che compaiano report in ritardo come il COT. Che tu miri a guadagni costanti o desideri semplicemente un vantaggio più solido sui mercati, FX Volume ti aiuta a individuare grandi squilibri, confermare i breakout e perfezionar
The Super Arrow Indicator provides non-repainting buy and sell signals with exceptional accuracy. Key Features No repainting – confirmed signals remain fixed Clear visual arrows: green for buy, red for sell Real-time alerts via pop-up, sound, and optional email Clean chart view with no unnecessary clutter Works on all markets: Forex, gold, oil, indices, crypto Adjustable Parameters TimeFrame Default:   "current time frame" Function:   Sets the time frame for indicator calculation Options:   Can
Gold Venamax MT5
Sergei Linskii
2.67 (3)
Gold Venamax : questo è il miglior indicatore tecnico azionario. L'algoritmo dell'indicatore analizza il movimento dei prezzi di un asset e riflette la volatilità e le potenziali zone di ingresso. Caratteristiche dell'indicatore: Questo è un super indicatore con Magic e due blocchi di frecce di tendenza per un trading comodo e redditizio. Sul grafico viene visualizzato il pulsante rosso per cambiare blocco. Magic è impostato nelle impostazioni dell'indicatore, in modo da poter installare l'indi
Blahtech Supply Demand MT5
Blahtech Limited
4.54 (13)
Was: $299  Now: $99  Supply Demand uses previous price action to identify potential imbalances between buyers and sellers. The key is to identify the better odds zones, not just the untouched ones. Blahtech Supply Demand indicator delivers functionality previously unavailable on any trading platform. This 4-in-1 indicator not only highlights the higher probability zones using a multi-criteria strength engine, but also combines it with multi-timeframe trend analysis, previously confirmed swings a
WVAP Scalping
Domantas Juodenis
VWAP Scalping Pro – Advanced VWAP & Market Profile System Professional-Grade VWAP + Market Profile Technology for Precision Trading VWAP Scalping Pro is an advanced analytical tool that integrates Volume-Weighted Average Price (VWAP) analysis with professional Market Profile visualization. It provides traders with institutional-style insights into price structure, volume distribution, and session dynamics — ideal for scalping, intraday, and swing trading strategies. Key Features Triple VWAP St
MetaForecast M5
Vahidreza Heidar Gholami
5 (3)
MetaForecast predice e visualizza il futuro di qualsiasi mercato basandosi sull'armonia dei dati dei prezzi. Sebbene il mercato non sia sempre prevedibile, se esiste un modello nei prezzi, MetaForecast può prevedere il futuro con la massima precisione possibile. Rispetto ad altri prodotti simili, MetaForecast può generare risultati più accurati analizzando le tendenze di mercato. Parametri di input Past size (Dimensione passata) Specifica il numero di barre che MetaForecast utilizza per creare
Trade smarter, not harder: Empower your trading with Harmonacci Patterns This is arguably the most complete harmonic price formation auto-recognition indicator you can find for the MetaTrader Platform. It detects 19 different patterns, takes fibonacci projections as seriously as you do, displays the Potential Reversal Zone (PRZ) and finds suitable stop-loss and take-profit levels. [ Installation Guide | Update Guide | Troubleshooting | FAQ | All Products ] It detects 19 different harmonic pri
Dark Support Resistance  is an Indicator for intraday trading. This Indicator is programmed to identify  Support and Resistance Lines , providing a high level of accuracy and reliability. Key benefits Easily visible lines Only the most important levels will be displayed Automated adjustment for each timeframe and instrument Easy to use even for beginners Never repaints, never backpaints, Not Lag 100% compatible with Expert Advisor development All types of alerts available: Pop-up, Email, Push
Weis Wave with Alert MT5
Trade The Volume Waves Single Member P.C.
4.94 (17)
Rental/Lifetime Package Options and Privileges  Rent Monthly Six Months   Yearly/Lifetime Weis Wave with Speed with Alert+Speed Index x x x Manual  x x x Quick Set up Video x x x Blog x x x Lifetime Updates x x x Setup and Training Material x x Discord Access Channel "The SI traders"          x Rectangle Break Alert Tool      x How to trade with it:    http://www.tradethevolumewaves.com   ** If you purchase please contact me to setup your  : Training Room and  complete manual access.  Wei
Rtc ML Ai Predictor
Muhammad Faisal Sagala
Rtc ML Ai | Predictor CORE MACHINE LEARNING ENGINE Adaptive ML Market Predictor – Multi-Bar Trend & Candle Forecast What This Indicator Does This indicator is a  real-time market prediction engine  designed to analyze price behavior and estimate  future market tendencies . Unlike conventional indicators, this system  does not rely on static parameters or historical curve-fitting , but adapts its internal state dynamically during live market operation. Instead of using static rules, the indic
Golden Spike Premium
Kwaku Bondzie Ghartey
5 (1)
Golden Spikes Indicator Technical indicator for synthetic indices trading on M1 timeframe. Compatible with Boom/Crash indices on Deriv platform and Gain/Pain indices on Weltrade platform. send me A private  message to receive trade ASISTANT EA.. booklet guide:  https://drive.google.com/file/d/1knQJqGHZSP5eQN24ndRz2ayZVCst6XhN/view?usp=sharing Also check my premium spikes bot: https://www.mql5.com/en/market/product/142350 Features Uses Parabolic SAR, RSI, and Bollinger Bands analysis Three risk
Altri dall’autore
Il rilevatore di terremoti del mercato  del sismografo. Description in English : https://www.mql5.com/en/market/product/113869?source=Site+Market+Product+Page#description How to use the Seismograph : https://www.mql5.com/en/market/product/113869#!tab=comments&page=2&comment=52806941 Create an EA : https://www.mql5.com/en/market/product/113869#!tab=comments&page=3&comment=52816509 Qualunque sia il modo in cui fai trading, vuoi assolutamente evitare di entrare nel mercato a bassa liquidità.
* Data l'autenticità dei dati per tutte le principali valute, si consiglia l'utilizzo di grafici in tempo reale. Cos'è UEX Pure USD Euro Index : Descrizione in inglese: https://www.mql5.com/en/market/product/152936 Scopri il vero polso del mercato forex con Pure USD & Euro Index — un indicatore innovativo che rivela davvero i punti di forza e di debolezza nascosti tra le due valute più potenti al mondo. Invece di basarsi su una singola coppia come EURUSD, questo strumento misura la performan
Current event:  https://c.mql5.com/1/326/A2SR2025_NoMusic.gif R. Cos'è l'A2SR ?   * È un indicatore tecnico leader (nessuna riverniciatura, nessun ritardo). -- Guida : -- su https://www.mql5.com/en/blogs/post/734748/page4#comment_16532516 -- e https://www.mql5.com/en/users/yohana/blog A2SR ha una tecnica speciale per determinare i livelli di supporto (domanda) e resistenza (offerta). A differenza del modo ordinario che abbiamo visto in rete, A2SR ha un concetto originale nel determinare i li
Current event:  https://c.mql5.com/1/326/A2SR2025_NoMusic.gif A2SR per MT5 Indicatore: Domanda e Offerta Effettive Automatizzate (S/R). + Strumenti di Trading. Product description in English here. --   Guidance   : -- at   https://www.mql5.com/en/blogs/post/734748/page4#comment_16532516 -- and  https://www.mql5.com/en/users/yohana/blog Potente, Autentico e Risparmio di Tempo per Decisioni di Trading più Intelligenti + Oggetti compatibili con EA. Vantaggi Principali Livelli di SR Effettivi
Key Breakout and Jump/Fall levels. No lagging. No repaint. Trend line is useful for detecting pattern, which is intended for the triangle pattern, Support & Resistance lines, and as a breakout up or down line.  The trend lines are formed first before the price of the pair reach it. So it does not repaint.  Each line has a description, such as Support, Resistance, Current-Support as key breakout down, and Current-Resistance as a key breakout up.  Each broke out line turns into a new support or re
Semi Automated EA for working as your trading assistant. Overview Trading planner will make you act like professional traders in real markets. Before entering markets, they make a plan for their trades, screening out all opportunities in all time frames. Trading Planner can be used for all Time Frames (M1 ~ MN). Simply draw trendline as a trend and Support/Resistance . At this version , market opportunities will be taken by trendline using strategy of 1, 2, 3 . Simply draw the trendline by defin
Ideally, this is we hope : The good numbers on news should make the related currency become stronger, and the bad numbers on news should make the related currency become weaker. But the fact is: The good numbers on news that has been written on the economic news calendar could not always instantly make the related currency become stronger. and vice versa, the bad numbers could not always instantly make the related currency become weaker. Before placing new position: We need to know which actuall
Trades Manager MT4
Yohana Parmi
5 (3)
What Trades Manager can do for your trades . Collect all order positions into one chart (pict. 1). All orders will be grouped by pair symbol , sum of order positions, lots, running pips, and profit/losses. All orders will be summarized and displayed at the bottom of the panel. You can set target profit, stop loss and placing stop-profit automatically to each order (pict. 4). From one chart, it will be easier to monitor and manage all orders without moving to another chart. The green color is sur
Filtro:
Nessuna recensione
Rispondi alla recensione