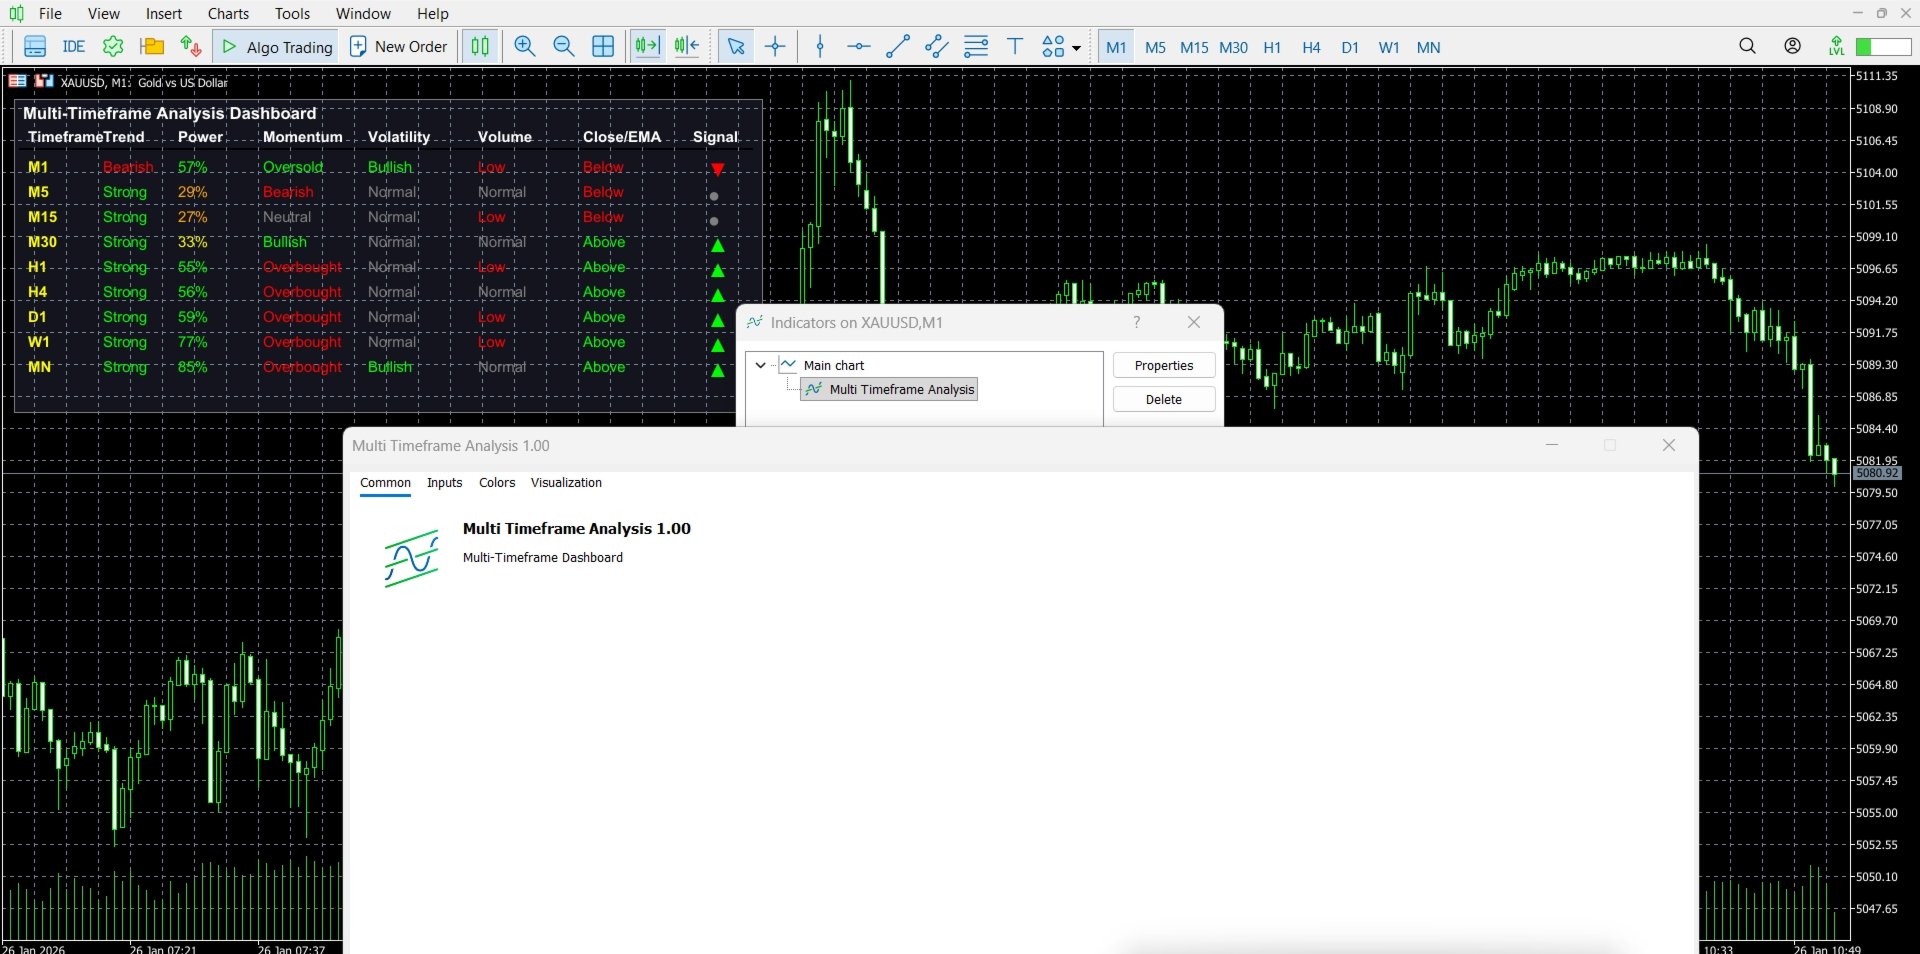
Multi Timeframe Analysis
- Indicatori
- Versione: 3.0
- Aggiornato: 28 marzo 2026
- Attivazioni: 10
FREE 7-DAY TRIAL
After your trial ends, continue using this essential trading tool for only $30 one-time payment.
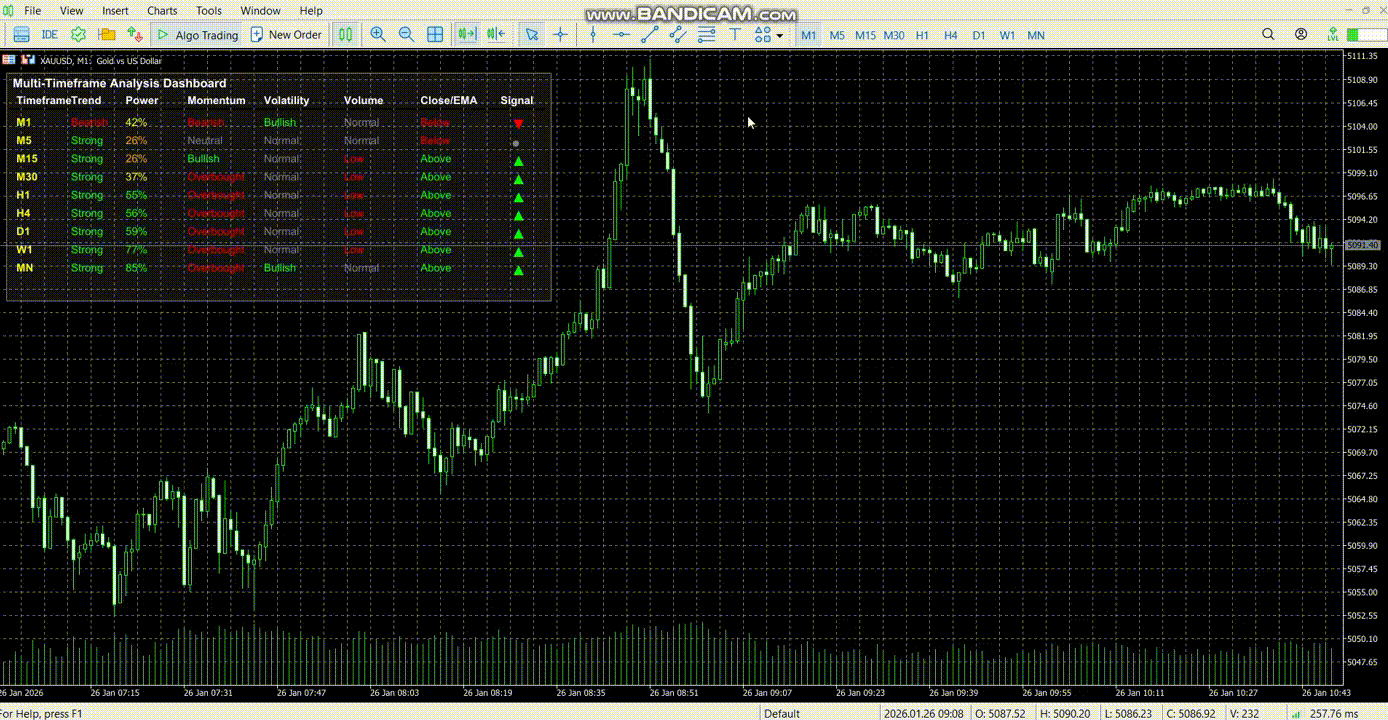
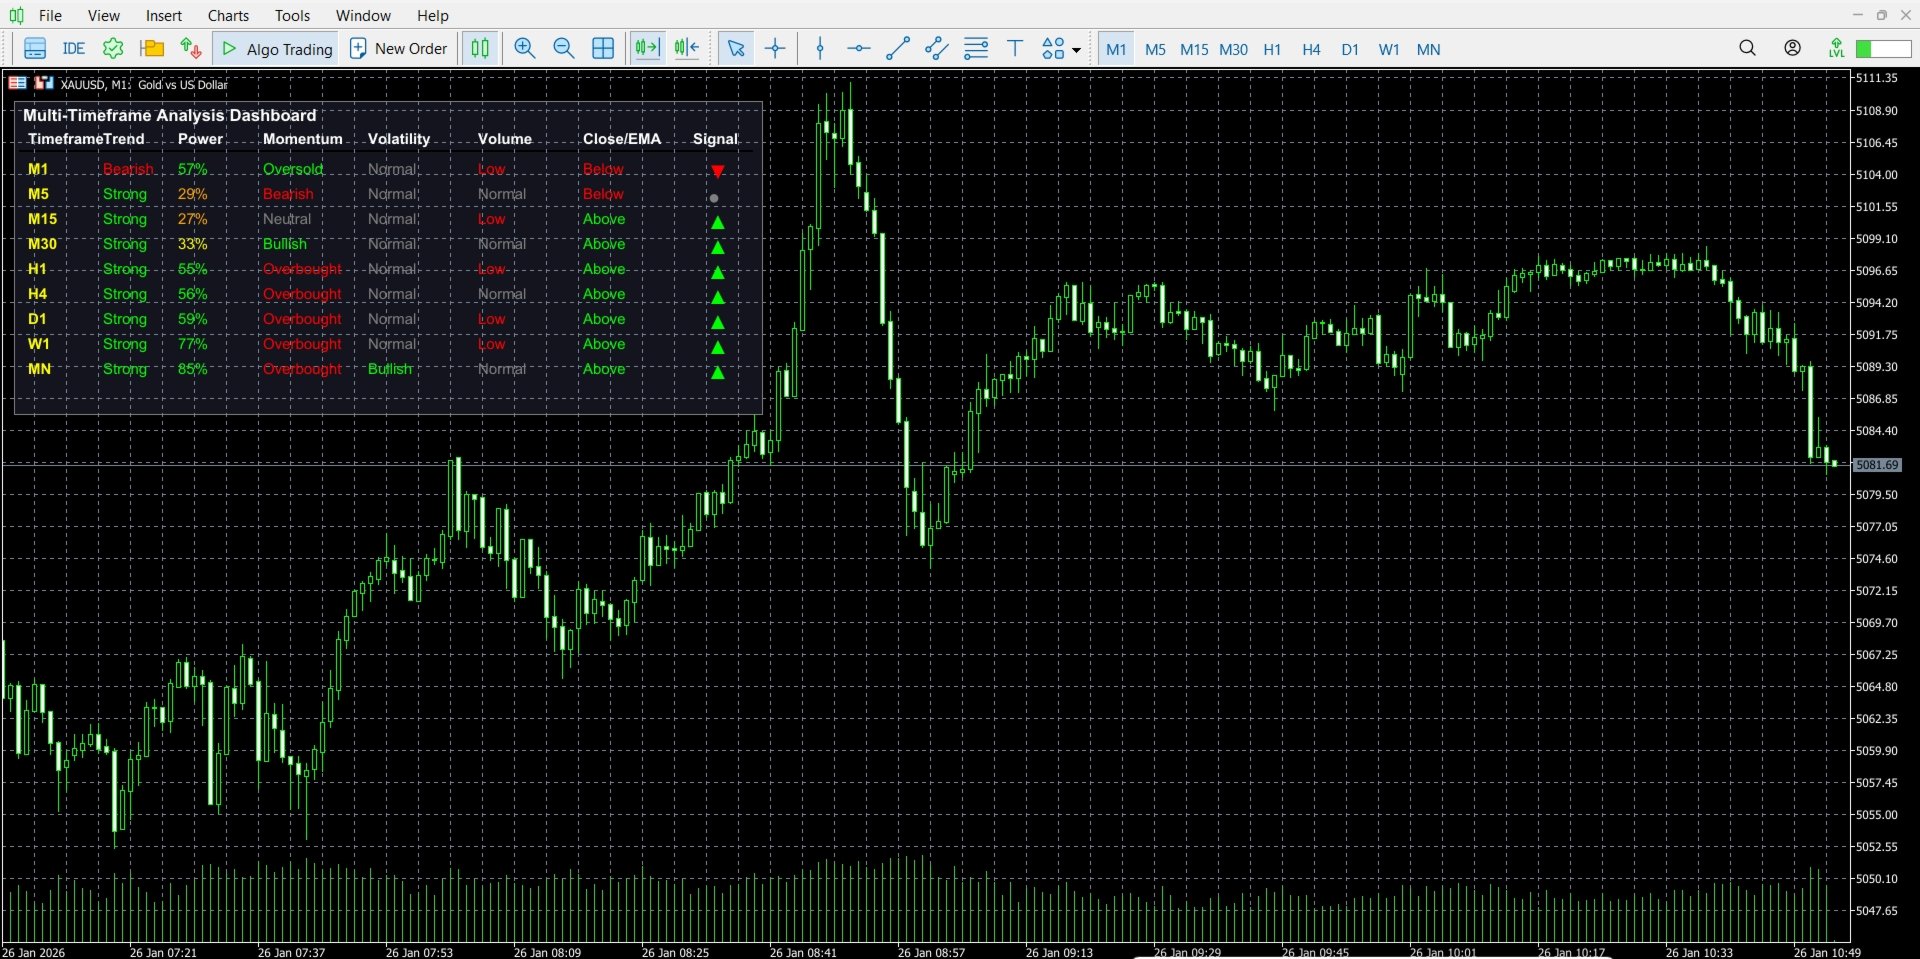
Multi-Timeframe Dashboard Indicator
A comprehensive multi-timeframe analysis tool that displays market conditions across 9 timeframes simultaneously on a single dashboard panel.
Timeframes Analyzed
M1, M5, M15, M30, H1, H4, D1, W1, MN
Toggle visibility for each timeframe individually
Analysis Metrics
Trend - EMA crossover status (Strong/Weak/Bearish/Neutral)
Power - ADX strength percentage
Momentum - RSI-based momentum (Bullish/Bearish/Overbought/Oversold/Neutral)
Volatility - ATR comparison against 10-period average
Volume - Current volume vs average volume status
Close/EMA - Price position relative to fast EMA (Above/Below)
Signal - Combined signal with directional arrows (BUY / SELL / NEUTRAL)
Configuration
Adjustable indicator periods:
RSI Period (default: 14)
ADX Period (default: 14)
ATR Period (default: 14)
Fast EMA (default: 20)
Slow EMA (default: 50)
Display settings:
Corner position (4 options)
X/Y offset
Background and text colors
Bullish/Bearish/Neutral colors
Timeframe selection:
Enable/disable any timeframe
Panel auto-adjusts height based on visible timeframes
Usage
The indicator automatically calculates and displays all metrics for selected timeframes. Each row shows complete market analysis for one timeframe. Signals combine trend, momentum, and price position to generate BUY/SELL/NEUTRAL recommendations.
Color coding:
Green = Bullish conditions
Red = Bearish conditions
Gray = Neutral conditions
Yellow = Timeframe label
Gradient = Power/strength levels