 MetaTrader 5
 Experts
 Indicatori
 librerie
 Utilità
 Widget
 Regole
Guarda i video tutorial del Market su YouTube
Come acquistare un Robot di Trading o un indicatore
Esegui il tuo EA
hosting virtuale
hosting virtuale
Prova un indicatore/robot di trading prima di acquistarlo
Vuoi guadagnare nel Market?
Come presentare un prodotto per venderlo con successo
Nuovi indicatori tecnici per MetaTrader 5 - 11
 I segnali degli indicatori tecnici giocano un ruolo cruciale nell'apertura e nella chiusura delle transazioni sui mercati azionari e Forex. L'essenza degli indicatori è una trasformazione matematica del prezzo di un simbolo finanziario, finalizzata alla previsione dei cambiamenti futuri dei prezzi. Prova gli indicatori tecnici, per prevedere al meglio il comportamento del mercato e ricavarne dei guadagni.

Adaptive Volume Profile disegna il Volume Profile delle ultime barre direttamente sul grafico: il Point of Control (POC), la Value Area (VAH / VAL), i nodi ad alto volume (HVN), i nodi a basso volume (LVN) e un istogramma del volume opzionale. La dimensione delle righe di prezzo si adatta alla volatilità corrente (ATR), così il profilo resta leggibile su qualsiasi simbolo e timeframe. Caratteristiche POC - il livello di prezzo con il maggior volume scambiato nella finestra Value Area (VAH / VAL)
FREE

Questo è un indicatore di livello professionale che aiuta l'utente a valutare la tendenza attuale del mercato e fornisce segnali di acquisto e vendita sul grafico, insieme a un sistema di avvisi integrato per i segnali e per i diversi livelli di Take Profit (TP). Ciò detto, quando si utilizza questo indicatore è necessario praticare una corretta gestione del rischio e supervisionare le posizioni e gli ordini inseriti. L'indicatore può solo suggerire acquisti e vendite in base alla sua logica e a

Fair Value Gap Fill Tracker individua i Fair Value Gap (FVG, chiamati anche squilibri) e li disegna sul grafico come zone colorate. Un Fair Value Gap è uno schema di tre candele in cui le ombre della prima e della terza candela non si sovrappongono, quindi la candela centrale lascia un'area del grafico che il prezzo ha attraversato molto rapidamente. L'indicatore segna quest'area, la estende verso destra e segue ciò che il prezzo fa con essa: la zona resta aperta finché il prezzo non la riempie.
FREE

How does your entry idea perform on your chosen market and timeframe? Mihenk is a free MetaTrader 5 indicator that brings signal testing, chart analysis and multi-symbol scanning into one panel. Adapt predefined entry rules to your strategy, compare their historical behaviour and follow your chosen signal live. Choose, adjust and test your entry idea Signal test offers 19 configurable entry rules in four groups: indicators, candlestick patterns, breakout and trend, and liquidity sweeps. Use RSI
FREE

ATR Bands & Multi-Timeframe Trend Matrix per MT5 Cattura la volatilità. Valuta la forza del trend. Non perdere mai un movimento significativo del mercato. ATR Bands & Multi-Timeframe Trend Matrix è uno strumento di trading professionale per MetaTrader 5 che combina bande ATR dinamiche con una dashboard interattiva per la scansione del mercato. Monitorando simultaneamente decine di coppie valutarie e diversi timeframe, filtra istantaneamente il rumore di mercato, individua i trend più forti e ril

Liquidity Pool Heatmap – Dove aspettano gli stop: liquidità buy-side e sell-side come heatmap con profilo
Liquidity Pool Heatmap mostra dove probabilmente si trovano gli ordini stop: sopra i massimi di swing (liquidità buy-side, BSL) e sotto i minimi di swing (liquidità sell-side, SSL). Ogni pool viene disegnato sul grafico come una linea di calore: più il pool è forte, più la linea è spessa e luminosa. Un profilo a destra mostra come la liquidità aperta si distribuisce sul prezzo.
COSA VEDI
FREE

Pivot Points Classic and Camarilla disegna i livelli pivot Classic (P, R1-R3, S1-S3) e i livelli Camarilla (H1-H4, L1-L4) direttamente sul grafico. I livelli sono calcolati da High, Low e Close del periodo precedente del timeframe scelto (D1 per impostazione predefinita) e ogni periodo è disegnato come linea orizzontale sul periodo a cui si riferisce, così si vede come il prezzo ha reagito ai livelli nei giorni, nelle settimane o nei mesi precedenti. Funzioni Pivot Classic - il pivot centrale P
FREE

Gotobi Day and Tokyo Fixing Marker è un indicatore gratuito che segna sul grafico di MetaTrader 5 i giorni gotobi giapponesi, l'orario del fixing di Tokyo e le festività bancarie giapponesi, e mostra i prossimi giorni gotobi in un piccolo pannello. I giorni gotobi sono il 5, il 10, il 15, il 20 e il 25 di ogni mese e l'ultimo giorno del mese. Quando uno di questi giorni cade nel fine settimana o in una festività bancaria giapponese, viene anticipato al giorno lavorativo precedente a Tokyo. In qu
FREE

3EMA — Tre Medie Mobili per MetaTrader 5 3EMA riunisce tre medie mobili in un unico indicatore, con periodi iniziali di 13, 20 e 200. Uno strumento visivo per osservare la direzione delle medie, i loro incroci e la posizione del prezzo rispetto a diversi riferimenti di tendenza. Caratteristiche:
• Tre medie mobili direttamente sul grafico.
• Periodi regolabili individualmente.
• Metodo selezionabile: semplice, esponenziale, smussato o ponderato lineare.
• Il metodo selezionato si applica a t
FREE

Trend Cycle Analyzer Indicatore di analisi dei cicli di trend per MetaTrader 5 Utilizzo questo indicatore nella mia attività di trading su un conto reale. Su MQL5 Signals puoi consultare lo storico delle operazioni, le posizioni aperte e chiuse e le statistiche del conto. Il mio conto di trading reale: https://www.mql5.com/ru/signals/2385035?source=Site +Signals+My Descrizione dell’indicatore Trend Cycle Analyzer è un indicatore analitico per MetaTrader 5 progettato per studiare i cicli di
FREE
Multi Timeframe Average True Range mostra la volatilità (ATR) di QUALSIASI timeframe sul grafico su cui lavori, ad esempio l'ATR di M15 o H1 su un grafico M1. Imposta stop, target e filtri in base alla volatilità del timeframe da cui operi davvero. Caratteristiche Volatilità di un timeframe selezionato su qualsiasi grafico (da M1 a MN1) ATR standard o NATR (ATR troncato): i True Range più grandi (o entrambi gli estremi) vengono scartati prima della media, così una singola candela di notizie non
FREE

Pannello di monitoraggio delle posizioni Utilizzo questo indicatore nella mia attività di trading su un conto reale. Desidero mostrare non soltanto i risultati delle operazioni, ma anche gli strumenti che utilizzo quotidianamente nel mio lavoro sui mercati. Puoi consultare la mia cronologia di trading, visualizzare le operazioni aperte e chiuse e valutare le statistiche del mio conto reale su MQL5 Signals. Il mio conto di trading reale: https://www.mql5.com/ru/signals/2385035?source=Site +Sig
FREE

Retest Pivot Signals è un indicatore per MetaTrader 5 che rileva la rottura di un livello pivot importante e genera il segnale solo dopo il retest di quel livello, cioè quando il prezzo torna sulla linea rotta e rimbalza da essa. Questo filtra una parte delle false rotture: il segnale arriva dopo la conferma del livello e non nel momento della rottura. MT4-version: https://www.mql5.com/en/market/product/200236
Come funziona L'indicatore individua i massimi e i minimi pivot. Un pivot viene conf

Volume Delta Candles MTF – Candele colorate in base al delta di volume dei tick, delta multi-timeframe e assorbimento a colpo d'occhio
Volume Delta Candles MTF colora le candele del tuo grafico principale in base al delta di volume dei loro tick: l'equilibrio tra volume di acquisto e di vendita all'interno di ogni candela. La candela mantiene la sua forma reale, solo il colore mostra chi aveva il controllo. Il delta può essere calcolato su un timeframe superiore a quello del grafico (per esemp

ApexConverge è un indicatore per MetaTrader 5 che rileva automaticamente le figure a triangolo (ascendente, discendente e simmetrico), ne disegna i confini con un'area ombreggiata e segnala con una freccia la candela di rottura. MT4-version: https://www.mql5.com/en/market/product/200443
Come funziona L'indicatore individua massimi e minimi di swing, traccia due trendline attraverso di essi e verifica la forma: resistenza piatta con supporto crescente è un triangolo ascendente; resistenza discen

Non inseguire il prezzo. Impara a leggere i suoi rifiuti. TITAN SCALPING PRO v3.02 Un indicatore di scalping di precisione basato sul rifiuto del prezzo e sulle configurazioni delle candele giapponesi. Il mercato non si limita a muoversi. A volte rifiuta determinati livelli di prezzo. TITAN SCALPING PRO è progettato per identificare i momenti in cui il prezzo viene respinto in una specifica area. Combinando le configurazioni delle candele giapponesi con i livelli di prezzo basati su Fibonacci, l

Elliott Live è un indicatore per MetaTrader 5 che segna automaticamente le onde di Elliott, sia sullo storico sia sulla candela in corso. Le onde completate sono disegnate con linea continua; l'onda in formazione con linea tratteggiata e un punto interrogativo (ad esempio «3?»), insieme agli obiettivi di Fibonacci e al livello di invalidazione. MT4-version: https://www.mql5.com/en/market/product/200613
Come funziona Per prima cosa l'indicatore costruisce gli swing (ZigZag). Un'inversione viene

Indicatore Crypto_Forex Oscillatore MACD HTF per MT5. - HTF significa "timeframe più ampio". - L'indicatore MACD è uno degli indicatori più popolari per il trading sui trend. - Questo indicatore è eccellente per sistemi di trading multi-timeframe con ingressi di Price Action o in combinazione con altri indicatori. - L'indicatore MACD HTF consente di collegare il MACD da timeframe più ampio al grafico corrente --> questo è un approccio di trading professionale. - L'indicatore ha avvisi integrati

Chart Pattern and True SR Analyzer
Leggi la struttura. Anticipa il movimento.
Rimani informato. Mantieni la flessibilità. Non perdere mai un evento di mercato importante.
· Riconoscimento di pattern grafici con proiezione del prezzo
· Supporti e Resistenze Reali (True S/R)
Chart Pattern and True SR Analyzer combina il riconoscimento dei pattern grafici, le proiezioni di prezzo basate sui pattern
e i Supporti e Resistenze Reali per aiutarti a comprendere la struttura del mercato ed esplorare
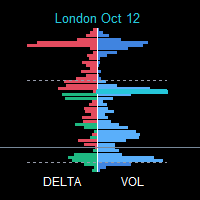
SessionFlowMap — Profilo multi-sessione di volume e delta con livelli POC SessionFlowMap costruisce un profilo di volume e un profilo di delta (squilibrio tra acquisti e vendite) per le sessioni della giornata forex: Asia, Londra, New York e, facoltativamente, Sydney e una sessione personalizzata. Per ogni sessione individua il POC (Point of Control: il prezzo con il maggior volume scambiato) e la Value Area (VAH e VAL: l'intervallo che concentra la maggior parte del volume) e prolunga questi li

Currency Pulse — pannello di forza delle valute per MetaTrader 5 A cosa serve Currency Pulse mostra in un unico pannello compatto sul grafico quali valute sono forti e quali deboli in questo momento, su più timeframe contemporaneamente. Da questa classifica l'indicatore ricava le coppie con la maggiore divergenza tra le valute: comprare la forte, vendere la debole. L'indicatore non dipende dal simbolo del grafico su cui viene applicato. MT4 -version: https://www.mql5.com/ru/market/product/20119

Bitcoin Regime Matrix Bitcoin Regime Matrix is a closed-bar BTCUSD regime indicator for MetaTrader 5. It is designed for H1 and classifies the market as LONG, SHORT or NEUTRAL. Kit di ottobre 2026: configurazione, valori predefiniti e confronto delle simulazioni . MT5 Setup Hub . The indicator combines a slow exponential baseline with a slope filter, confirmed entry distance, exit hysteresis and realized-volatility measurement. Its dashboard keeps the active regime, recommended exposure, annuali

Namiyomi Zero Shot Range prevede fin dove può muoversi il prezzo nelle prossime 1, 4 e 24 ore — il range atteso tra massimo e minimo — con un'IA zero-shot per serie temporali che funziona all'interno di MetaTrader 5. Non prevede la direzione. Cosa vedi Now (ora) — il range atteso tra massimo e minimo per le prossime 1, 4 e 24 ore (in pip sulle quotazioni a 5 e 3 decimali; in prezzo per BTCUSD) e come si confronta la previsione a 4 ore di oggi con la mediana delle previsioni a 4 ore fatte a quest

MQLTeam Currency Power mette due valute su un grafico e mostra quale è più forte. Ogni valuta ha il suo paniere di coppie. Le colonne nella finestra dell'indicatore sono la differenza tra i due panieri, e la tabella mostra la coppia che produce questa differenza. L'esempio pronto è l'euro contro il dollaro. Se cambi i due nomi e gli elenchi delle coppie, il modo di leggerlo resta lo stesso per qualunque coppia di valute. Disponibile anche: MQLTeam Currency Power per MetaTrader 4 Il valore è in p

ValueOrbit mostra dove si trova il prezzo «equo» del periodo corrente e di quanto il mercato se ne è allontanato. È uno strumento di contesto: disegna una linea centrale Value Core con tre coppie di orbite (±1σ, ±2σ, ±3σ) attorno, e il pannello indica quanto il prezzo è esteso. Non genera segnali di ingresso. MT4-version: https://www.mql5.com/en/market/product/201304
Come funziona Il Value Core è un livello di riferimento che si costruisce dall'inizio di ogni periodo (sessione, settimana o mes

Barbaduque Lot Calculator — Calcolatore di lotti per MetaTrader 5 Calcola il volume dell’operazione direttamente sul grafico in base al rischio desiderato e alla distanza dallo stop loss. Il calcolatore riconosce automaticamente il simbolo del grafico e utilizza la dimensione e il valore del tick forniti dal broker per stimare il volume in lotti. Funzionalità principali Rischio in percentuale sul saldo o sull’equity del conto, oppure importo fisso nella valuta del conto. Impostazione predefinita
FREE

RM Cycle MTF disegna in una sotto-finestra un oscillatore di ciclo di mercato "smussato" e permette di visualizzare il ciclo di QUALSIASI timeframe sul grafico corrente — senza cambiare grafico. Nella finestra dell'indicatore c'e' una pulsantiera dei timeframe compatta e a scomparsa: scegli un timeframe e il ciclo si ricalcola all'istante.
L'oscillatore oscilla attorno a una linea dello zero: il riempimento verde sopra lo zero indica la fase di salita del ciclo, quello rosso sotto la fase di d
FREE

Meridia Session Suite riunisce in un pannello ordinato gli strumenti che chi opera sulle sessioni usa ogni giorno. Ogni strumento si accende e si spegne con un clic, e il pannello ricorda le tue scelte. Candele multi-timeframe Disegna le candele M15, M30, H1, H4, D1 e W1 direttamente sul grafico che stai guardando, fino a 500 per timeframe. La candela H1 in corso mostra il conto alla rovescia alla chiusura. Quando si apre una nuova candela la più vecchia viene tolta, così il grafico resta legger

Meridia Sessions è l'edizione essenziale di Meridia Session Suite. Disegna le candele H1 su qualsiasi timeframe inferiore, con il conto alla rovescia alla chiusura della H1 in corso, e le sessioni di Asia, Londra e New York come riquadri con massimo e minimo. Sessioni che seguono ogni cambio d'ora Ogni sessione ha il suo fuso orario (Europa centrale, Londra, New York, Tokyo, Sydney, UTC o ora del server) e l'ora legale è applicata da sola ogni anno, quindi i riquadri restano al posto giusto a og
FREE

Candle Timer & Spread — indicatore MT5 gratuito Un indicatore MetaTrader 5 leggero e puramente visivo che mostra il tempo rimasto sulla candela corrente e segnala quando lo spread diventa anomalo. Non fa trading e non blocca nulla. Cosa mostra Countdown della candela (mm:ss) in basso a destra nel grafico. Il colore dei numeri segue lo spread rispetto allo spread tipico dello strumento: Verde — normale (≤ 1.35× il tipico) Giallo — medio (≤ 2×) Arancio — alto (≤ 3×) Rosso — esagerato (> 3×) Grigio
FREE

Shyft Lab Fattah Engulfing Block Zones is a gold-focused analytical indicator for MetaTrader 5. It turns the chart into a simple battle map: where the higher timeframe is strong, where price is likely to react, and where price is likely heading. It does not place trades. You stay in control.
WHAT YOU GET
- Fort zones: the higher timeframe areas that matter, drawn for you on the chart. - Kill zones: the areas where price may react, marked on the M30 chart. - Objective lines: the nearest target

9 EMA Cross Alert per MetaTrader 5
Ricevi l'avviso nel momento esatto in cui il prezzo incrocia la EMA a 9 periodi, non dopo la chiusura della candela. Questo indicatore controlla ogni tick e si attiva appena il prezzo supera la EMA della distanza che scegli. Il valore predefinito è di appena 0,1 pip e puoi modificarlo.
Caratteristiche
* Rilevamento degli incroci in tempo reale, tick per tick (al rialzo e al ribasso) * Sensibilità dell'incrocio regolabile in pip, con la dimensione del pip ge

JT360 Volume – Indicatore di volume gratuito per MT5 Semplice. Chiaro. Personalizzabile. JT360 Volume è un indicatore di volume leggero per MetaTrader 5, progettato per aiutare i trader a monitorare l’attività del mercato e confrontare il volume attuale con la sua media mobile. L’indicatore visualizza il volume attraverso un istogramma colorato e lo completa con una media mobile del volume configurabile, entrambi visualizzati in una finestra separata del grafico. Caratteristiche principali Istog
FREE

Se sei un trader impegnato e cerchi operazioni swing, questo indicatore fa per te. Controlla il mercato una volta al giorno e invia un avviso al tuo telefono quando c'è un'opportunità, così non devi guardare i grafici tutto il giorno. Lanko Dip Signals segnala i ritracciamenti di breve periodo sui principali indici azionari mentre sono in un trend rialzista di lungo periodo. Mostra solo segnali. Non apre né chiude operazioni. Come funziona L'indicatore segue US30, US100 e GER40 contemporaneament

JT360 VWAP V1.21 – VWAP Giornaliero, Settimanale e Mensile per MetaTrader 5 Analisi precisa del VWAP direttamente sul grafico JT360 VWAP è un indicatore professionale per MetaTrader 5 che visualizza i livelli del prezzo medio ponderato per volume (VWAP) giornaliero, settimanale e mensile. Include inoltre tre coppie di bande di deviazione standard giornaliere che aiutano i trader a valutare la posizione del prezzo e la sua distanza dal VWAP giornaliero. Caratteristiche principali VWAP giornaliero
FREE

JT360 DNA PBO Template V2.7 Public – Analisi grafica multimodale per MetaTrader 5 Descrizione del prodotto JT360 DNA PBO Template è uno strumento versatile per l'analisi grafica su MetaTrader 5. Combina diverse modalità di visualizzazione delle candele, sei medie mobili configurabili, VWAP giornaliero, settimanale e mensile e un indicatore visivo dello stato PBO in un unico indicatore. L'obiettivo è offrire un ambiente grafico flessibile, adattabile a diversi stili di trading e approcci analitic

APEX PRO SIGNAL Market Structure, Supply & Demand Zones and Trend Panel in One Indicator
Apex Pro Signal is a price-action indicator for MetaTrader 5. It draws the three things many discretionary traders check first: market structure, key supply and demand zones, and the higher-timeframe bias. The goal is simple: help you find potential entry and exit areas on a clean, readable chart.
WHAT YOU GET
- BOS & CHoCH market structure Break of Structure and Change of Character levels are drawn an
FREE

Advanced Harmonic Chart Pattern Harmonic trading works, but spotting the patterns by hand is slow. You measure the swings, check the Fibonacci ratios, and by the time you’re sure, the move has often happened. Advanced Harmonic Chart Pattern does that scanning for you and puts the result on your chart. It looks for 30 harmonic and geometric patterns, including Gartley, Bat, Alt Bat, Max Bat, Butterfly, Crab, Deep Crab, Cypher, Shark, 5-0, Leonardo, Nen Star, Three Drives, AB=CD and Wolfe Wave. It

Smart Level Map draws the price levels many traders check before they trade, all in one indicator. Open a chart and the map is already there: no manual lines, no extra indicators.
What it shows - Previous day high/low zones (wick zones) and the daily open (DO) - Weekly open (WO), previous week high/low (PWH/PWL) - Monthly open (MO), previous month high/low (PMH/PML) - Daily pivot points (PP, R1-R3, S1-S3); weekly and monthly pivots can be turned on - Asia, London and New York session boxes with

SMC LEGENDS $56 NOW → $66 NEXT | Price +$10 every 10 copies sold | MT4 VERSION HERE updates posted regularly | DON'T MISS IT! SMC LEGENDS is a professional institutional-grade Smart Money Concepts (SMC) trading engine for MetaTrader 5 . combining market structure analysis, TPO Market Profile, auto signal alerts, live trade management, and a full trading command center in one indicator. Core Features # Feat

MicroScalper Spread Monitor is a lightweight, institutional-grade utility designed to protect your trading accounts from broker manipulation and sudden spread widening during high-impact news events. Essential for Prop Firm traders and scalpers, this tool sits discreetly on your chart and monitors the spread in real-time. If the broker widens the spread beyond your defined safety threshold, the monitor instantly alerts you visually, keeping you out of dangerous market conditions. Key Features: R
FREE

Volume Profile Horizon Where Volume Concentrates. Manual ranges. Daily volume profiles. Multiple market periods on one MetaTrader 5 chart. Volume Profile Horizon is an interactive fixed-range volume analysis indicator for MetaTrader 5. It converts available broker tick-volume data into a horizontal distribution across price levels, helping traders examine where estimated market activity was concentrated within a chosen period. Instead of applying a single profile to an entire chart, you decide p
FREE

MicroScalper News Protector is an institutional-grade visual economic news traffic light and high-resolution countdown timer specifically engineered for Prop Firm funded traders, scalpers, and day traders. Trading during high-impact macroeconomic releases (such as NFP, CPI, or FOMC) is one of the main reasons traders lose their funded accounts due to sudden slippage, spread widening, or strict Prop Firm news-trading prohibitions. This utility keeps your situational awareness at 100% right on you
FREE

MicroScalper Timer is a premium, institutional-grade candle countdown utility designed for scalpers, day traders, and Prop Firm funded traders who demand absolute precision. Unlike standard timers that freeze when market volatility drops, this indicator is entirely independent of market ticks . Powered by an advanced OnTimer() engine, it updates flawlessly every real second, ensuring you know exactly when the next candle opens. What makes it truly unique is its built-in catalog of 10 Boutique Wa

RSI Regime Pulse RSI Regime Pulse is a trend and momentum confirmation indicator for MetaTrader 5. It combines RSI pullback and reclaim behavior with EMA market regime, ATR activity and price-action confirmation. The indicator is designed for traders who do not want to use RSI only as a traditional overbought or oversold oscillator. Instead, RSI Regime Pulse looks for momentum returning in the direction of an established market regime after a temporary pullback. Signals are evaluated on complete

Apex Fibonacci Precision in Every Level Automatic or manual Fibonacci ranges. Multi-timeframe price levels. Custom retracement zones and optional alerts for MetaTrader 5. Apex Fibonacci is an interactive Fibonacci analysis indicator designed to make price retracements and extensions easier to examine on the chart. It combines a rolling automatic range, manual A/B anchors, selectable Fibonacci levels, multi-timeframe overlays, colored retracement bands, and price-interaction notifications within
FREE

Trading Sessions Kill Zones Regional sessions, New York kill zones, Silver Bullet windows, Asian range, day opens, previous day/week/month levels and ADR on one MT5 chart. See the structure of the trading day on your MT5 chart: regional sessions, intraday windows, the Asian range and reference levels in one indicator. Sydney, Tokyo, London and New York session boxes show each high, low and range in points. Regional daylight saving is handled separately. Choose soft translucent fills or clear out
FREE

VolPulse shows where volume traded in every session and turns it into a clear plan on your chart. Full user guide (setup, settings, how the arrows work): https://www.mql5.com/en/blogs/post/777075 What you get • Session volume profiles (1–10 sessions) with POC, value area (VAH / VAL) and HVN / LVN rows
• Session VWAP and developing POC / VAH / VAL lines that build up bar by bar
• Naked POCs — earlier POCs price has not returned to yet, with price and date
• Market-state panel: Bullish / Bearish /
FREE

AlphaTrend Pullback Pro Trend-following pullback signals, economic news filter, and professional dashboard — all in one indicator.
AlphaTrend Pullback Pro transforms trend and correction analysis into clear, actionable visual signals. It identifies the macro market direction on a higher timeframe, waits for a pullback to the moving average, confirms rejection with a trend-aligned close, and triggers the entry point. No repainting on closed bars, no noise, no complexity.
Why AlphaTrend Pullbac

Correlation Radar PRO — Multi-Asset Correlation Dashboard for MetaTrader 5 Short Description: Eliminate market noise and spot price divergences in seconds. Correlation Radar PRO calculates historical, monthly, weekly, and real-time correlations across multiple assets and lets you overlay candles directly on your chart without switching your main symbol. Full Description: Manually switching charts to understand inter-market relationships wastes precious time and leads to missed setups. Correlatio

Grid baskets rarely break in a quiet market. They break when a trend starts and nobody notices it in time.
LTS Trend Strength is the market-regime filter from LTS - Legacy Trading System. In one look it tells you whether the market is ranging, in transition or in a strong trend, on your chart and on four higher timeframes at the same time. It is built on the same ADX and ATR principles we use to protect our Expert Advisors, and it is free. It is a market filter, not an entry signal: it tells yo
FREE

SHORT DESCRIPTION Daily direction, Asian Range and weekly target in one panel - see at a glance whether today is a day to buy, to sell or to wait.
FULL DESCRIPTION
Bias Compass (Biasco) answers one question every trading day: which way should I look for trades today, and do the other factors agree? Instead of switching between daily, weekly and hourly charts, you see the answer in one panel on any chart.
WHAT IT CHECKS
1. Daily Bias - the direction suggested by yesterday's daily candle comp

Gold Pullback Entry Signals is an MT5 indicator for closed-candle pullbacks within a higher-timeframe direction. Defaults are prepared for XAUUSD, and the same indicator works on other symbols. Daily bar-based VWAP, EMA slope and confirmed swing structure define the bias. Setups use EMA, VWAP, Fibonacci impulse zones and the Asian range with a rejection candle. Grade A marks two or more overlapping level families; grade B marks one. Each confirmed signal exposes an entry reference, stop and thre

Order Blocks, Liquidity and Fair Value Gaps with a clear BUY/SELL/NEUTRAL bias and confluence entry signals. A clean Smart Money tool for MT5.
TrendSync OrderBlock turns Smart Money structure into a clear decision. Instead of flooding the chart, it shows only what matters near price - and which way structure is leaning now. Works on any symbol and timeframe. MetaTrader 5.
FEATURES - Directional Bias: BUY / SELL / NEUTRAL read live in the panel. - Order Blocks: institutional Buy Zones (demand)
FREE

RSI with MA and Divergence is a technical indicator for MetaTrader 5 that combines the Relative Strength Index (RSI), moving-average smoothing, optional Bollinger Bands, and regular bullish and bearish divergence detection in a single indicator window. It is designed for traders who want to examine market momentum, identify overbought and oversold conditions, and compare RSI behavior with price movements. The indicator includes customizable levels, visual highlights, optional divergence alerts,
FREE

ICT Power of 3 HTF Candles See the higher-timeframe candle forming while you trade the lower timeframe. The indicator projects HTF candles to the right of your chart, built live from your current symbol’s data. You can read the Power of 3 structure without switching timeframes. Background: the Power of 3 The Power of 3 (PO3, also written AMD) is an ICT concept. It describes a candle, a session or a whole day as three phases that repeat on every timeframe. Accumulation: price moves sideways near

TradeGuard EMA Crossover Watch EMA Crossover Indicator with EMA 200 Trend Filter, Buy/Sell Arrows and Push Alerts for MetaTrader 5 TradeGuard EMA Watch is a free technical indicator for MetaTrader 5 designed to monitor exponential moving average (EMA) crossovers and display visual trading signals with optional alerts. It combines fast and slow moving averages with an EMA 200 trend filter to help traders identify crossover signals, assess market direction and organize their technical analysis. Th
FREE

Most killzone indicators draw boxes. This one checks whether the boxes work. Asia, London open, New York open and London close drawn automatically A table on your chart measures how often the day's high or low really formed inside each killzone, next to what pure chance would give Free. Check the numbers before you trust any killzone strategy MT4 version (free) | ICT FVG Honest Stats (free) | ICT Liquidity Levels Honest Stats (free) | ICT SMT Divergence Honest Stats (free) | TrueRisk Trade Panel
FREE

SnapBack Three Sigma Reversal marks exhaustion reversals: a candle that closes outside a 3-standard-deviation Bollinger Band (period 20) while RSI(2) is at an extreme, below 10 for a buy and above 90 for a sell. The arrow appears on the next candle, at its open, once the signal candle has closed. It does not repaint. The indicator only reads closed candles, and every arrow and every result mark is written once and never moved or removed. Statistics panel The panel tests the signals on the chart

TradeGuard Daily Levels Daily Price Levels and Trading Session References for MetaTrader 5 TradeGuard Daily Levels is a free technical indicator designed to help traders identify and visualize important price levels directly on MetaTrader 5 charts. The indicator displays reference levels from the previous completed trading day, the current daily open, and key trading session levels to support technical analysis and intraday trading preparation. Main Features Previous Day Levels PDH (Previous Day
FREE

GoldReaper X Indicator
Multi-Engine Gold Trading Signal Indicator for MetaTrader 5 GoldReaper X Indicator is a professional trading signal indicator designed specifically for Gold (XAUUSD), with support for the M15 and M5 timeframes. It combines four independent analytical engines into a unified consensus-based signal system, helping traders identify potential trading opportunities through liquidity analysis, adaptive trend flow, multi-factor confluence, and daily market bias.
Rather than rely
FREE

Tedd gyönyörűvé a MetaTrader 5 táblázataidat – ingyen.
A Chart Wallpapers egy gyönyörű háttérképet helyez el a gyertyáid mögé. A térképed teljesen olvasható, de teljesen másképp néz ki.
11 HÁTTÉR - Nyári naplemente - Téli éjszaka - Autumn Hills - Night City - Galaxy - Északi fények - Synthwave - Mountain Dawn - Sivatagi dűnék - Sakura Spring - Anime Sky
JELLEMZŐK - Válaszd ki a háttéred egy egyszerű listából - Automatikus illeszkedés: a kép mindig kitölti a táblázatot, még akkor is, ha átmér
FREE

TrendVision AI – Smart Trend Channels & Price Forecasting for MetaTrader 5
Discover market structure and explore potential future price direction with TrendVision AI, an advanced technical indicator for MetaTrader 5 that combines automatic trendline analysis with a machine-learning-based price forecasting model.
How Does TrendVision AI Work?
TrendVision AI analyzes historical candlestick data within a configurable lookback window. It automatically draws two trendlines directly on the chart:
FREE

SMT + PSP/PCP MTF compares your chart with correlated instruments and highlights where their behavior diverges What it shows SMT divergence. The indicator draws lines between swing highs or lows where one asset takes liquidity and the correlated asset does not. Bullish and bearish lines have separate colors, styles and widths. PSP / PCP signals. The indicator marks candles where the correlated assets diverge at swing points. You can use text labels, candle coloring (aqua for bullish, orange for
FREE

The Dow Theory structure of the chart — in one look. DowTheoryVisual labels every swing high and low as HH, HL, LH or LL and draws a zigzag colored by the trend: blue for an uptrend, red for a downtrend, gray for a range. The panel keeps showing the trend of the current chart and of two higher timeframes side by side. Features HH / HL / LH / LL labels: each swing high and low is compared with the previous one. Trend-colored zigzag: up blue, down red, range gray. The color changes on the bar wher

Key levels on nine timeframes, and an alert the moment the price breaks out. Prices that were stopped again and again are levels many traders watch. BreakerDetectPro finds the zones where swing highs and swing lows gather and draws one level above and one below the price for each timeframe you select, from M1 to MN1. Higher-timeframe levels are drawn on the chart you are looking at. Features Automatic key levels: one level above and one below the price, from swing highs and lows that gather in t

TraderGuard Multi Signal Radar Automatic Open-Chart Detection | Multi-Symbol & Multi-Timeframe Monitoring | EMA Crossover Signals | Mobile Alerts Your open MT5 charts. Automatically detected. Signals monitored. Alerts delivered. TraderGuard Multi Signal Radar is a multi-symbol and multi-timeframe signal scanner for MetaTrader 5, designed to automatically detect the charts currently open in your MT5 terminal, identify their symbols and timeframes, and monitor EMA crossover conditions without requ

TrendSync VWAP Lite — VWAP + Volume Profile, free TrendSync VWAP Lite shows you, at a glance, the two things that decide most intraday moves: fair value (VWAP) and where volume actually traded (Volume Profile). It is built for XAUUSD (Gold) and works on any symbol and timeframe. Clean, fast, and free.
WHAT IT SHOWS VWAP — Daily, Weekly and Monthly, each on its own anchor, so you see the fair value of the session, the week and the month at the same time. Optional labels mark each line. Volume Pr
FREE

FullInfo MTX Levels is the free indicator version of FullInfo MTX Pro. The full version is available in the MQL5 Market. It puts the levels traders watch, a few pieces of market analysis and the numbers of your account on the M5 chart. It does not send, change or close orders, and it does not touch your positions.
On the chart (M5)
• Previous day, week and month high/low, daily and weekly open, New York midnight open, and the highs/lows of the Asia, London and New York sessions. Labels sit at
FREE

FXB Confluence Engine follows the trend with a range filter and, each time that trend turns on a closed bar, scores how much of the market agrees with the new direction. Momentum and the EMAs, four other timeframes, a higher-timeframe bias, the same filter at two wider settings, volatility, RSI and volume each add points, and a choppy market takes points away. A BUY or SELL prints only when the score reaches your minimum and every filter you have switched on is open. A dashboard on the chart sh
Scopri come acquistare un robot di trading dal MetaTrader Market, il negozio di applicazioni per la piattaforma MetaTrader.
Il sistema di pagamento di MQL5.community supporta le transazioni tramite PayPal, carte bancarie e gli altri sistemi di pagamento più diffusi. Per essere pienamente soddisfatto, ti consigliamo vivamente di testare il robot di trading prima di acquistarlo.

Ti stai perdendo delle opportunità di trading:
- App di trading gratuite
- Oltre 8.000 segnali per il copy trading
- Notizie economiche per esplorare i mercati finanziari
Registrazione
Accedi
Accetti la politica del sito e le condizioni d’uso
Se non hai un account, registrati