Guarda i video tutorial del Market su YouTube
Come acquistare un Robot di Trading o un indicatore
Esegui il tuo EA
hosting virtuale
hosting virtuale
Prova un indicatore/robot di trading prima di acquistarlo
Vuoi guadagnare nel Market?
Come presentare un prodotto per venderlo con successo
Indicatori tecnici a pagamento per MetaTrader 4 - 10

Apollo Price Action System è un indicatore completamente basato sul principio Price Action. L'indicatore fornisce un segnale di acquisto o vendita non appena si formano le condizioni per entrare nel mercato secondo la strategia dell'indicatore. L'indicatore può essere utilizzato come sistema di trading di base o come aggiunta al proprio sistema di trading. L'indicatore può funzionare con qualsiasi intervallo di tempo, ma si consiglia di utilizzare D1. Questo indicatore è molto facile da usare.

Advanced Reversal Hunter Pro (ARH) is a powerful, innovative volatility-based momentum indicator designed to accurately identify key trend reversals. Developed using a special algorithm that provides a clear construction of the average volatility range, without redrawing its values and does not change them. The indicator adapts to any market volatility and dynamically adjusts the width of the band range, depending on current market conditions. Indicator advantages: Advanced Reversal Hunter Pro
SMC OrderBlock Auto MT4 è un indicatore di trading avanzato basato sui concetti Smart Money (SMC), progettato specificamente per la piattaforma MetaTrader 4. Questo indicatore aiuta i trader a identificare con precisione i punti di ingresso e di uscita dei grandi operatori istituzionali, riconoscendo schemi chiave di azione sul prezzo, come i Blocchi Ordine (Order Blocks), i massimi e i minimi (liquidità degli stop: BSL, SSL) su diversi timeframe, aumentando così i tassi di successo e il potenzi

VR Cub è un indicatore per ottenere punti di ingresso di alta qualità. L'indicatore è stato sviluppato per facilitare i calcoli matematici e semplificare la ricerca dei punti di ingresso in una posizione. La strategia di trading per la quale è stato scritto l'indicatore ha dimostrato la sua efficacia per molti anni. La semplicità della strategia di trading è il suo grande vantaggio, che consente anche ai trader alle prime armi di commerciare con successo con essa. VR Cub calcola i punti di apert

The "Easy Ichimoku Wave Meter" indicator is a basic tool to automatically determine Waves according to Ichimoku!
The indicator gives the possibility to simultaneously apply the Wave Theory, Time Theory and Target Price Theory according to the "Little Ichimoku" strategy developed by Sense Hosoda on the MT4 platform. The use of this tool allows not only novice traders to instantly (fully automatic) determine the waves and their rapid interpretation, it also allows to automatically measure the pr

3 Trading Strategies to Exploit Market Structure (Without Overcomplicating It)
Trading isn’t about predicting the future—it’s about spotting patterns, managing risk, and acting when odds favor you. Below are two timeless strategies (and one hybrid) that align with how markets actually move, not how we wish they would. Please ping me up for the strategy i have been using for last 5 years and the strategy that led me to leave my IT job. I am 100% sure that my strategy will blow your mind. [S

TDI Multi Timeframe Scanner:
This Dashboard indicator uses the TDI (Trader's Dynamic Index) Indicator to find best trades. Read detailed How to Use Guide: https://www.mql5.com/en/blogs/post/758252
Extra indicators also available in above post.
Checks for: - SharkFin Pattern Free indicator for SharkFin: https://www.mql5.com/en/market/product/42405/ - TDI Trend: Strong/Weak Trend Up/Down - TDI Signal: Strong/Medium/Weak Signal for Buy/Sell - Consolidation - Overbought/Oversold - Volatility Ban

Smart Volume Box is designed to give MetaTrader users a powerful, analytical tool for uncovering the hidden dynamics in the market. This precision-built tool, complete with user-friendly settings, integrates essential volume insights and advanced features like Volume Profile, VWAP (Volume Weighted Average Price), and Point of Control (POC) levels. Unlike typical indicators, Smart Volume Box doesn’t provide specific trade signals but instead offers a clearer perspective on market trends, making
BUY INDICATOR AND GET A PIVOT POINT EA FOR FREE AS A BONUS + SOME OTHER GIFTS! ITALO PIVOTS INDICATOR is the best pivot point indicator for strong price reversals and continuations of price movements ever created , and why is that? You will have for the first time inside a pivot point indicator the pivots above the monthly, so, you will have the 3-month pivot lines, 6 months, 1 year, 2 years, 3 years, 5 years and 10 years, very strong support and resistances. Not only that but for the fi

AI Pearson Trend!!
My name is Murat Yazici. I am a PhD candidate in Statistics.
I have several papers, writing books, book chapter studies, and several conference presentations and experiments about analytical modeling. About me: https://tinyurl.com/pjejextx The AI Pearson Trend indicator is a novel trend-based indicator including Fuzzy statistical modeling.
You can use it on all currencies and timeframes, not including M1 timeframes.
For best performance, check a trend to see if it is the sam
Binary Trend System is a professional scalping indicator designed for trading binary options and Forex instruments. The indicator is based on Price Action patterns that are able to predict future price movement with a high probability. The alert system (alerts, email and push notifications) will help you to simultaneously monitor multiple trading instruments. Attach the indicator to a chart, and the alert will trigger once a signal emerges. With our alerting system, you will never miss a singl

Day Trader Master è un sistema di trading completo per i day trader. Le systeme se compose de due indicatori. Un indicar est un signal fléché pour acheter et vendre. C'est l'indicateur de fleche que vous obtenez. Je vous fournirai le deuxième indicaur gratuitement. Le deuxième indicaur è un indicaur de tendance spécialement conçu pour être utilisé conjointement avec ces flèches. GLI INDICATORI NON SI RIPETONO E NON RITARDANO! Usare questo sistema è molto semplice. Devi solo seguire i segnali del
Multi-Time-Frame-Multi Currency Signals Dashboard Indicator It is an Advanced multi-utility dashboard which works with full customization of signal settings and graphical interface. It works with Multi Symbols and Multi-Time frames from 1 SINGLE CHART TEMPLATE. It will automatically open the charts where the latest signals had formed- showing the important levels (Entry, Targets, Stop Loss) Many types of sorting methods for the scanner. A robust ENTRY based on TREND OF MULTI-TIME FRAMES ( Com

Documentation for connecting Metatrader 4 with Python with a simple drag and drop EA.
A full end-to-end solution ,fully tested ,fast and efficient!
The Pytrader ecosystem consists of a python script and a MT4 EA. ( MT5 version )
Further for the licensing an indicator is used.
The communication between the python script and the EA is based on sockets.
EA is the Server and the python script the Client .
It is always query(function / python script) and output(data / server).
The EA doe

Blahtech Fisher Transform indicator is an oscillator that displays overbought and oversold locations on the chart. The Fisher Transform algorithm transforms prices with any distribution shape into a normal distribution. The end result is a curve with sharp turning points that may help to identify bullish or bearish trends. Fisher Transform values exceeding 1.66 on the daily chart are considered to be good areas for reversal trades. Links [ Install | Update | Training | All Products ]
F

MACD Intraday Trend PRO è un indicatore sviluppato attraverso un adattamento del MACD originale creato da Gerald Appel negli anni '60.
Attraverso anni di trading, è stato osservato che modificando i parametri del MACD con le proporzioni di Fibonacci otteniamo una migliore presentazione della continuità dei movimenti di tendenza, rendendo possibile rilevare in modo più efficiente l'inizio e la fine di un andamento di prezzo.
Grazie alla sua efficienza nel rilevare l'andamento dei prezzi, è anc

The market price usually falls between the borders of the channel.
If the price is out of range, it is a trading signal or trading opportunity.
Basically, Fit Channel can be used to help determine overbought and oversold conditions in the market. When the market price is close to the upper limit, the market is considered overbought (sell zone). Conversely, when the market price is close to the bottom range, the market is considered oversold (buy zone).
However, the research can be used to he

great tool for any trader for both Forex and binary options suitable for any trader no need to configure anything, everything has been perfected by time and experience The tool combines 5 indicators and 3 proprietary strategies works great during flats and trends It indicates a trend reversal at its very beginning, it works well with the trend Trading Recommendations The signal is formulated on the current candle You should enter the trade at the next Possible recount (rare)
" BUYUK SAVDOGAR " TM has developed this strategy to support all binary options traders. The trading system "GOLD HAND STRATEGY" consists of algorithms created as a result of long-term observations and can analyze the market situation with high accuracy.
The mechanism of the stock market is very changeable and no one strategy works successfully for a long time, for a long time. Therefore, this strategy will be updated periodically, making the necessary changes and adjustments. "GOLD HAND STRAT

This is a simple PriceTMA bands, non repaint! it can be used for a trend following system or sometimes reversals. as a main signal or a filter for others strategies, it depends on the trader main strategy. calculations for this indicator are a combined Algorithm between moving averages "MA" and average true range"ATR". good luck with your trading! i hope it is helpful Cheers

RSI Entry Points is the upgrade of the standard RSI indicator to avoid lagging. Indicator draws the clouds and the arrows to have clear picture where price is and what to wait for. Why standard RSI is lagging? because mostly we do not use it correctly and it is with very weak visual flexibility, less informative. With my current upgrade I tried to Fix both problems same time and I got much better results and more exact entries than standard RSI has. I Made RSI line Dynamic, it gets more flexible
Presenting the SMT Divergence indicator, a versatile tool designed to aid in analyzing market dynamics.
The indicator helps identify divergences between the highs and lows of two correlated major currency pairs during specific market periods ("killzones" abbrev. KZ). These periods are characterized by increased market activity, allowing traders to observe market behavior more closely.
The indicator provides customizable options to adjust time settings and visually display the divergences and
** NOTE: This indicator uses realtime data. Thus DO NOT download Demo version. If you still need demo version, please refer to free version .
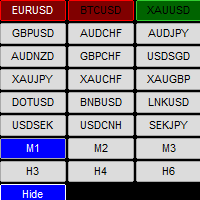
Symbol Chart Changer is an indicator/utility that offers you the option to switch between symbols and timeframes.
You can choose any symbol and timeframe on the same chart with just a few clicks. In addition, this indicator also shows the profit of the symbol through the color of the buttons.
Features: Click buttons on the chart to monitor a
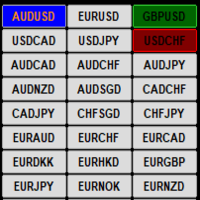
This indicator display current profit/loss status for each pair visually on a single chart. If the current open chart pair is selected and a trade/s are opened for that pair only the Symbol name is highlighted and the button color reflects the current trade/s status if the selected chart pair does not have any open trades then the button color is Blue. The input options are :
1/ Select Pairs automatically from the Market Watch
2/ Manually select your own Pairs
3/ Select all MT4 Timeframes aut

Bar Strength Divergence Indicator for MT4 BarStrength Indicator is an exclusive indicator to trade Forex, Stocks, Indices, Futures, Commodities and Cryptos.
BarStrength Indicator shows the strength of each candle.
The indicator shows in a separate windows candles relatively to 2 price levels representing resistance and support in the market.
Once candle is near resistance it is highly probable that price movement will change direction and will go down in the next candles.
Once candle is near

Sniper Entries AI is a powerful, intelligent indicator designed for traders seeking precise entry points at potential market reversals. Leveraging advanced AI algorithms, this tool analyzes price patterns across multiple timeframes, allowing traders to stay informed of trend shifts, no matter the scale of their trades. Key Features of Sniper Entries AI: High-Precision Reversal Signals : The indicator scans market movements to identify precise reversal points and continuation, giving you a compe
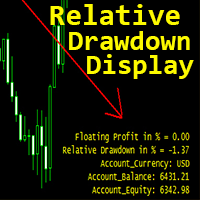
Indicatore Crypto_Forex "Relative Drawdown Display" per MT4, utile strumento di trading.
Questo è un indicatore INDISPENSABILE per i trader che utilizzano sistemi di trading a griglia!!!
- L'indicatore Relative Drawdown Display mostra il DD relativo corrente o il profitto variabile in % sul tuo account. - Gli avvisi per PC e dispositivi mobili sono integrati con livello di attivazione regolabile. - L'indicatore indica anche il saldo e il patrimonio netto dell'account. - È possibile individuar
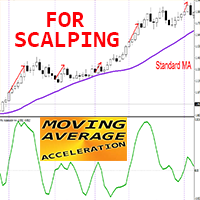
Indicatore Crypto_Forex Moving Average Acceleration per MT4, senza ridisegno.
MA Acceleration - è un indicatore di scalping, progettato come strumento ausiliario per l'indicatore "MA Speed".
- Il calcolo di questo indicatore si basa su equazioni della fisica. Ti mostrerà l'accelerazione della linea della media mobile. - Ci sono molte opportunità per aggiornare anche le strategie standard con MA Acceleration. È possibile utilizzarlo per SMA, EMA e LWMA. - MA Acceleration è una seconda derivata
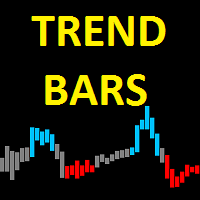
Trend Bars indicator is a trend indicator working with a set of algorithms and a set of indicators. Trend finds trends by using many factors while you are there. This indicator has 4 mode features. Mode 1 represents short-term trends. Mode 2 represents medium to short term trends. Mode 3 represents medium to long term trends. Mode 4 represents long term trends. Easy to use and simple indicator. The user can easily understand the trends. This indicator has 3 trend features. Up trend, down trend a

Description: The indicator shows the TDI indicator in a separate window, and with the RSI component, the indicator finds possible divergences with M or W patterns. KEY LINKS: How to Install - Frequent Questions - All Products Functions: Finds Market Makers patterns. Finds extremes or exhaustion into the market. Looks for a trend continuation. Content: TDI Indicator Divergence and M or W Signals Note 1: This indicator should only be considered as a part of any trading strategy. You shoul

50% Off Today Only! Price Goes Back Up at 11 PM (EST)
uGenesys Volume Indicator: Your Key to Mastering Market Volume Analysis What Traders Are Saying: "A must-have indicator...really a game-changer." – wuzzy66 "Amazing indicator...strongly recommend to beginners." – joinbehar Understanding Market Volume: Volume in the market is a critical indicator of movement and opportunity. The uGenesys Volume Indicator is specially crafted to pinpoint when the market has the most volume, allowing you to tr
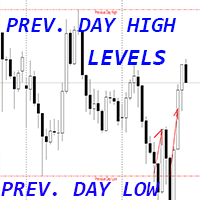
Indicatore Crypto_Forex "Previous Day High Low levels" per MT4.
- L'indicatore "Previous Day High Low levels" è un indicatore ausiliario molto utile. - I livelli High e Low di ieri sono così importanti perché il prezzo rimbalza molto spesso da essi. - Questi livelli possono essere considerati come supporto e resistenza affidabili: il prezzo li rispetta molto. - È un indicatore utile per i trader intraday che utilizzano metodi di trading di inversione e scalping. - Ottimo anche da combinare con
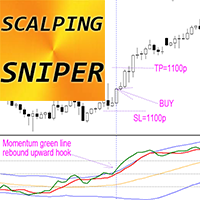
Indicatore Crypto_Forex SCALPING SNIPER per MT4, sistema di trading senza ridisegno. Scalping Sniper: è un sistema avanzato (indicatore) che mostra un preciso momentum dei prezzi!
- Aggiorna i tuoi metodi di trading con l'indicatore professionale Scalping Sniper per MT4. - Questo sistema fornisce segnali di sniping molto accurati ma rari, con una percentuale di vincita fino al 90%. - Il sistema suppone di utilizzare molte coppie per cercare segnali per compensare il basso numero di segnali per

Indicatore Crypto_Forex "Morning Star pattern" per MT4.
- L'indicatore "Morning Star pattern" è un indicatore molto potente per il trading Price Action: nessuna rielaborazione, nessun ritardo. - L'indicatore rileva i pattern rialzisti Morning Star sul grafico: segnale freccia blu sul grafico (vedi immagini). - Con avvisi su PC, dispositivi mobili ed e-mail. - È disponibile anche il suo fratello, l'indicatore ribassista "Evening Star pattern" (segui il link qui sotto). - L'indicatore "Morning S
The indicator highlights the most relevant price levels based on the volume profile, which represents the distribution of trading activity over a specific period. These levels indicate regions with a higher probability of renewed market interest, where institutional traders or other major market participants may react strongly. By identifying these zones, traders can anticipate potential reversals, breakouts, or consolidations, improving their decision-making process. This tool is especially us

Display your Local Time on your charts
Display your local time instead of (or along with) MT4 server time.
Display crosshair which highlights current candle time.
Automatically adjusts based on chart zoom (zooming in or out).
Displays on every timeframe (M1 – Month), and auto-adjusts as chart timeframe is changed.
Handles special ½ hour time zones , such as India.
Renders fast (no lag) as you scroll charts.
Customize the font family, font size, background color, and crosshair col

Trend Oscillator - è un indicatore Crypto_Forex personalizzato avanzato, uno strumento di trading efficiente!
- Viene utilizzato un nuovo metodo di calcolo avanzato - 20 opzioni per il parametro "Prezzo per calcolo". - L'oscillatore più fluido mai sviluppato. - Colore verde per i trend al rialzo, colore rosso per i trend al ribasso. - Valori di ipervenduto: inferiori a 5, valori di ipercomprato: superiori a 95. - Ci sono molte opportunità per aggiornare anche le strategie standard con questo i
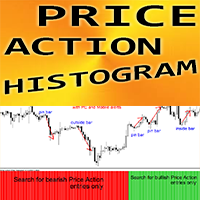
Indicatore Crypto_Forex "Istogramma filtro Price Action": è un efficiente strumento di trading ausiliario per il trading Price Action! Nessuna rielaborazione.
- Questo indicatore suggerisce al trader la direzione delle entrate. Quindi il trader deve solo cercare segnali Price Action in quella direzione. - L'istogramma filtro Price Action dovrebbe essere combinato con modelli Price Action e livelli di supporto/resistenza. - Istogramma di colore verde: cerca voci di acquisto. - Istogramma di col

Target Geometry è un indicatore che utilizza la natura geometrica dei mercati per fornire alti livelli di probabilità statistica (Fibonacci). Questo indicatore crea una mappa molto utile sul grafico che ottimizza i punti di ingresso e definisce in modo ottimale la gestione del denaro. L'indicatore può essere utilizzato sia in modalità statica quindi sullo storico che in modalità dinamica sul periodo attuale. Funzionante su qualsiasi strumento finanziario. L'uso in modalità multi timeframe su più

R. Cos'è l'A2SR ? * È un indicatore tecnico leader (nessuna riverniciatura, nessun ritardo).
-- Guida : -- su https://www.mql5.com/en/blogs/post/734748/page4#comment_16532516 -- e https://www.mql5.com/en/users/yohana/blog
A2SR ha una tecnica speciale per determinare i livelli di supporto (domanda) e resistenza (offerta). A differenza del modo ordinario che abbiamo visto in rete, A2SR ha un concetto originale nel determinare i livelli effettivi di SR. La tecnica originale non è stata presa d
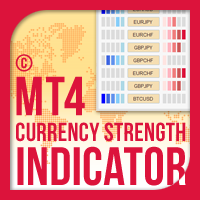
Currency Strength Indicator per MT4 è una soluzione innovativa per qualsiasi trader principiante o esperto! Porta il concetto di forza della valuta a un livello completamente nuovo, poiché lo combina con l'azione dei prezzi e può essere applicato su qualsiasi simbolo/coppia, a parte le solite 28 combinazioni delle 8 principali valute. Ciò significa che puoi scambiare la forza o la debolezza di qualsiasi coppia, comprese tutte le valute, principali, minori ed esotiche, materie prime e criptovalu

The Quality trend indicator expresses the ratio of the strength of a trend or the speed of its growth (fall) to the degree of its noisiness or a certain norm of amplitudes of chaotic fluctuations of a growing (falling) price. The position of the indicator line above zero shows an increasing trend, below zero - a falling trend, the fluctuation of the indicator line near zero shows a flat. If the indicator line begins to fluctuate rapidly around zero and approach it, then this indica

A trend indicator that determines short-term price movements. Arrows indicate an increase in price movements in the specified directions.
Arrows are not redrawn formed on the current candle, shown on the previous candle for convenience.
It has one setting - the formation intensity:
If the parameter is smaller, most of the signals are formed in a wide trend. If the parameter is larger, signals are formed in a narrower trend.
Input parameters
Formation Intensity - Arrow Formation Intensity
THE SCALPER SIGNALS BUY AND SELL ENTRIES / REENTRIES , BASED ON THE PRICE ACTION OF BARS
IT HAS MULTIPLE MODES AS SELECTED , Which will provide different price action signals . The Signals are further filtered using Higher Time Frame Trend Analysis. For Example - (1) The Signals Of reversal points entries of the Higher Time frame can are plotted over any lower time frame , Giving robust signals (2) The Signal Of Lower time Frame - plotted only when the higher time frame is also in tha

Note : The slow loading of the indicator issue has been addressed . This new version loads fast and does not slow the platform.
Version 1.3 : We have updated the indicator to include an historical bar scanning option . So instead of scanning all bars in the history (which can make the indicator slow sometimes ) , you can select the maximum number of bars it can scan which can increase the performance and make the indicator faster.
This indicator scans the 1-3 Trendline pattern . The indicato

Abiroid Profit Percent Series 1: Arrows Indicator Stochastic Ichimoku with ATR
Get the Scanner for free. For getting Profit Percentages for Multiple Timeframes and Multiple Pairs. And read detailed description about this indicator and all the settings here. And get extra Indicators, Templates and settings for download: https://abiroid.com/product/profit-percent-stoch-ichimoku-with-atr
Watch the tutorial video here: https://youtu.be/C45-9kWPE2Q
About The Strategy:
This strategy has 3 main par
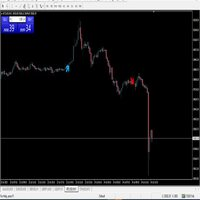
Hello Dear Trader, Today Im Telling You About The "Golden Scalp System V1 " Metatrader4 Golden Scalp System
Scalper with EMA This is a Scalper strategy based on ( Exponential moving average) EMA . Time frame: H1 Pair: EUR/USD, GBP/USD,AUD/USD XAU/USD
Platform Mt4 Indicators for Scalper with Ema: 300 EMA (Exponential Moving Average) ; 500 EMA (Expontial Moving Average); Stochastic (5,3,3) Long Entry
1) 300 EMA > 500 EMA .
2) Find significant levels of support.
3) Wait for the c

L'indicatore costruisce un semaforo a tre periodi e un pattern di inversione 123 dall'estremo. Il segnale arriva all'apertura della seconda candela. Questo pattern può essere negoziato in diversi modi (test point 3, breakout e altri). L'uscita dal canale o il breakout della trendline è il principale fattore scatenante per trovare un punto di ingresso. Le icone sono colorate in base ai livelli di Fibonacci. Le icone gialle indicano il test di un livello al quale il segnale è amplificato. Utilizz
Modello di scansione è uno strumento all'avanguardia progettato per identificare sia la rotazione del trend ribassista che la rotazione del trend rialzista con una precisione senza precedenti,
consentendoti di prendere decisioni di trading informate e di rimanere un passo avanti rispetto al mercato. Versione MT5: WH Sweep Pattern MT5 Caratteristiche del modello di scansione:
Rileva e disegna automaticamente la rotazione del trend ribassista e rialzista sul tuo grafico, utilizzando diver

FIRST 10 COPIES AT 30 USD, NEXT PRICE WOULD BE 65 USD
HAWA MOMENTUM & TREND PRO (MT4) Advanced trading indicator with proper pre-defined entry and exit levels with almost 80% win rate. Its smart and advanced algorithm detects trend and trend strength using momentum for maximum profits and send signals after filtering out market noise. SETTINGS: Please make sure all inputs are NOT "false" in indicator properties otherwise it will not display identified trades. Directory Location: Download fil
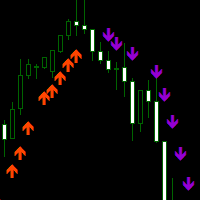
Point Directions - Un indicatore che mostra i livelli dei punti di supporto e resistenza quando il prezzo si muove. Le frecce mostrano i rimbalzi del prezzo nelle direzioni indicate.
Le frecce non vengono ridisegnate, si formano sulla candela corrente. Funziona su tutti i tempi e strumenti di trading. Esistono diversi tipi di avvisi.
Dispone di impostazioni avanzate per personalizzare i segnali per qualsiasi grafico. Può essere configurato per fare trading con il trend e le correzioni.
Per dise

Features:
Sharkfin Alerts Multi-timeframe Multi-currency SM TDI: To show TDI lines with sharkfin levels Zigzag MTF: To see Higher Timeframe trend Detailed blog post and extras: https://www.mql5.com/en/blogs/post/759138
Arrows works on a single timeframe and single currency. But it’s visually helps see that sharkfins. You can also get the simple arrows from mql5 site product: https://www.mql5.com/en/market/product/42405
About Scanner: It is an easy to use simplified scanner. It will show when

Questo indicatore multi time frame e multi simbolo identifica formazioni alto/basso doppie o triple o un successivo breakout della scollatura (confermato alto/basso). Offre filtri RSI, pin bar, engulfing, tweezer, stelle del mattino/sera, nonché MACD, Awesome (AO) o filtri divergenza RSI che consentono di filtrare solo le configurazioni più forti. L'indicatore può essere utilizzato anche in modalità grafico singolo. Si prega di leggere di più su questa opzione nel prodotto blog . Combi
Scalping monster - ready trading system in the form of an indicator. Scalping monster is designed for the Metatrader4 platform. When placed on a forex chart, the indicator automatically analyzes the market using an adaptation algorithm and displays the signals to the trader in the form of red and blue dots. The indicator also shows in the upper right corner information about potential profit / loss.
Our other products at https://www.mql5.com/en/users/master-mql4/seller
How to trade using S
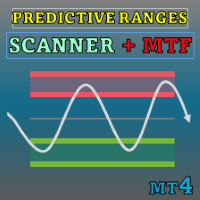
Special offer : ALL TOOLS , just $35 each! New tools will be $30 for the first week or the first 3 purchases ! Trading Tools Channel on MQL5 : Join my MQL5 channel to update the latest news from me Nell’attuale panorama di trading finanziario caratterizzato da elevata volatilità, identificare con precisione i livelli di supporto e resistenza è fondamentale affinché i trader possano prendere decisioni informate. Predictive Ranges Scanner Multi-TF è uno strumento avanzato progettato
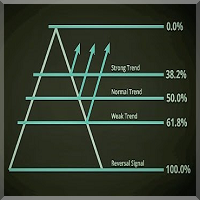
introduction L'indicateur Fibonacci Level Professional est un excellent outil pour le trading quotidien en complément d'autres indicateurs pour une meilleure confirmation des configurations de trading et où le marché a tendance à évoluer. Cet indicateur est facile à configurer et fonctionne sur toutes les paires de devises et toutes les périodes, M15-W1 est recommandé.
Le but de cet indicateur est d'afficher les niveaux de Fibonacci sur le graphique, les lignes quotidiennes, supérieures et inf
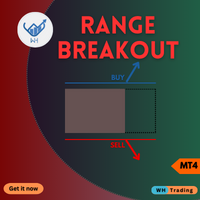
Sblocca una nuova dimensione del trading con il nostro indicatore MQL4 all'avanguardia, Range BreakOut MT4
Questo potente strumento è progettato per identificare e sfruttare i movimenti dei prezzi quando escono dagli intervalli stabiliti,
fornendoti la precisione e la sicurezza necessarie per prosperare nel dinamico mondo dei mercati finanziari.
Versione MT5 : WH Range BreakOut MT5
Caratteristiche:
Rilevamento accurato della portata. Segnali di breakout in tempo reale. Parametri person

L' indicatore ICT Asian Range è un potente strumento progettato per aiutare i trader a identificare le principali strutture di mercato e le zone di liquidità in base alla strategia di trading ICT Asian Range. Segna i livelli di prezzo più alti e più bassi della sessione asiatica (dalle 19:00 a mezzanotte, ora di New York) e fornisce informazioni critiche sui movimenti di mercato per le sessioni di trading successive. Questo indicatore migliora l'accuratezza delle negoziazioni evidenziando sw
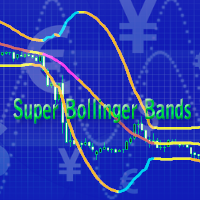
This is a forward-looking indicator for trading on all instruments. An advanced version of Bollinger Bands indicator created by outstanding analyst John Bollinger. One of the main differences of Super Bollinger Bands indicator from its predecessor consists in displaying upper and lower bands behavior on the middle line with some specific colors. Thus, the indicator gives a trader some visual information about trend development at the moment, and not in the past, as majority of other indicators d

The Correct Entry indicator displays specific points of potential market entries on the chart. It is based on the hypothesis of the non-linearity of price movements, according to which the price moves in waves. The indicator displays the specified points based on the price movement of certain models, and technical data.
Indicator Input Parameters: Сorrectness – The parameter characterizes the degree of accuracy of the entry signals. Can vary from 0 to 100. The default is 100. Accuracy of sig
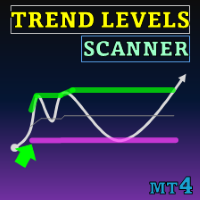
Special offer : ALL TOOLS , just $35 each! New tools will be $30 for the first week or the first 3 purchases ! Trading Tools Channel on MQL5 : Join my MQL5 channel to update the latest news from me L'indicatore Trend Levels è meticolosamente progettato per individuare livelli di trend critici — Alto, Medio e Basso — durante i movimenti di mercato. Con calcoli in tempo reale basati sui valori più alti, più bassi e medi su un periodo di lookback personalizzabile, questo strumento for
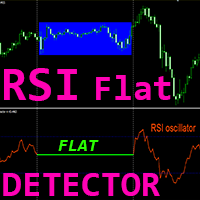
Indicatore Crypto_Forex "RSI FLAT Detector" - è un efficace strumento ausiliario per il trading! Nessun ritocco. Ti offro di aggiornare i tuoi metodi di trading con questo fantastico indicatore per MT4.
- L'indicatore mostra le aree piatte di prezzo sul grafico. Dispone del parametro "Sensibilità piatta", che è responsabile del rilevamento delle zone piatte. - "RSI FLAT Detector" può essere utilizzato per confermare l'ingresso di Price Action o in combinazione con altri indicatori. - Puoi usar
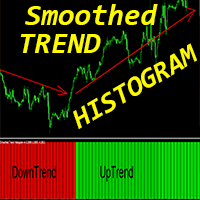
Indicatore Crypto_Forex "Smoothed Trend Histogram" per MT4, senza ridisegno.
- L'indicatore Smoothed Trend Histogram è molto più efficiente di qualsiasi incrocio di medie mobili standard. - È particolarmente focalizzato sul rilevamento di grandi tendenze. - L'indicatore ha 2 colori: rosso per il downtrend ribassista e verde per il uptrend rialzista (i colori possono essere modificati nelle impostazioni). - Con avvisi per dispositivi mobili e PC. - È un'ottima idea combinare questo indicatore c
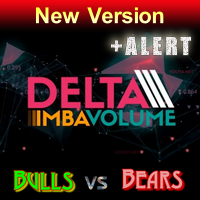
The Sniper Delta Imbalance indicator is designed to analyze delta – the difference in tick volumes between buyers and sellers in the market. It displays the imbalance between market buys and sells, allowing traders to accurately assess the current sentiment of major market participants. This tool provides a unique method of analysis based on the relationship between supply and demand volumes and can be used to identify who controls the price at any given moment. Key Features: Delta Imbalance —
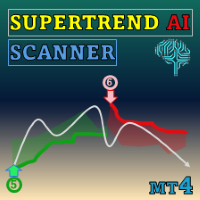
Special offer : ALL TOOLS , just $35 each! New tools will be $30 for the first week or the first 3 purchases ! Trading Tools Channel on MQL5 : Join my MQL5 channel to update the latest news from me Scopri la potenza dell'IA con il SuperTrend AI Clustering con Scanner , uno strumento di trading rivoluzionario per MetaTrader4 (MT4). Questo indicatore ridefinisce l'analisi del mercato combinando il clustering K-means con l'ampio indicatore SuperTrend, dando ai trader un vantaggio nell

It predicts the most likely short-term price movement based on advanced mathematical calculations.
Features Estimation of immediate price movement; Calculation of the real market trend; Calculation of the most important support and resistance levels; Algorithms optimized for making complex mathematical calculations with a minimal drain of system resources; Self-adjusting for better performance, so it’s able to work properly at any symbol (no matter how exotic it is) and any timeframe; Compatibl

Strength of 8 popular currencies (EUR, GBP, USD, CAD, AUD, NZD, CHF, JPY) is calculated from 28 pairs of Forex market following a Moving Average with custom period and method. You can use it by adding 2 indicators to the chart of Forex pair based on the pair currencies and use it as a confirmation on your strategies.
Currencies: EUR, GBP, USD, CAD, AUD, NZD, CHF, JPY
Inputs: Currency: 1 of the 8 currencies MA Period: Period of Moving Average MA Method: Method of Moving Average (SMA, EMA, SMMA

Introduction Excessive Momentum Indicator is the momentum indicator to measure the excessive momentum directly from raw price series. Hence, this is an extended price action and pattern trading. Excessive Momentum Indicator was originally developed by Young Ho Seo. This indicator demonstrates the concept of Equilibrium Fractal Wave and Practical Application at the same time. Excessive Momentum detects the market anomaly. Excessive momentum will give us a lot of clue about potential reversal and
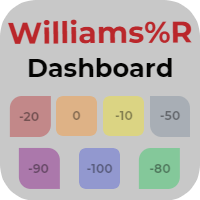
The Williams Dashboard is an information panel which allows you to have a global market vision through a Williams Percent Range. Williams Dashboard analyzes and tracks all the assets you want to invest in. Take advantage of this useful dashboard where you can open in a few seconds the chart and quickly invest in it.
Main Features of Williams Dashboard Graphic panel that allows you to know the situation of many assets. 7 Different Williams Percent Range situations to discover when an asset is ov

Supply Demand Zone Pro Indicator works with all products and timeframes. It is using a new calculation method, and now you can select the desired zone on any timeframe! Strongest Zones are already enabled by default This is a great advantage in trading.This indicator has a built in backtester enabled by default, just move the chart.
Supply and Demand ?
Supply is a price zone where sellers outnumbered buyers and drove the price lower. Demand is a price zone where buyers outnumbers sellers and dr
Il MetaTrader Market offre un luogo pratico e sicuro dove acquistare applicazioni per la piattaforma MetaTrader. Scarica versioni demo gratuite di Expert Advisors e indicatori direttamente dal tuo terminale e testali nello Strategy Tester.
Prova le applicazioni in diverse modalità per monitorare le prestazioni ed effettuare pagamenti per i prodotti desiderati, utilizzando il sistema di pagamento MQL5.community.
Ti stai perdendo delle opportunità di trading:
- App di trading gratuite
- Oltre 8.000 segnali per il copy trading
- Notizie economiche per esplorare i mercati finanziari
Registrazione
Accedi
Se non hai un account, registrati
Consenti l'uso dei cookie per accedere al sito MQL5.com.
Abilita le impostazioni necessarie nel browser, altrimenti non sarà possibile accedere.