Clever TDI Pro
- Indicatori
-
Carlos Forero
 Sono uno sviluppatore e trader professionista con oltre un decennio di esperienza nei mercati dei capitali e nella creazione di portafogli algoritmici. Sono specializzato in sistemi automatizzati avanzati e strumenti di analisi tecnica per MetaTrader.
⚙️ Filosofia di Sviluppo - Versione: 2.93
- Aggiornato: 13 marzo 2025
- Attivazioni: 5
Description:
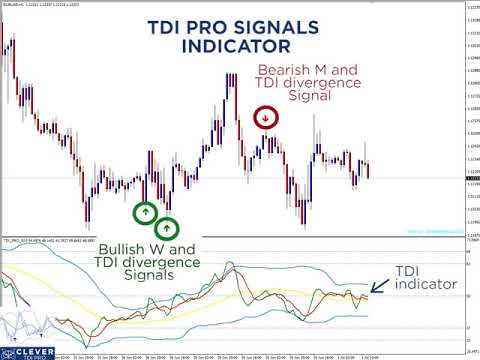
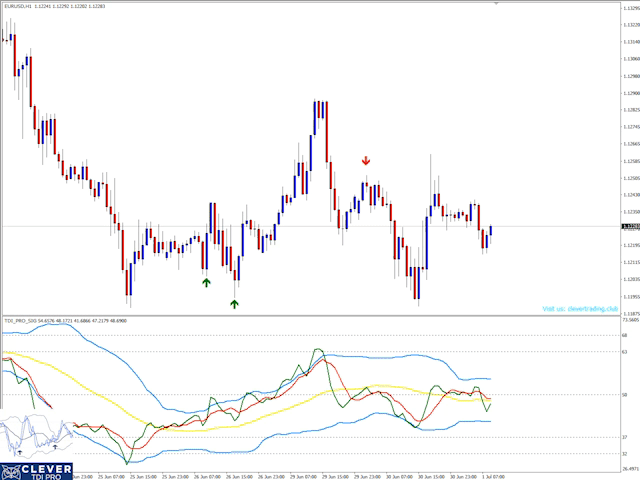
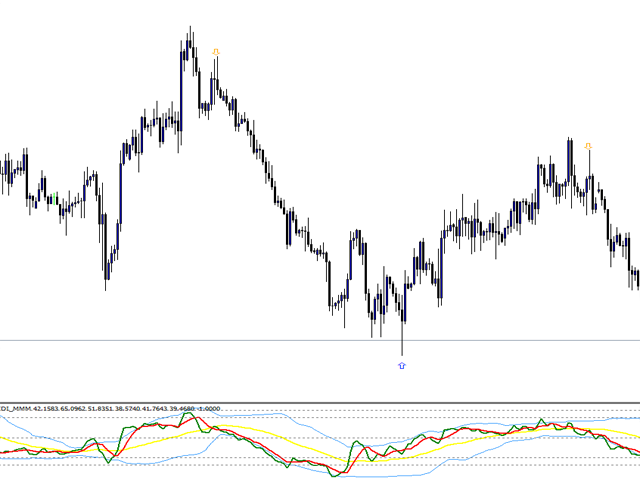
The indicator shows the TDI indicator in a separate window, and with the RSI component, the indicator finds possible divergences with M or W patterns.
KEY LINKS: How to Install - Frequent Questions - All Products
Functions:
- Finds Market Makers patterns.
- Finds extremes or exhaustion into the market.
- Looks for a trend continuation.
Content:
- TDI Indicator
- Divergence and M or W Signals
About Author:
Carlos Forero, Member of Clever Trading Club, private organization with the purpose of design clever solutions to generate constant profits with adapted risk.


L'utente non ha lasciato alcun commento sulla valutazione.