Conheça o Mercado MQL5 no YouTube, assista aos vídeos tutoriais
Como comprar um robô de negociação ou indicador?
Execute seu EA na
hospedagem virtual
hospedagem virtual
Teste indicadores/robôs de negociação antes de comprá-los
Quer ganhar dinheiro no Mercado?
Como apresentar um produto para o consumidor final?
Pagamento de Indicadores Técnicos para MetaTrader 4 - 10
O indicador MTFMA (Médias Móveis Multitemporais) utiliza várias médias móveis (MAs) em diferentes prazos para fornecer sinais de compra e venda (que não repintam) em uma janela separada do gráfico principal. É versátil e fácil de interpretar, adequado tanto para scalping em prazos menores quanto para negociação de longo prazo em prazos maiores. Por que é Multiframe? O termo multiframe refere-se à capacidade do indicador de utilizar e combinar dados de múltiplos prazos. O MTFMA calcula e exibe si
O Top Bottom Tracker é um indicador baseado em algoritmos sofisticados que analisa a tendência do mercado e pode detetar os altos e baixos da tendência / Versão MT5 .
O preço aumentará progressivamente até atingir 500$. Próximo preço --> $99
Características Sem repintura
Este indicador não altera os seus valores quando chegam novos dados
Pares de negociação
Todos os pares de forex
Timeframe
Todos os timeframes
Parâmetros ==== Configuração do indicador ====
Parâmetro de con

Dark Sprint is an Indicator for intraday trading. This Indicator is based on Trend Following strategy, also adopting the use of the atr to determine the right volatility. We can enter in good price with this Indicator, in order to follow the strong impulse on the current instrument.
Key benefits
Easily visible sprint lines Intuitive directional arrows Automated adjustment for each timeframe and instrument Easy to use even for beginners Never repaints, never backpaints, Not Lag 100% compati

MT5 Version Available Here: https://www.mql5.com/en/market/product/50048
Telegram Channel & Group : https://t.me/bluedigitsfx
V.I.P Group Access: Send Payment Proof to our Inbox
Recommended Broker: https://eb4.app/BDFXOsprey *All In One System Indicator, Breakthrough solution for any Newbie or Expert Trader! The BlueDigitsFx Easy 123 System makes it easy to identify important areas of market structure. It alerts you to changes in market structure which typically occur when a reve
# 33% off - limited time only #
ChartSync Pro MT4 is an indicator, designed for the MetaTrader 5 trading terminals. It enables the trader to perform better multi-timeframe technical analysis, by synchronizing symbols and objects into virtually unlimited charts. Built by traders for traders! Telegram Premium Support - Dd you purchase the Chart Sync indicator and need a bit of help? Send us a screenshot with your purchase and your Telegram ID so we can add you to our premium support Telegram

Keltner Channel Indicator Keltner Channel is an oscillator like Bollinger Bands.
Keltner Channel is a very good tool to time entries for your strategy.
Keltner Channel displays a channel where price is supposed to stay unless we are in overbought or oversold situations.
Various strategies use Keltner Channel indicator successfully to spot overbought / oversold situations and look for reversals.
Keltner Channel indicator uses ATR to determine overbought and oversold situations. Inputs of the

No idea why demo is not working. you can check the GIF to see how it works.
Features With this scanner you can detect Candles which are below/above yesterday high/low lines. A pair's rectangle turns RED in dashboard if it is above the yesterday high, and rectangle turns GREEN in dashboard if it is below the yesterday low. It gives alerts in every 15m candle close. Contains a Dashboard which will help you to see all market pair's. It is possible to disable this sorting through to make it easie

Read detailed description and Get Free Demo and extra indicators: https://www.mql5.com/en/blogs/post/758610
Features:
Halftrend Arrow Scan: Scan Max Past Bars for Halftrend arrows. Show how many bars back the arrow occurred in a bracket Past Bars Back Alerts: Num of bars back for which scanner will send alerts Halftrend HTF Align: Scan Higher timeframes for Trend Direction of Halftrend Indicator and if trends align show a slanting Green/Red Arrow for Up/Down trend Semafor 3 Check: Few bars
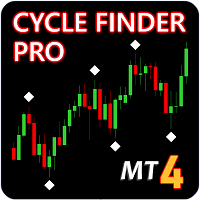
Update - Version 4.0 now includes trend change signal. Indicator will tell you the current trend on all charts. Cycle Finder Pro is a chart reading indicator and is designed for trend and pattern traders . Chart reading is time consuming and complex and requires knowledge of price action , cyclicity, and time frame correlation . Cycle Finder Pro reads all this in one simple indicator so you can spot trend and chart patterns much easier and much faster. To know if a trend exists on a chart you

Multi Strategies Combined Signal All in One Multi Strategies Single Combined Select from up to 6 Strategies solo or Combine different strategies for signal generation (Combining more than 2 strategies may LIMIT a lot the number of signals)! ALL inputs and Strategies selection From Chart !!! Also Inputs editing from Chart !!! Push your strategy bottom (one strategy) OR Combine signal from as may strategies (up to 6) : Selected and enabled strategies will be in GREEN !!! 1- BUY SELL areas 2-

"The trend is your friend" is one of the best known sayings in investing, because capturing large trendy price movements can be extremely profitable. However, trading with the trend is often easier said than done, because many indicators are based on price reversals not trends. These aren't very effective at identifying trendy periods, or predicting whether trends will continue. We developed the Trendiness Index to help address this problem by indicating the strength and direction of price trend

Dark Breakout is an Indicator for intraday trading. This Indicator is based on Trend Following strategy, providing an entry signal on the breakout. The signal is provided by the arrow, which confirms the breaking of the level. We can enter in good price with this Indicator, in order to follow the main trend on the current instrument. It is advised to use low spread ECN brokers. This Indicator does Not repaint and N ot lag . Recommended timeframes are M5, M15 and H1. Recommended working pairs

Modificação multimoeda e multitimeframe do indicador Fractals. Exibe os dois últimos fractais — sua sequência (e qual está quebrada) ou a distância entre eles. Você pode especificar quaisquer moedas e prazos desejados nos parâmetros. Além disso, o painel pode enviar notificações sobre o rompimento de um fractal. Ao clicar em uma célula com ponto final, este símbolo e ponto final serão abertos. Este é o scanner MTF.
A chave para ocultar o painel do gráfico é “D” por padrão.
Parâmetros Cal
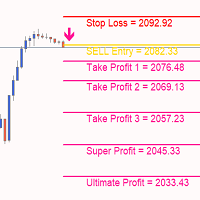
Gold Targets são o melhor indicador de tendência. O algoritmo exclusivo do indicador analisa o movimento do preço do ativo, levando em consideração fatores de análise técnica e matemática, determina os pontos de entrada mais rentáveis, emite um sinal em forma de seta e o nível de preço (ENTRADA DE COMPRA / Entrada de VENDA) para abra um pedido. O indicador também exibe imediatamente o nível de preço para Stop Loss e cinco níveis de preços para Take Profit.
ATENÇÃO: O indicador é muito fácil d
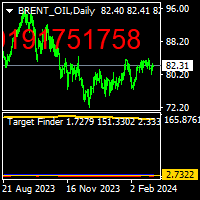
THISE INDICATOR NOT WORK ON FREE DEMO. there is a protocol to work it. target finder indicator is a forecast the find probably targets.up and down. to use thise indicator, there is a protocol,i explain below. first load indicator you will see blue and red lines. on the left side look to the higher value of line ,and draw horizantal line on top it. and on the right side see the LEVEL NUMBER.
Finding UP TARGET h=put that level number m=1 b=1 pres ok. you will see on the screen ,on top right ,r
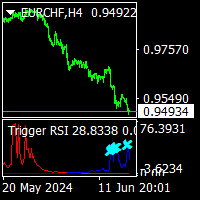
Trigger RSI is a no repaint trend indicator. it can use all pairs and all time frames. easy for use beginner and experienced tarders. it put aqua and gold point on histograms. if aqua point on the blue histogram that is buy signal. if gold point on the red histogram that is sell signal. cnt value has been set to default 1000. you can increase it to see back signals.if there is enough bars on charts. minimum value cnt is 500.
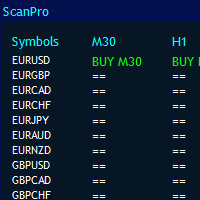
O Universal Panel pro foi projetado para todos os indicadores e prazos, incluindo arquivos ex4.
Ele pode fazer a varredura de pares ilimitados com base na potência do seu computador e em até 10 períodos de tempo. O tamanho do painel será organizado automaticamente.
você pode chamar qualquer indicador por buffers.
Funciona com todos os indicadores padrão e personalizados. Você pode simplesmente usá-lo para heikan ashi, rsi, parabólico, renko, fractais, resistência de suporte, demanda d

MT5 Version SMT Divergences MT4
SMT Divergences is one of the most innovative indicators in the market. It offers the possibility of analyzing price divergences between 2 pairs. These divergences highlight and help to foresee what banks and institutions are planning to do. SMT divergences also provides you with a kill zones indicator and the possibility of filtering divergences occurring during these kill zones. The strategy tester is limited in MT4. Contact the author to get your Demo Version

At the very least, this indicator is able to entertain you. It builds a moving line based on interpolation by a polynomial of 1-4 powers and/or a function consisting of a sum of 1-5 sine curves. Various combinations are possible, for example, a sum of three sine curves about a second order parabola. The resulting line can be extrapolated by any of the specified functions and for various distances both as a single point at each indicator step (unchangeable line), and as a specified (re-painted) f

O medidor de força monetária fornece um guia visual rápido para saber quais moedas estão fortes e quais são fracas. O medidor mede a força de todos os pares cruzados do forex e aplica cálculos sobre eles para determinar a força geral de cada moeda individual. Calculamos com base na força da moeda com base na tendência de 28 pares.
Acessando nosso Blog MQL5, você pode baixar a versão gratuita do indicador. Experimente antes de comprar, sem as restrições do Metatrader Tester: Clique aqui

Gold Level MT4
A great helper for trading Gold.
Levels do not repaint and do not change their data We recommend using it with the indicator - Professional Trade Arrow
Levels are built every day, so you will trade every day with the indicator.
Gold Level.
Price markups are shown on the chart, after reaching TP1 or SL1, close half of the position, and the rest is transferred to breakeven.
Any questions? Need help?, I am always happy to help, write me in private messages or in telegram.

KT Higher High Lower Low marks the following swing points with their respective S/R levels: Higher High: The swing high made by the price that is higher than the previous high. Lower High: The swing high made by the price that is lower than the previous high. Lower Low: The swing low made by the price that is lower than the previous low. Higher Low: The swing low made by the price that is higher than the previous low.
Features The intensity of swing high and swing low can be adjusted by cha

50% Off Today Only! Price Goes Back Up at 11 PM (EST)
uGenesys Volume Indicator: Your Key to Mastering Market Volume Analysis What Traders Are Saying: "A must-have indicator...really a game-changer." – wuzzy66 "Amazing indicator...strongly recommend to beginners." – joinbehar Understanding Market Volume: Volume in the market is a critical indicator of movement and opportunity. The uGenesys Volume Indicator is specially crafted to pinpoint when the market has the most volume, allowing you to
Brilliant Reversal Indicator - Your Ultimate Alert-Driven Trading Solution Unlock the potential for unparalleled trading success with the "Brilliant Reversal Indicator." This powerful tool has been meticulously designed to empower traders by identifying critical reversal opportunities with lightning-fast alerts. Key Features : Precise Reversal Detection : The Brilliant Reversal Indicator specializes in pinpointing potential trend reversals, helping you seize opportunities to enter or exit positi
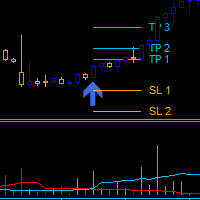
Dark Power is an Indicator for intraday trading. This Indicator is based on Trend Following strategy, also adopting the use of an histogram to determine the right power . We can enter in good price with this Indicator, in order to follow the strong trend on the current instrument. The histogram is calculated based on the size of the bars and two moving averages calculated on the histogram determine the direction of the signal
Key benefits
Easily visible take profit/stop loss lines Int

Turbo Trend technical analysis indicator, which determines the direction and strength of the trend, and also signals a trend change. The indicator shows potential market reversal points. The indicator's intelligent algorithm accurately determines the trend. Uses only one parameter for settings. The indicator is built for simple and effective visual trend detection with an additional smoothing filter. The indicator does not redraw and does not lag. Take profit is 9-10 times larger than stop loss

The Currency Index indicator enables traders to display any index of eight major currencies. It uses a special calculation that considers specific currency pairs and their weights.
The default weights are based on the BIS Triennial Central Bank Survey results. Because of this advantage, the trader can see each currency's true strength and weakness.
Note: If the indicator is used in Strategy Tester (demo version), please keep in mind that all currency pairs' data must be downloaded in Histo

A Swing Failure Pattern ( SFP ) is a trade setup in which big traders hunt stop-losses above a key swing high or below a key swing low for the purpose of generating the liquidity needed to push price in the opposite direction. When price 1) pierces above a key swing high but then 2) closes back below that swing high, we have a potential bearish SFP . Bearish SFPs offer opportunities for short trades. When price 1) dumps below a key swing low but then 2) closes back above that swing low, we have

MT4. Многофункциональный индикатор автоматически определяет и рисует волновые каналы, а также линии поддержки и сопротивления. Показывает тренд младшего периода и границу пробоя старшего. Это не стандартный канал. Работает совершенно по новому принципу. В алгоритм построения канала заложен принцип закона золотого сечения. Работает на графиках любого инструмента. Для лучшего восприятия каналы окрашены в разные цвета. канал с синим фоном - основной вверх. канал с красный фоном - основной канал
This LEGIT Indicator Can Accurately Predict the Outcome of One Bar.
Imagine adding more filters to further increase your probability!
Unlike other products, Binary Options PRO can analyze past signals giving you the statistical edge.
How Increase Your Probability
Information revealed here www.mql5.com/en/blogs/post/727038 NOTE: The selection of a Good Broker is important for the overall success in trading Binary Options.
Benefits You Get
Unique algorithm that anticipates price weaknes

Attention!!! Do not try to test an Indicator in Tester, this is very difficult and mathematical calculation will consume all your Memory of computer. Test can be provide only on high performance computers. In Forward trading Indicator run without any problems. Better is rent product and test this calculation. After buy this indicator - BOILERMAKER, we will give for FREE our another indicator - Keltner MTF , contact us - after buy. PLEASE ONLY BUY LIFETIME LICENSE NO RENT!!! We add on MQL ma

" A NEW TRADING METHOD… AN AMAZING TRADING STRATEGY! " Buy ProTrading Arrow Indicator And You Will Get Forex Trend Commander Indicator for FREE!
Like any system, there are losing signals, but you can also lock in profit from market movement. It should not be forgotten that trading is not an event, but a process. This process has no end, i.e. it should never stop completely and completely. Planning the trading strategy takes some time, but it takes much longer to implement it in practice. Pr

Precision Trend Signals is an indicator that shows price reversal points on the chart using arrows. A green arrow indicates when the price will reverse upward, and a red arrow indicates when the price will reverse downward. The indicator can be used on any timeframes and any currency pairs. Trading Strategy with this Indicator: Green Arrow : When a green arrow appears, close any previously opened (if any) sell position and open a buy position. Red Arrow : When a red arrow appears, close any prev
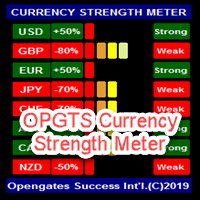
OPGTS Currency Strength Meter is an indicator created to measure and analyze the currency strength and pass the information to the trader through a graphical display of each currency group's strength rates by percentage. Each bar it shows represents the currency's strength or weakness.
USAGE:
It is useful in two ways for trading:
1. Solo Trading
2. Basket Trading (Currency Group Trading)
HOW TO USE IT EFFECTIVELY
Solo trading: It can be used for solo trading by analyzing the
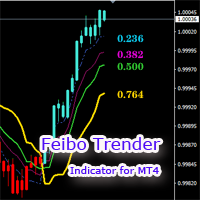
The Feibo Trender is a trend tracking indicator based on the Feibo section calculation. 1.The price is in an upward trend and candles turn blue .The price is in a downward trend and candles turn red . 2.The segmented areas of the channel are identified by lines of different colors that can as support or pressure reference locations . 3.The price broke through the yellow line, which marked the trend reversal. The indicator parameters can be customized and the settings are simple. If you have any

Market Heartbeat in your hand! Introduction The Market Heartbeat indicator with a special enhanced algorithm (volume, money flow, cycle of market and a secret value) is a very repetitive trend finder with a high success rate . Interestingly, this Winner indicator indicates that the trend has changed its direction or the end of a trend retracement or even appears at the range market. The Market Heartbeat can use in scalping trading or trend trading. It finds immediately with alarm, notification a

All in one Indicator. Multiple market analysis tools. Non-Repaint Oscillator signals, Trend lines, Price channel, Fibonacci levels, Support and Resistance, Regression, Pivot levels, Candle Strength and Oversold/Overbought line detector. Includes buttons to hide or show. Advanced algorithms to detect important reversal points and draw trend lines or shapes automatically in appropriate areas. A simple and professional chart display, user friendly and easier to understand for faster and accurately
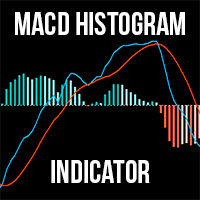
For MT5 The MACD Histogram Indicator is an enhanced version of the traditional MACD indicator, offering superior insights into market trends and momentum shifts. Unlike the default MACD in MT4, this version features a histogram , making it easier for traders to visualize and interpret market conditions. Advantages over the default MACD indicator: Enhanced Visuals: The histogram provides a bar chart representation of the difference between the MACD line and the signal line, making it simpler to i
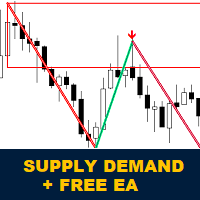
Apresentamos o Indicador de Oferta e Demanda Koala para o MetaTrader 4:
Bem-vindo ao Indicador de Oferta e Demanda Koala. Este indicador é projetado para identificar zonas contínuas de oferta e demanda. Ele pode ajudar o trader a visualizar o mercado como áreas de zona; você pode ver como o preço respeita algumas zonas poderosas. Este indicador também pode mostrar sinais de ação de preço quando eles se formam dentro das zonas. Junte-se ao Canal de Soluções de Negociação Koala na comunidade m

Contact me after payment to send you the User-Manual PDF File. How To Test
You can test the indicator by free version, to get the free version please contact me ( the free version scans charts in W1 and MN1 time-frames ) it's free.
123 Pattern Breakout
Trend is your friend, trade along the trend, but how do we identify trends? Sometimes the simplest methods have the best results. Pattern 123 is based on the breakout important price levels, when the price is trying to break the previou

O indicador identifica quando ocorre uma divergência entre o preço e um oscilador / indicador. Ele identifica divergências de alta e de baixa. Ele tem uma opção de filtro RSI que torna possível filtrar apenas as configurações mais fortes. O indicador também oferece opções de esperar pelo rompimento do canal Donchian ou pelo preço cruzar uma média móvel (veja a captura de tela # 3) para confirmar a divergência antes de sinalizar a oportunidade de negociação. Combinado com suas próprias regras e t

Most accurate Pattern indicator on this market. It search triangles, wedges, channels (next patterns and autoscanner in plan) Works on Forex, Commodities, Indicies, Stocks, Crypto, ... on all timeframes and on every brooker.
If you want this and all my other products for FREE , create account here and then write me and I will send you all my actual and future product for FREE + VIP on my http://discord.io/reitakfx
For more info join to http://discord.io/reitakfx where you can get

To get access to MT5 version please click here . - This is a conversion from TradingView: "Hull Suite" By "Insilico". - This is a light-load processing and non-repaint indicator. - You can message in private chat for further changes you need. note: Color filled areas and colored candles are not supported in MT4 version. Here is the source code of a simple Expert Advisor operating based on signals from Hull Suite . #property strict input string EA_Setting= "" ; input int magic_number= 1234 ; inp

The QQE indicator is a momentum-based indicator used to identify trends and sideways. The Qualitative Quantitative Estimate (QQE) indicator works like a smoothed version of the popular Relative Strength Index (RSI) indicator. QQE extends the RSI by adding two volatility-based trailing stops. This indicator is converted from Trading View QQE MOD by Mihkel00 to be used in MT4 Version.
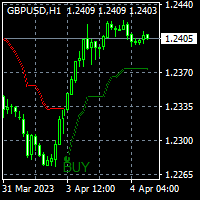
To get access to MT5 version please click here . This is the exact conversion from TradingView: "Supertrend" by " KivancOzbilgic ". This is a light-load processing and non-repaint indicator. Highlighter option isn't available in MT4 version. You can message in private chat for further changes you need. Here is the source code of a simple Expert Advisor operating based on signals from Supertrend . #property strict input string EA_Setting= "" ; input int magic_number= 1234 ; input double fixed_lo
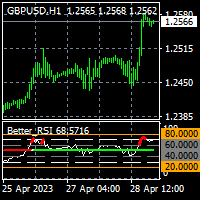
To get access to MT5 version please click here . This is the exact conversion from TradingView: " Better RSI with bullish / bearish market cycle indicator" by TradeCalmly.
This is a light-load processing and non-repaint indicator. All input options are available. Buffers are available for processing in EAs. You can message in private chat for further changes you need.
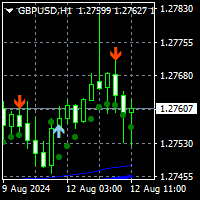
To get access to MT5 version please click here . This is the exact conversion from TradingView: " SSL Hybrid" by Mihkel00.
This is a light-load processing and non-repaint indicator. All input options are available. Buffers are available for processing in EAs. You can message in private chat for further information/changes you need. Thanks for downloading
To get access to MT5 version please click here . This is the exact conversion from TradingView:"HIGH AND LOW Optimized Trend TrackerHL OTT" by "kivancozbilgic" This is a light-load processing indicator. It is a non-repaint indicator. Colored Candle and Highlighting options are not available. Buffers are available for processing in EAs. You can message in private chat for further changes you need. Thanks.

Order Blocks are supply or demand zones in which big traders can find the comfort of placing large buy and sell orders and completing a big, very big transaction. Order blocks are a unique trading strategy that helps traders find a direction in the market. Usually, it allows traders to find out what financial institutions are planning to do in a particular market and better indicate the next price movement.

The indicator returning pivot point based trendlines with highlighted breakouts . Trendline caculated by pivot point and other clue are ATR, Stdev. The indicator also includes integrated alerts for trendlines breakouts and foward message to Telegram channel or group if you want. Settings · Lookback bar: Default 200 is number of bar caculate when init indicator. · Length: Pivot points period · Slope Calculation Method: Determines how this lope is calcula
SL Curruncy impulse https://www.mql5.com/en/market/product/82593 SL Session Strength 28 Pair flow of this intraday Asian London New York Sessions strength.SL Session Strength 28 indicator best for intraday scalper. market powerful move time you can catch best symbol. because you'll know which currencies are best to trade at that moment. Buy strong currencies and sell weak currencies (Diverging currencies). Suggested timeframes to trading : M5 - M15 - M30 - You can however just change session

Professional Prediction Indicator Based on matching the history with selected pattern model and shows the most likely outcome.
Pi indicator includes Pattern line, Scanned_Past line, Matching_Pattern line, Future_Predicted line, adjustable Model Band , and some other controls.
This indicator is designed primarily for professional use and is very useful in the search for the probability of the results relating to the future.
Note : The results depend on model_band and past_bars . They are appro

This is a unique multi-currency trading strategy developed for trading on H1 timeframe, which allows you to determine the global market entry points and obtain the maximum profit for each transaction. The market entry point is calculated using a variety of author equations and algorithms. We recommend using the indicator simultaneously on several trading instruments . A huge advantage of Big Deals System is an information panel in which the user can see the current information on potential entry
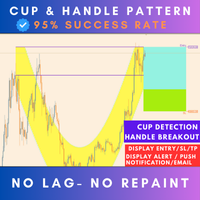
Live Trading Results MT5 Version Contact for Manual Guide Next Price $125 Free Scanner Dashboard (Contact me) Strategy - Breakout / Retest / Aggressive Hello Everyone, We are excited to introduce one of the most reliable and high win rate patterns in trading: the Cup and Handle . This is the first time we are releasing this meticulously crafted indicator, boasting an impressive 95% success rate . It is versatile and effective across all types of pairs, stocks, indices,

The Renko indicator is a technical analysis tool used in the forex market to visualize price movements and trends by eliminating market "noise." Unlike traditional candlestick or bar charts, Renko is built based on price changes of a specified number of points, called the "brick size." When the price moves by this amount of points, a new "brick" is added to the chart. This indicator ignores time and volume, focusing exclusively on price changes. The main features of the Renko indicator include:

Folding rule of 4 trend lines The indicator has been created based on the "Folding rule" trading strategy. It shows four pairs of inclined resistance and support lines. These lines are plotted based on the nearest High and Low of the ZigZag technical indicator with four given input parameters. The indicator draws dots above and below the price extremums that have been used for plotting the trend lines. The indicator of trend lines facilitates the plotting of trend lines, channels and technical p

This is diamond! Contact me to send you instruction and add you in group.
Diamond Pattern is based on Read The Market(RTM) concepts. The purpose of this model is to face the big players of the market (financial institutions and banks), As you know in financial markets, big traders try to fool small traders, but RTM prevent traders from getting trapped. This style is formed in terms of price candles and presented according to market supply and demand areas and no price oscillator is used in it

What is the Volume Weighted Average Price (VWAP)? The volume weighted average price (VWAP) is a trading benchmark used by traders that gives the average price an instrument has traded at throughout the day, based on both volume and price. It is important because it provides traders with insight into both the trend and value of the instrument.
What is the Difference between VWAP and AVWAP? While VWAP is having as starting point the beggining of the day,week,month etc. in the AVWAP you can pla

Price pivot point indicator. The indicator shows with points on the chart the places where the price can turn in the opposite direction. When the indicator draws a red dot, it means that the price can turn its movement down. When the indicator draws a blue dot, then the price can turn its move up. This indicator can be used for both manual trading and automated trading by integrating it into your robot. To do this, the indicator has data exchange buffers.
Recommended currency pairs: XAUUSD EU
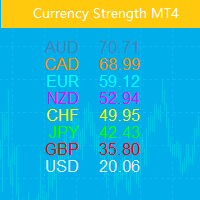
Este indicador mostra a força relativa de 8 moedas principais: USD, EUR, GBP, AUD, NZD, CAD, CHF e JPY. O valor da força é normalizado no intervalo 0-100: Um valor superior a 60 significa forte. Uma leitura abaixo de 40 indica fraqueza. O princípio básico
Dadas oito moedas, USD,EUR,GBP,AUD,NZD,CAD,CHF,JPY, onde cada par de duas pode ser combinado, resultando num total de 28 pares, um algoritmo reverso é usado para extrair a força das oito moedas. desses 28 pares EURUSD,GBPUSD,AUDUSD,NZDUSD, US

Definition : VPO is a Volume Price Opportunity. Instead of using bars or candles with an Open, High, Low, and Close price, each "bar" in a Market Profile is represented by horizontal bars against the price It is called Market Profile terminology.
In other words volume-price-opportunity (VPO) profiles are histograms of how many volumes were traded at each price within the span of the profile.
By using a VPO chart, you are able to analyze the amount of trading activity, based on volume, for eac
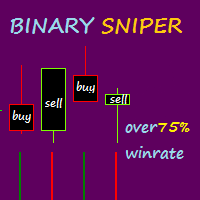
Binary Sniper é um indicador mt4 que fornece sinais de compra e venda para negociação de opções binárias. Este indicador tem uma abordagem diferente, para a negociação de opções binárias, este indicador não repinta ou atrasa o sinal. REGRAS DE ENTRADA: 1. CALL (BUY), quando uma vela vermelha fecha com a cor da barra de atirador binária em verde depois de ficar vermelha. 2. PUT (SELL), Quando uma vela verde fecha com a cor da barra de atirador binária em vermelho depois de ser verde (primeira mu

Introducing High Probability SARs, a classic Forex indicator designed to enhance your trading strategy with its advanced analysis capabilities. High Probability SARs utilizes sophisticated algorithms to identify potential trend reversals with precision. By incorporating the Parabolic SAR indicator, it offers traders valuable insights into market dynamics, allowing for informed decision-making. This innovative tool provides traders with signals based on the Modified parabolic SARs, helping to ide

Universal author's strategy, allows to determine the entry points for Buy and Sell both in the direction of the trend, on the reversals of trends and in the flat market. The indicator is equipped with a unique scanner which each tick analyzes the price chart, calculates optimal levels and patterns for finding entry points by one of the 3 strategies. Each of the strategies combines author formulas and algorithms, for optimal trading we recommend using 3 strategies simultaneously as they are compl

Use of support and resistance in systematic trading is very subjective. Every trader has their own idea and way to plotting the support and resistance levels on the chart. KT Support and Resistance indicator take out this ambiguity out of the situation and automatically draws support and resistance levels following an algorithmic approach using a unique multi-timeframe analysis.
When launched on the chart, It immediately scan the most significant extreme points across all the available timefr

O LordAutoTrendLine é um indicador para MetaTrader que foi desenvolvido com intuito de analisar linhas de tendências de alta e baixa do mercado financeiro. Linhas de tendências são usadas para calcular junto com uma Fibonnaci por exemplo, a alta e baixa de um par de moedas. No exemplo das imagens H4, podemos ver uma linha cruzando 1790 alta e 1784 baixa, um exemplo, se ir abaixo de 1784 significará venda, e muito com certeza de acordo com a linha, pode chegar a 1790 primeiro sem nenhum muito esf
Apollo Binary Options Indicator é um indicador de sinal para negociação de opções binárias. O sinal vem na abertura da vela atual e é válido até o fechamento. O sinal é acompanhado por uma seta, bem como uma mensagem de sinal diretamente em seu gráfico. O tempo de expiração da opção recomendado é de uma vela. Ou seja, se o gráfico for H1, o tempo de expiração será de 1 hora. Se o gráfico for M5, o tempo de expiração da opção será de 5 minutos. Mas, na verdade, você é livre para usar os sinais co

Apollo Global Trends é um indicador de tendência que foi criado para prever o movimento de uma tendência de mercado em qualquer par de moedas, bem como absolutamente quaisquer instrumentos de negociação, incluindo metais, índices, ações, criptomoedas e outros instrumentos de negociação. Este indicador pode ser usado para qualquer período de tempo. O indicador é adequado para negociação de longo e curto prazo. O indicador pode atuar como sistema principal ou como filtro para seus indicadores. Est

NOTE: PRICE WILL RISE VERY SOON. DON'T SKIP THIS OFFER! Dear traders I am glad to introduce the " Market Swing Scanner Board" indicator to you. This indicator was made mainly to be used in combination with the Market Swing Index Indicator. You use the "Market Swing Scanner Board" indicator to scan for trading opportunities on the Market Swing Index Indicator . This tool is designed for serious traders who have decided to make a difference through trading. Be the next person to witness this st

TTM Squeeze Indicator TTM Squeeze is an indicator to time entries based on volatility.
TMM Squeeze might well be one of the best and most overlooked indicator. It was created by famous trader John Carter and is also used by many traders like Nathan Bear.
Why is the TTM Squeeze indicator important? Because in trading correct timing entries might be more important than picking the right direction. This is a concept that is not very well understood in the trading community. Most trader think
Você sabe por que o mercado MetaTrader é o melhor lugar para vender as estratégias de negociação e indicadores técnicos? Não há necessidade de propaganda ou software de proteção, muito menos problemas de pagamentos. Tudo é providenciado no mercado MetaTrader.
Você está perdendo oportunidades de negociação:
- Aplicativos de negociação gratuitos
- 8 000+ sinais para cópia
- Notícias econômicas para análise dos mercados financeiros
Registro
Login
Se você não tem uma conta, por favor registre-se
Para login e uso do site MQL5.com, você deve ativar o uso de cookies.
Ative esta opção no seu navegador, caso contrário você não poderá fazer login.