Guarda i video tutorial del Market su YouTube
Come acquistare un Robot di Trading o un indicatore
Esegui il tuo EA
hosting virtuale
hosting virtuale
Prova un indicatore/robot di trading prima di acquistarlo
Vuoi guadagnare nel Market?
Come presentare un prodotto per venderlo con successo
Nuovi indicatori tecnici per MetaTrader 4 - 33

Features:
Sharkfin Alerts Multi-timeframe Multi-currency SM TDI: To show TDI lines with sharkfin levels Zigzag MTF: To see Higher Timeframe trend Detailed blog post and extras: https://www.mql5.com/en/blogs/post/759138
Arrows works on a single timeframe and single currency. But it’s visually helps see that sharkfins. You can also get the simple arrows from mql5 site product: https://www.mql5.com/en/market/product/42405
About Scanner: It is an easy to use simplified scanner. It will show when
** NOTE: This indicator uses realtime data. Thus DO NOT download Demo version. If you still need demo version, please refer to free version .
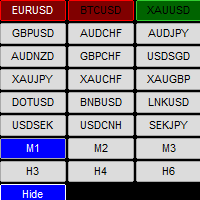
Symbol Chart Changer is an indicator/utility that offers you the option to switch between symbols and timeframes.
You can choose any symbol and timeframe on the same chart with just a few clicks. In addition, this indicator also shows the profit of the symbol through the color of the buttons.
Features: Click buttons on the chart to monitor a
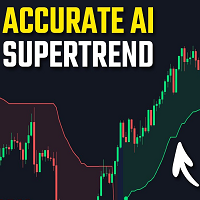
Machine Learning Adaptive SuperTrend - Take Your Trading to the Next Level!
Introducing the Machine Learning Adaptive SuperTrend , an advanced trading indicator designed to adapt to market volatility dynamically using machine learning techniques. This indicator employs k-means clustering to categorize market volatility into high, medium, and low levels, enhancing the traditional SuperTrend strategy. Perfect for traders who want an edge in identifying trend shifts and market conditio
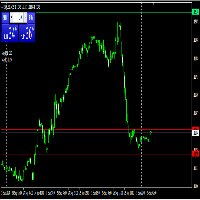
Please share a comment or rate for improvement Main Function : The start function is called on each new tick. It performs the main logic of the indicator: It initializes arrays to store daily high and low prices. It resizes and initializes these arrays based on the number of days specified by the DAYS input parameter. It copies the daily high and low prices into these arrays. It finds the highest high and the lowest low over the specified number of days. It displays these values as com
FREE
Questo indicatore è stato progettato per la creazione comoda e veloce di screenshot dei grafici nel terminale di trading. Semplifica notevolmente il processo di salvataggio dei grafici in una determinata directory, fornendo una comoda interfaccia con un pulsante sul grafico, che si attiva con un solo clic.
Le funzioni principali dell'indicatore sono:
Creazione automatica di uno screenshot del grafico quando viene premuto il pulsante. Possibilità di selezionare una directory per il salvataggio
FREE
Questo indicatore semplifica il processo di creazione dei modelli di grafico, consentendo di salvare le impostazioni correnti del grafico in un modello con un solo clic su un pulsante. L'indicatore aggiunge un pulsante direttamente sul grafico che salva automaticamente il modello con un determinato nome e prefisso, facilitando l'organizzazione e l'utilizzo dei modelli.
Le funzioni principali dell'indicatore sono:
Creazione di un modello del grafico corrente con un solo clic sul pulsante. Poss
FREE
Stochastic Multicurrency Scanner Dashboard MT4 è uno strumento potente progettato per monitorare più coppie di valute e timeframe utilizzando l’oscillatore Stocastico. Organizza i segnali in un formato a griglia, mostrando lo stato di ogni simbolo nei timeframe da M1 a MN1. I trader possono abilitare o disabilitare timeframe specifici per adattarsi alle loro strategie. La versione per MT5 è disponibile qui: Stochastic Oscillator Multicurrency Scanner MT5 Per la documentazione dettagliata, clicca
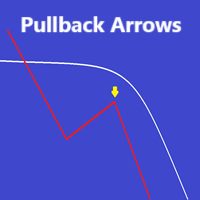
L'indicatore fornisce frecce di acquisto e vendita con una media mobile e un colore della barra basato sull'EMA
Solo le frecce di acquisto vengono mostrate sopra la media mobile e solo le frecce di vendita vengono mostrate sotto la media mobile
Le frecce si basano su un algoritmo di inversione e quindi cercano di trovare i punti di pullback
Gli avvisi possono essere attivati a piacere
Adatto a qualsiasi periodo di tempo o strumento di scelta
Si prega di testare in demo prima de

To access the TD sequential Scanner for MT5, please check https://www.mql5.com/en/market/product/123369?source=Site +Market+My+Products+Page. One of the MT5 versions includes additional timeframes such as M1, M2, M3,H2,H6,H8 and so on.( https://www.mql5.com/en/market/product/123367?source=Site +Market+My+Products+Page) TD Sequential Scanner: An Overview The TD Sequential scanner is a powerful technical analysis tool designed to identify potential price exhaustion points and trend reversals in fi

THE INDICATOR WITH A DOUBLE MOVING AVERAGE (MA).
Recommendations: The indicator works better if two lines are of the same color at the same time. (if one is green and the other is red, the price is in the flat zone (it's better not to do anything)).
Input parameters:
1. The period of the first and second MATCH. 2. The thickness of the line of the first and second MATCH. 3. The color of the line of the first and second MATCH.
Looking for a good broker? Then I have a good offer for you! - 4
FREE

This scanner is for showing Cross of various TDI elements: PriceLine, Trade Signal Line and Market Base Line And for getting alerts, so you can be prepared for finding good trade setups before they happen. It also shows TDI signals, trend, volatility and different timeframe alignment.
Detailed blog post:
https://www.mql5.com/en/blogs/post/759050
Features: Show TDI Signal and Trend Show Volatility & Overbought/Oversold Show cross between: PriceLine & TSL PriceLine & MBL MBL & TSL PriceLine and
Order Block Tracker is here to solve one of the biggest challenges traders face: identifying order blocks. Many traders fail to spot these critical zones, often missing out on key market entries. But with Order Block Tracker , you no longer have to worry about that. This advanced indicator automatically highlights these crucial zones for you, giving you the confidence to enter the market at the right time. MT5 Version - https://www.mql5.com/en/market/product/123362/ Key Features of Order Block
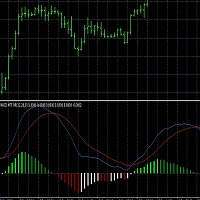
This script generates a MACD with 6 color-coded histogram bars based on the position (above or below zero) and direction (rising or falling) of the histogram. It provides multi-time frame support , allowing users to view the MACD from different time frames on a single chart. The indicator uses customizable settings for MACD periods, histogram width, and vertical scaling. This script could be useful for traders who want a visually enhanced MACD with clearer trend and momentum representation acro
FREE
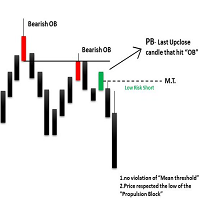
The ICT Propulsion Block indicator is meant to detect and highlight propulsion blocks, which are specific price structures introduced by the Inner Circle Trader (ICT). Note: THIS IS MTF version. Single Timeframe version avaiable at here
Propulsion Blocks are essentially blocks located where prices interact with preceding order blocks. Traders often utilize them when analyzing price movements to identify potential turning points and market behavior or areas of interest in the market.

CYCLE WAVE OSCILLATOR indicator is an indicator based on cyclical price fluctuations. This indicator can help you determine overbought and oversold levels, and help you predict price trends within the cycle. MT5 Version here! You can combine it with our indicators below to make your trading decisions more accurate: Supply Demand Ribbon MT4 Basic
Feature: - Three Trend Types: + Zero + Basic + Advanced
FREE
This indicator managge all kind of ICT FVG include: FVG, SIBI, BISI, Inverse FVG. The advantage point of this indicator is mangage FVG on all timeframe. FVG - Fair value gap ICT Fair value gap is found in a “three candles formation” in such a way that the middle candle is a big candlestick with most body range and the candles above & below that candle are short and don’t completely overlap the body of middle candle. * This indicator allow filter FVG by ATR. So you can just show valid FVG which

The Real Cloud indicator for MT4 is a popular and useful Forex indicator. This indicator provides traders with an easy way to identify potential trading opportunities in the Forex market. The Real Cloud indicator uses a unique algorithm to analyze price action and generate signals. It is designed to identify strong trends and provide traders with an edge in their trading. The Real Cloud indicator is easy to use and requires no additional setup. Simply attach the indicator to your chart and it wi
Индикатор Order blocks Mtf строит уровни на основе smart mony(умные деньги) Строит уровни как сразу получил излом тренда, индикатор очень удобен и практичен для использование на форекс и на бинарных опционов В него в шита система поиска сигналов на касании старших уровней таким же уровней излома тренда и ретеста к среднему значению При касании уровня очень хорошо отрабатывает на бинарных опционах,

Dynamic Forex28 Navigator - Lo strumento di trading Forex di nuova generazione.
ATTUALMENTE SCONTATO DEL 49%. Dynamic Forex28 Navigator è l'evoluzione dei nostri indicatori popolari di lunga data, che combinano la potenza di tre in uno: Advanced Currency Strength28 Indicator (695 recensioni) + Advanced Currency IMPULSE con ALERT (520 recensioni) + CS28 Combo Signals (Bonus). Dettagli sull'indicatore https://www.mql5.com/en/blogs/post/758844
Cosa offre l'indicatore di forza di nuova generazione?

L'indicatore misura lo squilibrio tra tori e orsi in un periodo scelto e mostra una linea retta tra i due punti.
Se i tori hanno più volume degli orsi, la linea diventa verde. Se gli orsi hanno più volume, la linea diventa rossa. La linea mostra anche la differenza percentuale di volume.
L'indicatore mostra gli stessi dati in una finestra separata. È possibile vedere anche il volume diviso.
L'indicatore ha due modalità.
A tale scopo, in alto a sinistra è presente un pulsante che,
- se n
Gli obiettivi precisi di GANN sono calcolati secondo i suoi metodi collaudati e presentati chiaramente davanti a te. Questo strumento è progettato per rendere il trading più fluido e intuitivo. Spostando la linea bianca verso l'alto o quella verde verso il basso, capirai subito perché le tecniche di GANN rimangono influenti nel mondo del trading. Le strategie di GANN si concentrano sulla previsione dei movimenti di mercato con grande precisione, e questo strumento porta quel potere a portata di

Migliora la tua esperienza di trading con l'indicatore Your Chart! Questo strumento gratuito e altamente personalizzabile consente ai trader di unire più timeframe in un'unica visualizzazione pulita delle candele, senza alterare il grafico originale. Con Your Chart, puoi impostare il numero di barre per ogni candela personalizzata – ad esempio, combinare ogni 18 candele M1 in una sola per una visione più ampia delle tendenze di mercato. Caratteristiche principali: Formazione di candele personali
FREE

CVB Cumulative Volume Bands: Potenzia le tue operazioni con il volume accumulato! CVB Cumulative Volume Bands è un indicatore avanzato progettato per i trader che cercano segnali precisi basati sul volume accumulato. Utilizzando bande di volume accumulato, questo indicatore offre letture chiare delle pressioni di acquisto e vendita nel mercato, aiutando a identificare inversioni e forti movimenti dei prezzi. Cumulative Volume Bands for MT5 !
Caratteristiche principali: Analisi

Zen Market Flow - MTF SuperTrend
Il MTF SuperTrend è un sistema che può essere utilizzato su qualsiasi intervallo di tempo. Questo indicatore multi-timeframe mostra segnali da 1 a 3 timeframe simultaneamente e indica il loro allineamento.
Se ti piace l'indicatore SuperTrend, adorerai questa versione.
Puoi anche testare i segnali e i disegni dell'indicatore nel backtest, dove puoi visualizzare i segnali multi-timeframe.
L'indicatore fornisce segnali quando tutti gli intervalli di tempo mostr
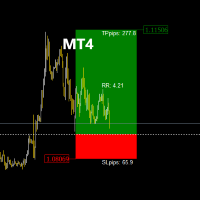
The RR_TradeManager Visualizer is a trade management indicator designed for traders who want to easily visualize their Take Profit (TP) and Stop Loss (SL) levels on a chart. This initial version provides a simple graphical representation that displays SL and TP zones as well as the entry price. Please note that this current version focuses solely on the graphical display of SL and TP zones as figures on the chart. Current Version Features: SL and TP Zones Display: Clear visualization of stop los
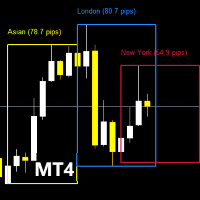
Before diving into the features of this indicator, please remember to rate this product, leave a comment to share your experience, and subscribe to my page to stay informed about the latest updates and new tools. Your support is invaluable and helps me constantly improve my creations! Description: TradingSessionPipsVisualizer - The Professional Tool for Mastering Trading Sessions Visualize Forex sessions at a glance and optimize your trading timing! The TradingSessionPipsVisualizer is a premium
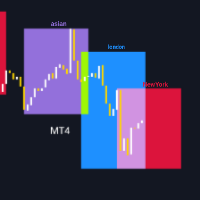
Before diving into the features of this indicator, please rate this product, leave a comment to share your experience, and subscribe to my page to stay updated on the latest releases and tools. Your support is valuable and helps me continuously improve my creations! Description: The TradingSessionVisualizer is a powerful MetaTrader 4 indicator designed to provide a clear and customizable visualization of major trading sessions on your charts. This tool allows you to easily distinguish between As
FREE

Stratos Pali Indicator is a revolutionary tool designed to enhance your trading strategy by accurately identifying market trends. This sophisticated indicator uses a unique algorithm to generate a complete histogram, which records when the trend is Long or Short. When a trend reversal occurs, an arrow appears, indicating the new direction of the trend.
Important Information Revealed Leave a review and contact me via mql5 message to receive My Top 5 set files for Stratos Pali at no cost!
Dow

Introducing Volume Orderflow Profile , a versatile tool designed to help traders visualize and understand the dynamics of buying and selling pressure within a specified lookback period. Perfect for those looking to gain deeper insights into volume-based market behavior! MT5 Version - https://www.mql5.com/en/market/product/122657 The indicator gathers data on high and low prices, along with buy and sell volumes, over a user-defined period. It calculates the maximum and minimum prices during this

The Block Master Pro indicator is designed to visually identify areas on the chart where significant volumes from major market participants are likely concentrated. These areas, known as order blocks, represent price ranges where large players place their orders, potentially signaling a price reversal and movement in the opposite direction. Key Features:
Order Block Identification: Block Master Pro effectively identifies order blocks by pinpointing price ranges where large orders are placed. Th

Gold Pro Scalper
Precise entry points for currencies, crypto, metals, stocks, indices! Indicator 100% does not repaint!!!
If a signal appeared, it does not disappear! Unlike indicators with redrawing, which lead to loss of deposit, because they can show a signal, and then remove it.
Trading with this indicator is very easy.
Wait for a signal from the indicator and enter the deal, according to the arrow
(Blue arrow - Buy, Red - Sell).
I recommend using it with the Trend Filter (download

An imbalance bar or candle, also called a fair value gap (FVG) or inefficiency, shows strong buying or selling in the market or weak buying or selling that causes prices to move quickly with high momentum. This is why it's an important part of price action analysis. Our indicator offers three main benefits: Clear Design: The imbalance bar is built into the candle with a simple, clean look that makes it easy for traders to spot while keeping the chart tidy. Easy to Use: A hotkey lets traders quic
FREE

ATR Bands with Take-Profit Zones for MT4 The ATR Bands indicator for MT4 is designed to assist traders in managing risk and navigating market volatility. By using the Average True Range (ATR), it helps identify key price levels and set realistic stop-loss and take-profit zones. Key Features: ATR-Based Bands : The indicator calculates dynamic upper and lower bands using ATR. These bands adjust based on price volatility, helping to indicate potential support and resistance levels. Customizable Par
FREE

The indicator calculates a combination of two moving averages and displays their trend in derivative units. Unlike traditional oscillators, the maximum and minimum values in this indicator always correspond to the number of bars you want to track. This allows you to use custom levels regardless of volatility and other factors. The maximum and minimum values are always static and depend only on the initial Bar review settings.
The indicator can be used as an independent trading systemtrading
FREE
Este indicador irá ajudá-lo a traçar as linhas do horizonte ( Marcelo Ferreira ) do Grafico semanal. Você poderá mudar trabalhar por exemplo em M5 ou M15. As linhas semanais permanecerão lá. Analisar as tendências em gráficos semanais antes de fazer uma entrada no mercado Forex é essencial para identificar a direção predominante do mercado a longo prazo. Esse tipo de análise ajuda a evitar decisões impulsivas baseadas em flutuações de curto prazo e fornece uma visão mais clara sobre o movimento
FREE

This is a very simple multiple moving average indicator.
It can display 12 moving averages. The time axis of the moving averages can be changed in the input field of the indicator. The process is faster than the 12 moving averages included with MT4.
We also have a buffer set up so you can access it from an Expert Advisor. *For advanced users.
If you have any questions or requests, please message me.
Thank you. MT5 Version: https://www.mql5.com/en/market/product/124997
FREE

The indicator is getting the four most important trading sessions: New York London Sydney
Tokyo The indicator auto calculate the GMT time. The indicator has buffers that can be used to get the current session and the GMT.
You can use it as stand alone indicator and you can turn the draw off and call it from your EA. INPUTS Max Day: Max days back to get/draw. London Session On: Show/Hide London Session. New York Session On: Show/Hide New York Session. Sydney Session On: Show/Hide Sydney Session
FREE

The Multi Pairs Forex Indicator is an advanced trading too l that allows traders to track and analyze the performance of multiple currency pairs in real-time on a single chart. It consolidates data from various Forex pairs, providing an at-a-glance overview of market conditions across different currencies and helps you save time. Useful for various trading styles, including scalping, day trading, and swing trading. Whether you're monitoring major pairs like EUR/USD, GBP/USD, or more exotic pair

In the context of trading, Malaysia SNR (Support and Resistance) refers to the technical analysis of support and resistance levels in financial markets, particularly for stocks, indices, or other assets traded. There are three type of Malaysia SNR level Classic , GAP and Flipped 1. Classic Support is the price level at which an asset tends to stop falling and may start to rebound. It acts as a "floor" where demand is strong enough to prevent the price from dropping further. Resistance

Advanced UT Bot & HTS Indicator This indicator is an advanced technical analysis tool that combines two methods: UT Bot and HTS (Higher Timeframe Smoothing) , to generate accurate buy and sell signals. 1. Indicator Structure Works within the main chart window and utilizes 11 buffers to store various data points, including arrows (buy/sell signals) and bands from both UT Bot and HTS systems. Uses colored arrows to represent different trading conditions: Blue arrows : Normal buy signals. Red arro

Advanced ATR Trailing Stop with EMA Filter Indicator Introducing the ATR Trailing Stop with EMA Filter Indicator , a powerful tool designed to enhance your trading strategy with advanced signal filtering. This indicator combines the precision of ATR (Average True Range) trailing stop calculations with the flexibility of an EMA (Exponential Moving Average) filter, ensuring you capture the best opportunities in the market. Key Features: Dual Signal Arrows: The indicator provides two types of arrow
Welcome to enhanced pattern detection with the Double Top and Bottom Pattern Scanner ! Transform your trading approach with this powerful MT4 indicator designed for efficient pattern scanning and actionable alerts. Key Features: Advanced Zig Zag Pattern Detection : The Double Top and Bottom Pattern Scanner uses the zig zag pattern to detect tops and bottoms. It identifies points where the price bounces back twice from the same level after a long trend, signaling potential market reversals. Real

This is a comprehensive multi-timeframe , multi-indicator dashboard designed to simplify and enhance your trading experience. The dashboard provides real-time insights across multiple currency pairs and timeframes, helping traders quickly assess market conditions and make informed decisions. With a user-friendly interface, customizable settings, and a robust selection of indicators, this tool is an essential addition to any trader's arsenal.
Key Features: Multi-Timeframe Analysis: Monitor key
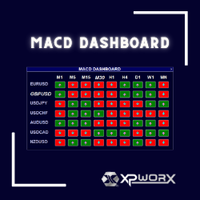
Simplify Your Trading with the MACD Dashboard
Are you tired of juggling multiple MetaTrader charts to monitor MACD across different timeframes and symbols? The MACD Dashboard is the solution you've been waiting for. This innovative MetaTrader indicator provides a centralized view of MACD signals on multiple charts, making it easier than ever to identify trading opportunities and manage your risk.
Key Features: Multi-Timeframe Monitoring: Track MACD signals on multiple timeframes simultaneousl
This is Multiple Timeframe of Malaysia SNR Levels and Storyline. The single timeframe version here Features: + Display level on multiple timeframe (higher or lower) + Turn on/off level on timeframe + Alert when price touch level 1. if high > resistance level but close of candle < resistance level , this level become unfresh - Name of level will have "(m)" meaning mitigated if close of candle > resistance level , this level become invalid and can be removed in chart (there is setting for keep
Please remember to leave a review for improvements thank you Overview of Key Functionalities: Buy Signal Conditions : The Stochastic Oscillator's main line crosses above the signal line. The closing price of the current candle is higher than the previous candle's close. The current closing price is above the EMA (Exponential Moving Average). The Stochastic value is below 50. When these conditions are met, a buy arrow is plotted, and alerts (audible or push notifications) are triggered. Sell Sign
FREE

Trend Cutter è un indicatore di tendenza che può essere utilizzato con qualsiasi intervallo di tempo, inclusi gli intervalli di tempo inferiori come M1 e M5. L'indicatore è ideale per i trader che preferiscono il trading intraday e sarà utile anche per coloro che preferiscono il trading a lungo termine. Puoi utilizzare questo indicatore come base per il tuo sistema di trading o come soluzione di trading autonoma. L'indicatore fornisce tutti i tipi di avvisi, comprese le notifiche PUSH. L'indicat
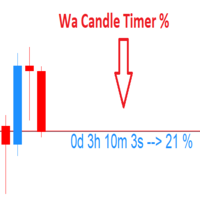
Wa Candle Timer Percentage MT4 is an indicator which shows the user how much time is remaining until the next candle will form. The percentage of the evolution of the current candle is also displayed. The user can set the percentage that the candle timer will change the color. These are the settings: 1- The percentage that the candle timer will change the color. 2- Color of Candle Timer when it's BELOW the percentage set by the user. 3- Color of Candle Timer when it's ABOVE the percentage set b
FREE

Volume PRO is an innovative and modernized indicator for analyzing trading volumes, which is an advanced version of traditional analysis tools. This high-tech indicator allows traders to effectively monitor trading activity without the need for complex calculations. It displays ticks for the selected time interval corresponding to the selected time frame in the form of a dynamic cumulative histogram, which is updated in real time as new trades are received. Key features: Innovative volume analys

This indicator is a certain algorithm and acts as a market scanner. All you need to do is fill in the selected currency pairs in the settings and that’s it. Next, the indicator itself will view all these currency pairs and time frames from M5 to D1 simultaneously. When a new signal appears, the indicator will give you an Alert and also draw the letter N where this new signal will be.
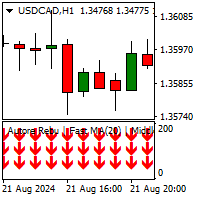
L'indicatore di Tendenza MovingAverageTrends è uno strumento di analisi tecnica progettato per identificare la direzione generale del mercato e fornire segnali di acquisto o vendita. L'indicatore utilizza tre medie mobili dove è possibile settare diversi periodo. Funzionamento Condizioni Rialziste (Bullish): L'indicatore mostra 3 frecce verdi verso l'alto quando tutte e tre le medie mobili sono orientate al rialzo. Questo segnale suggerisce che il mercato è in una fase rialzista e potrebbe esse
Engulfing Pattern is a free indicator available for MT4/MT5 platforms, its work is to provide "alerts" when a "Bullish" or "Bearish engulfing pattern forms on the timeframe. This indicator comes with alerts options mentioned in the parameter section below. Join our MQL5 group , where we share important news and updates. You are also welcome to join our private channel as well, contact me for the private link. Engulfing Pattern Indicator MT5 Other Products Try our Martini EA with 2 years of liv
FREE
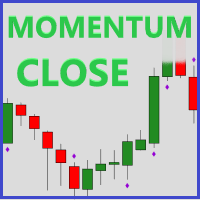
Momentum Close is a useful tool to identify volume based on the strength of a candle close. A strong candle close is when there is a small wick in comparison to the candle body and is a sign that the market will continue in that direction. *This is a NON-repainting indicator*
How this can help you? Identify trend strength Trend confirmation Seeing potential reversals (strong rejection candle) Developing entry and exit strategies Strong confluence to add to your strategy Volume analysis
Featur
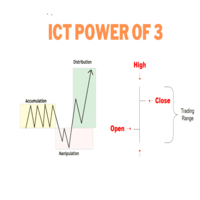
ONLY LOOK TO TRADE DURING TIMES AS SEEN IN SCREENSHOT. START TO LOAD THE INDICATOR BEFORE TO CALCULATE THE BARS SO IT SHOWS THE PHASES ACCORDING TO ICT. 1. London Silver Bullet (3:00 AM - 4:00 AM NY Time) Before 3:00 AM : The market is typically in the Accumulation Phase before the London open, where price consolidates, and large market players accumulate positions. You watch for this quiet consolidation leading up to the manipulation. 3:00 AM - 4:00 AM : Manipulation Phase occurs. During this

This indicator ( dashboard) provides trend for multi currency on multi timeframe Charts. It gives entries and Stoploss on the chart itself if the currency pair is uptrend then the cell color is displayed as Green and if its downtrend the cell displays the color as Red.If the cell colour displayed on particular currency is green it represents strong uptrend and vice versa if the cell colour is Red.If the cell has just an arrow it means the currency is ready for the trend.If the cell has neither
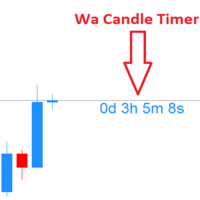
Wa Candle Timer MT4 è un indicatore potente e intuitivo progettato per mostrare il tempo rimanente prima della formazione della prossima candela sul grafico MT4. Aiuta i trader a tenere sotto controllo i tempi di chiusura delle candele per operazioni più precise. Caratteristiche principali :
Visualizza il conto alla rovescia della candela in corso
Cambia colore quando il tempo scende sotto una soglia impostata
Novità nella versione 3.00: avviso personalizzabile al raggiungimento di una
FREE
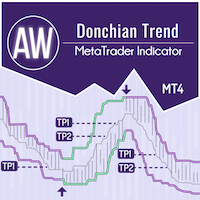
AW Donchian Trend è un indicatore di tendenza basato sul canale Donchian. L'indicatore può calcolare i livelli TakeProfit e StopLoss, ha statistiche avanzate sul successo dei segnali, nonché tre tipi di notifiche sul segnale ricevuto. Guida all'installazione e istruzioni - Qui / Versione MT5 - Qui Come fare trading con l'indicatore: Fare trading con AW Donchian Trend è semplice: bastano tre semplici passaggi: Fase 1 - Apertura di una posizione Un segnale di acquisto viene ricevuto con

Reversal Zones Pro is an indicator specifically designed to accurately identify key trend reversal zones. It calculates the average true range of price movement from the lower to upper boundaries and visually displays potential zones directly on the chart, helping traders effectively identify important trend reversal points. Key Features: Reversal Zone Identification: The indicator visually displays potential reversal zones directly on the chart. This helps traders effectively identify importan
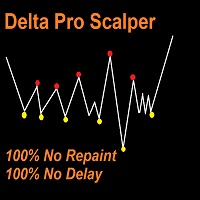
Delta Pro Scalper - Your Ultimate Trend Trading Solution, Delta Pro Scalper is a TREND indicator that automatically analyzes the market and provides information about the trend without redrawing or delay.
The indicator uses candlestick OHLC data and analyzing them to determine up trend or down trend, You MUST wait till closing candle, once the dot appear the next open candle you can open buy or sell position.
Red Dot = Bearish Trend (Open SELL)
Yellow Dot = Bullish Trend (Open BUY)
Here's the f

The Escobar Reversal Indicator focuses on giving unique smart buy and sell signals, along the side you will get stop loss target and various take profit targets to choose from!
Comes with a built in trend analyzer sitting in the middle under the name, this trend analyzer can help us confirm entries and increase the accuracy.
Now remember this might be a good indicator with easy functions for beginners but that won’t mean you shouldn’t add some extra indicators to help you confirm and get you

!!!The free version works only on "EURUSD"!!! WaPreviousCandleLevels MT4 shows the previous candle levels, it shows the previous candle Open High Low Close levels (OHLC Levels) in different time frame. It's designed to help the trader to analyse the market and pay attention to the previous candle levels in different time frame. We all know that the OHLC Levels in Monthly, Weekly and Daily are really strong and must of the time, the price strongly reacts at those levels. In the technical analys
FREE

Smart Fibo Zones are powerful, auto-generated Fibonacci Retracements that are anchored to key market structure shifts . These zones serve as critical Supply and Demand levels, guiding you to identify potential price reactions and confirm market direction. Fibonacci calculations, widely used by professional traders, can be complex when it comes to identifying highs and lows. However, Smart Fibo Zones simplify this process by automatically highlighting order blocks and key zones, complete with St

WaPreviousCandleLevels MT4 shows the previous candle levels, it shows the previous candle Open High Low Close levels (OHLC Levels) in different time frame. It's designed to help the trader to analyse the market and pay attention to the previous candle levels in different time frame. We all know that the OHLC Levels in Monthly, Weekly and Daily are really strong and must of the time, the price strongly reacts at those levels. In the technical analysis, the user can use them as a support and res
FREE

【 TrendLinePro2 】 MT4 (MetaTrader 4) line trading aid indicator. It is a very basic specification that is recommended for everyone, assuming that it is faithful to the Dow Theory. It recognises trends based on the Dow Theory and furthermore automatically draws support, resistance and trend lines in real time. The accuracy is very high.
【 ZigZag 】 Based on the original zigzag created from the chart shape and in line with Dow Theory. The trend that can be read from

he "Super Trampoline" is an innovative trading indicator designed to simplify decision-making in financial markets. It analyzes chart data and provides clear and timely signals on when to buy or sell an asset, based on a proven strategy of candlestick pattern analysis. Product Advantages: Intuitive Interface : "Super Trampoline" integrates directly into your trading terminal, displaying signals as simple arrows on the chart. This means you don't need deep technical analysis knowledge to start us

Introducing "Super Transplant with Filter" — a game-changing tool for traders who value precision, reliability, and simplicity. This indicator combines advanced trend analysis techniques with intelligent signal filtering, allowing you to make decisions based on the most relevant data. Benefits of "Super Transplant with Filter": Accuracy in Every Trade : The indicator meticulously analyzes market data, identifying key trends while filtering out false signals. This enables you to make more informe
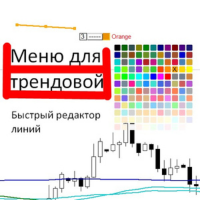
Выпадающее меню для трендовых линий и прямоугольника. Позволяет редактировать цвет, стиль и толщину. При выделении линии появляется меню, каждая функция разделена. Можно сразу нажать и поменять на нужное. Толщина меняется по другому, нужно нажать на цифру, она станет в синем цвете, нажать нужную цифру от 1 до 4, в зависимости от нужной толщины, нажать интер.
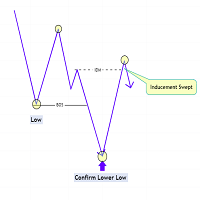
The Market Structure with Inducements & Sweeps indicator is a unique take on Smart Money Concepts related market structure labels that aims to give traders a more precise interpretation considering various factors.
Compared to traditional market structure scripts that include Change of Character (CHoCH) & Break of Structures (BOS) -- this script also includes the detection of Inducements (IDM) & Sweeps which are major components of determining other structures labeled on the chart.
SMC & pri
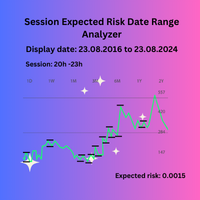
Session Expected Risk Date Range Analyzer: Analyzes price data across specified date ranges to provide detailed insights into financial risk and volatility, using each bar's price metrics for accurate risk assessment.
The Session Expected Risk Date Range Analyzer is a sophisticated tool designed to offer traders and analysts detailed insights into the expected financial risk across specific date ranges. Unlike traditional session-based analysis, this indicator focuses on calculating risk metr
FREE

Session Standard Deviation Date Range Analyzer: Evaluate the standard deviation of each bar's price (high, low, close, open, weighted, median, and typical) within defined trading sessions and date ranges, providing detailed insights into price volatility and market behavior. **Note:** When the trading platform is closed, the indicator may not load correctly. To ensure it works, you may need to load the indicator, unload it, and then load it again. **Note:** This indicator can only be used with
FREE
Il MetaTrader Market è il posto migliore per vendere robot di trading e indicatori tecnici.
Basta solo sviluppare un'applicazione per la piattaforma MetaTrader con un design accattivante e una buona descrizione. Ti spiegheremo come pubblicare il tuo prodotto sul Market per metterlo a disposizione di milioni di utenti MetaTrader.
Ti stai perdendo delle opportunità di trading:
- App di trading gratuite
- Oltre 8.000 segnali per il copy trading
- Notizie economiche per esplorare i mercati finanziari
Registrazione
Accedi
Se non hai un account, registrati
Consenti l'uso dei cookie per accedere al sito MQL5.com.
Abilita le impostazioni necessarie nel browser, altrimenti non sarà possibile accedere.