Смотри обучающее видео по маркету на YouTube
Как купить торгового робота или индикатор
Запусти робота на
виртуальном хостинге
виртуальном хостинге
Протестируй индикатор/робота перед покупкой
Хочешь зарабатывать в Маркете?
Как подать продукт, чтобы его покупали
Новые технические индикаторы для MetaTrader 4 - 33
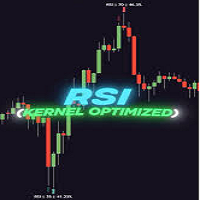
GENERAL OVERVIEW
Introducing our new KDE Optimized RSI Indicator! This indicator adds a new aspect to the well-known RSI indicator, with the help of the KDE (Kernel Density Estimation) algorithm, estimates the probability of a candlestick will be a pivot or not. For more information about the process, please check the "HOW DOES IT WORK ?" section. Features of the new KDE Optimized RSI Indicator :
A New Approach To Pivot Detection
Customizable KDE Algorithm
Realtime RSI & KDE Dashboard
Alert

Indicator detects long bars. How to use:
base = base value in points of our long bar if this value is larger than bar we have our signal. useSplit = when we want to divide our trading into two before and after preset time. Both before and after work the same as our base . splitTimeHour = split time hour 14:00 would be 14. splitTimeMinute = split time minute 14:30 would be 30. before = same as base long bar value in points. after = same as base long bar value in points. useATR = instead o
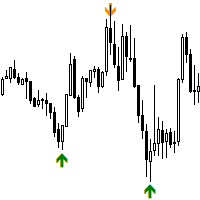
Swing Points Indicator for MetaTrader 4
The **Swing Points Indicator** is a custom-built technical tool designed for MetaTrader 5 (MT5), primarily used for identifying crucial reversal points in price action. By plotting swing highs and swing lows, it highlights potential trend reversals, making it a valuable tool for traders relying on price action analysis. This indicator helps traders anticipate changes in market direction by visually marking significant turning points on the chart.
Main F

Версия MT4: https://www.mql5.com/ru/market/product/125434 Версия MT5: https://www.mql5.com/ru/market/product/157662
Помощник MT4: https://www.mql5.com/ru/market/product/107986
РАЛЛИ БАЗОВОЕ РАЛЛИ (RBR), ПАДЕНИЕ БАЗОВОЕ РАЛЛИ (DBR), ПАДЕНИЕ БАЗОВОЕ ПАДЕНИЕ (DBD), РАЛЛИ БАЗОВОЕ ПАДЕНИЕ (RBD), РАЗРЫВ СПРАВЕДЛИВОЙ ЦЕННОСТИ (FVG) / ДИСБАЛАНС, СКРЫТАЯ БАЗА
Представляем индикатор «Supply Demand MT4» — ваш лучший инструмент для точной и уверенной навигации в динамичном мире финансовых рынков. Этот п

Huge 70% Halloween Sale for 24 hours only!
Send us a message after your purchase to receive more information on how to get your BONUS for FREE that works in great combination with Bull vs Bear ! Bull versus Bear is an easy-to-use Forex indicator that gives traders clear and accurate signals based on clear trend retests . Forget about lagging indicators or staring at charts for hours because Bull vs Bear provides real-time entries with no lag and no repaint, so you can trade with confiden
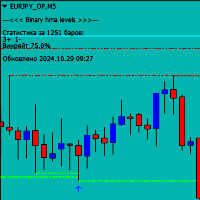
Индикатор Binary hma levels для MT4 разработан специально для бинарных опционов, но отлично подходит и для торговли на Forex. Он работает от уровней, выдавая сигналы в виде стрелок перед закрытием текущей свечи, когда подтверждается отбитие цены от ключевого уровня. Для корректной работы индикатора необходимо скачать и установить папку "MQL5" в директорию вашего терминала. Скачать папку можно по ссылке: ссылка . Индикатор универсален и работает на любых таймфреймах и валютных парах, но для по
Этот индикатор обеспечивает эффективный способ одновременно контролировать несколько валютных пар и таймфреймов. Отображая расхождения между ценой и MACD в наглядной и удобочитаемой таблице, он позволяет трейдерам определять потенциальные разворотные точки на рынке без постоянного переключения между графиками. Дивергенции могут указывать на изменение бычьего или медвежьего импульса. Например, медвежья дивергенция возникает, когда цена достигает нового максимума, но MACD не подтверждает его соотв
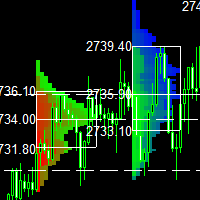
Данный индикатор представляет собой классическую реализацию рыночного профиля ( Volume Profile Visible Range ), позволяющий отображать плотность цен по времени, выделяя наиболее важные ценовые уровни, область ценности и контрольную цену в рамках конкретной торговой сессии. MT5-version: https://www.mql5.com/en/market/product/125308 Этот индикатор можно применять на временных интервалах от M1 до D1, что позволяет анализировать рыночный профиль как для дневных, недельных и месячных сессий, так и д

Индикатор разворота тренда с алертами и пуш-уведомлениями предназначен для обнаружения точек разворота на графике цены, используя комбинацию индикаторов скользящей средней (MA), стохастика (Stochastic Oscillator), и среднего истинного диапазона (ATR). Индикатор строит стрелки на графике, указывающие на возможные моменты покупки или продажи, и может отправлять уведомления в реальном времени в виде алертов, пуш-уведомлений и писем по электронной почте при появлении сигнала на текущем баре. Ключевы
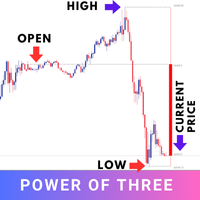
The "Power of Three" (PO3) is a concept developed by the Inner Circle Trader (ICT) to illustrate a three-stage approach used by smart money in the markets: Accumulation, Manipulation, and Distribution . ICT traders view this as a foundational pattern that can explain the formation of any candle on a price chart. In simple terms, this concept is effective for any time frame, as long as there's a defined start, highest point, lowest point, and end. MT5 - https://www.mql5.com/en/market/product/124
FREE
« Easy Indicator » форекс – это стрелочный индикатор, основанный на нестандартных принципах расчета. Оптимальный выход отмечен желтым крестиком, он сигнализирует об оптимальной точке выхода в текущем тренде. Аварийный выход отмечен красной точкой, что сигнализирует о возможном изменении тенденции. В разделе «Risk» отображается текущий риск по данной сделке, который рассчитывается с учетом особенностей текущего графика.
This indicator is the mql version of the Linear Regression Candles indicator. Find out more here: https://www.mql5.com/en/users/rashedsamir/seller There are many linear regression indicators out there, most of them draw lines or channels, but this one actually draws a chart.This script includes features such as linear regression for open, high, low, and close prices, signal smoothing with simple or exponential moving averages. I welcome your suggestion for improving the indicator.
To incre
FREE
Signal Indicator
when price is crossing Trend Lines Horizontal Lines Rectangles Works on all timeframes and with all instruments. Multiple notification types Arrows on Chart Alert box Journal Log File Log Specific Sound Email Notification (must be configured in Terminal - please review MT4 docs) Push Notification (must be configured in Terminal - please review MT4 docs) Draw your trend lines, horizontal lines or rectangles onto your chart. Select an object and bring up its properties and type

The Zero-Lag MA Trend Levels indicator combines a Zero-Lag Moving Average (ZLMA) with a standard Exponential Moving Average (EMA) to provide a dynamic view of the market trend. This indicator automatically plots the EMA and ZLMA lines on the chart. The colors of the lines represent the market trend.
With EMA: ++ green (uptrend) when EMA > zlma ++ red (downtrend) when EMA < zlma With ZLMA: ++ green (uptrend) when the line is trending up ++ red (downtrend) when the line is trending down
When th

The Zone1 is a tool to help professional or novice traders to assist in making decisions to buy or sell. This indicator is also not repainted so it is also suitable for scalping strategies, day trading and even swing strategies. i hope you can profitable like me....
if you have quotion abot this product you can contact me via email ichwan.dreamweaver@gmail.com

Этот индикатор предназначен для использования на живом графике, а не для тестера. Индикатор PRO Trend Divergence — это передовой инструмент технического анализа, предназначенный для выявления дивергенции продолжения тренда — сигнала, указывающего на вероятное сохранение текущего тренда. В отличие от обычных индикаторов, которые сосредоточены на разворотах, этот инструмент помогает трейдерам определить, когда тренд остается сильным, даже во время временных откатов или небольших коррекций. Диверг

MT4 CCI Dashboard Scanner помогает вам отслеживать уровни Индекса товарного канала (CCI) на разных таймфреймах и инструментах, а также предоставляет уведомления в реальном времени, когда обнаруживается новый сигнал. Он удобен в использовании и не требует много вычислительных ресурсов, что обеспечивает плавную работу на любом компьютере. Ключевые особенности: Автоматическая группировка инструментов: Сканер собирает все инструменты из вашего списка "Наблюдение за рынком" и организует их в категори
FREE
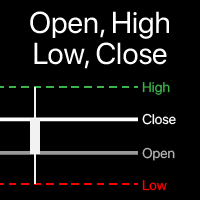
Визуализация уровней Open, High, Low, Close на графике Вы можете выбрать любой таймфрейм , не только текущий. Смещение рассчитываемого бара можно настроить: текущий (плавающий) бар, или заданное количество баров назад . Многофункциональная утилита : включает 66+ функций | Свяжитесь со мной если у вас есть вопросы | Версия для MT5 В настройках индикатора можно настроить: Смещение рассчитываемого бара: 0 = текущий бар, 1 = предыдущий бар, 2 = 2 бара
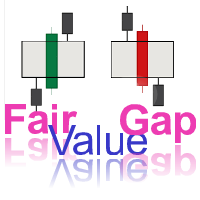
**Добавлено к основному тексту:**
Этот индикатор (Fair Value Gap - FVG) также **обладает функцией**, позволяющей отображать **несколько таймфреймов** по вашему выбору **одновременно на одном графике**. Эта возможность помогает выявлять **более сильные и точные сигналы**, так как вы можете анализировать ценовые разрывы (Gaps) на разных таймфреймах, что способствует принятию более обоснованных торговых решений.
Например, если вы обнаружили бычий FVG на **1-часовом таймфрейме**, и он также п
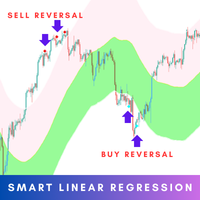
The Smart Linear Regression indicator is a powerful, non-repainting tool designed for traders looking for enhanced accuracy in market analysis. Unlike the typical linear regression channels that often repaint, this indicator provides reliable insights without changing past values, making it more trustworthy for forecasting future price movements. MT5 Version - https://www.mql5.com/en/market/product/124894/ Overview: The Smart Linear Regression Indicator goes beyond the basic linear regression c

Description : In the world of trading, candlestick patterns are a popular technical analysis tool used by many traders. There are numerous candlestick patterns, ranging from reversal patterns to continuation patterns. However, remembering all these patterns can be challenging, especially for novice traders. This often leads to traders having to manually memorize and identify candlestick patterns, which can be time-consuming and prone to errors. Candle Pattern Pro is a powerful indicator design

# Индикатор Гармонических Паттернов
Этот индикатор позволяет вручную определять ближайшие гармонические паттерны на графике. С его помощью вы можете легко настраивать параметры, создавать собственные паттерны и видеть ценовые расстояния между ключевыми точками.
---
## **Основные Возможности Индикатора**
1. **Идентификация Гармонических Паттернов** - Распознает популярные модели: **ABCD, Гартли (Gartley), Летучая мышь (Bat), Бабочка (Butterfly), Краб (Crab) и Акула (Shark)**.
WayAlarmPoint — это индикатор для платформы MetaTrader 4, который предоставляет различные способы оповещения о движении цены в любом направлении. Его простой функционал позволяет выбрать нужный звук для заданного направления и установить индивидуальное расстояние в пунктах для каждой стороны движения цены. Кроме того, индикатор точно укажет время достижения цели.
Этот индикатор идеально подходит для тех, кто хочет заниматься своими делами, но при этом не терять контроль над ситуацией на рынке.

WayAlarmPrice является индикатором для платформы MetaTrader 4. Он предлагает разнообразные способы оповещения о движении цены в любом направлении.
Этот простой в использовании индикатор позволяет выбрать подходящий звук для каждого направления и установить индивидуальное расстояние до конкретной цены для каждой стороны движения. Кроме того, он точно определяет время достижения цели. Чтобы начать работу с индикатором, просто поместите его в папку с индикаторами вашего терминала MetaTrader 4, зат

Order blocks are essential structures in trading that indicate areas where large institutional traders, like banks and hedge funds, have placed their orders. These blocks represent significant price levels where substantial buying or selling activity has occurred, providing clues about potential market movements. So, why should you, as a trader, care about order blocks? Well, knowing where these big orders are placed can give you a huge advantage. It’s like having a map showing where the treasur

Pattern Searching: Smart, Precise, & Customizable for MT4! Are you looking for a powerful tool to quickly and accurately identify trading patterns in Forex? This advanced indicator for MetaTrader 4 (MT4) is exactly what you need! Key Features That Will Amaze You: Automatic Classic Pattern Detection: This indicator automatically finds the closest classic Forex patterns for you. Whether you're looking for Smart Money Concepts (SMC) or NDS strategies, this tool covers it all! * Popular patt

江恩理论 江恩理论是金融市场分析中的一种重要工具,它基于市场周期性和自然法则的假设,通过特定的技术分析工具来预测市场走势。江恩理论的主要内容包括: 市场周期 :江恩认为市场存在周期性波动,这些周期可以通过特定的时间周期和价格周期来识别。 价格和时间 :江恩理论强调价格和时间之间的相互作用,认为两者是市场分析的关键要素。 江恩角度线 :这是江恩理论中的一种重要技术分析工具,用于识别市场的支撑和阻力水平。 江恩轮中轮 :又称“江恩圆形图”,是江恩发明的另一种重要技术分析工具,用于预测市场的未来走势。 量化分析 :T3指标可能通过特定的数学模型或算法来量化市场的行为或特征。 趋势识别 :T3指标可能用于识别市场的趋势方向,包括上升趋势、下降趋势或横向整理。 交易信号 :基于T3指标的分析,投资者可能能够获得买入或卖出的交易信号。

Pivot Point Indicator for MetaTrader 4 (MT4) Overview The Pivot Point Indicator calculates daily, weekly, and monthly pivot points and plots key support and resistance levels on your charts. This indicator helps traders identify potential reversal points and key areas of interest for price action, making it a valuable tool for both short-term and long-term trading strategies. Key Features Daily, Weekly, and Monthly Pivot Points : Easily switch between daily, weekly, and monthly pivot points by a

Simple ATR Stop Loss : Ваш компас волатильности рынка , который помогает вам ориентироваться в бурных водах трейдинга , устанавливать более умные Stop Loss и выглядеть как ниндзя трейдинга (плащ не включен). Внимание, все любители трейдинга и знатоки рынка! Представляем индикатор Simple ATR Stop Loss – вашего нового лучшего друга в диком мире торговли. Он проще, чем головоломка из двух частей , но мощнее, чем кофеиновый бык в посудной лавке. Шпаргалка по торговле с ATR (или Ка
FREE

MASTER MA - это индикатор, основанный на пересечении скользящих средних, использующий 3 скользящие средние с разными периодами пересечения для генерации сигналов, стратегия очень проста, но у индикатора есть панель статистики, которая показывает полезные результаты мгновенных обратных тестов, такие как коэффициент выигрыша / общая выигранная прибыль ... и т.д., У этого индикатора есть входные значения TP и SL в пунктах, поэтому вы можете отображать желаемые TP и SL на графике в виде зеленой точ

Crypto_Forex Indicator HTF Ichimoku для MT4.
- Индикатор Ichimoku - один из самых мощных трендовых индикаторов. HTF означает - Higher Time Frame. - Этот индикатор отлично подходит для трендовых трейдеров, а также в сочетании с входами Price Action. - Индикатор HTF Ichimoku позволяет прикрепить Ichimoku с более высокого таймфрейма к текущему графику. - Восходящий тренд - красная линия над синей (и обе линии над облаком) / Нисходящий тренд - красная линия под синей (и обе линии под облаком). - О
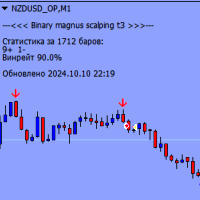
Binary Magnus Scalping T3 - это индикатор для бинарных опционов, который работает на любом таймфрейме и с любой валютной парой. Использует кластерный анализ для выявления точек входа и выдает оповещение в виде всплывающего окна и буферной стрелки на графике красного либо синего цвета перед закрытием текущей свечи. Основные особенности индикатора: Работает на любом таймфрейме (M1, M5, M15, M30, H1, H4, D1) Поддерживает любые валютные пары Экспирация от 1 до 3 свечей (по умолчанию 1 свеча) Проводи

ATR Pyramid ️: Ваш билет к прибылям, растущим выше, чем башня Дженга на стероидах , превращающий волатильность рынка в сёрфинг по трендам ️ и вечеринку с добавлением позиций , где только первая сделка рискует обвалом , в то время как вы защищаете остальные, поднимая стоп-лосс, как на лифте , создавая зону комфорта – единственный реальный путь к умножению вашего форекс-счета быстрее, чем кролик на эспрессо!!! Внимание всем накопителям прибыли и сёрферам трендов! ️ Этот
FREE

Alpha Trend sign - это мой давний и очень популярный торговый инструмент, который проверяет нашу торговую систему и четко сигнализирует о транзакциях, которые не дрейфуют.
Основные функции:
• В зависимости от того, показывает ли рынок активную область, показатели могут быть очень интуитивными, чтобы определить, является ли текущая конъюнктура трендовой или шоковой.
И в соответствии с индикатором стрелка врезается на рынок, зеленая стрела подсказывает купить, красная стрела подсказывает

Индикатор предназначен для отображения ключевых ценовых диапазонов на графике и анализа динамики рынка в установленных пределах. Он использует параметр Period = 1200 , что означает расчет данных на основе 1200 свечей или баров для формирования и отображения диапазона. Этот период подходит для долгосрочных трендов и позволяет выявлять важные уровни поддержки и сопротивления. Функция Alert = true активирует звуковое или визуальное уведомление при достижении ценой границ диапазона или при пробое кл

Scalper Inside Volume Pro — это профессиональная торговая система, которая объединяет множество индикаторов для расчёта общего составного сигнала. В её основе лежит алгоритм, ориентированный на объёме, индексе денежного потока и концепции Smart Money. Индикатор учитывает структурные точки Swing, в которых происходит разворот цены. Scalper Inside Volume Pro предоставляет все необходимые инструменты для успешного скальпинга. Эта полноценная торговая система подходит как для трейдеров на рынке Фор

MTF (Multi-Timeframe) Countdown Timer индикатор, разработанный для MetaTrader 4 (MT4). Индикатор отображает оставшееся время до появления новых свечей на нескольких таймфреймах, а также другую важную торговую информацию, такую как серверное время, местное время и спред пользовательских валютных пар. Особенности: Мульти-таймфреймный обратный отсчет : Показывает оставшееся время до следующей свечи на шести настраиваемых таймфреймах, таких как M5, H1 или D1. Настраиваемый внешний вид : Можно персон
FREE

L'indicatore QuantumBlocks è uno strumento avanzato progettato per i trader che desiderano identificare con precisione zone di accumulazione o distribuzione nel mercato, comunemente note come "Order Blocks". Questi livelli rappresentano aree chiave dove istituzioni finanziarie o trader di grande volume piazzano i loro ordini, influenzando pesantemente il movimento dei prezzi. Funzionalità principali: Identificazione automatica dei blocchi di ordini rialzisti e ribassisti : L'indicatore scansion

This indicator is based on the strategy shared by TheMas7er on his youtube channel.
The IDR/DR range will help you identify the high and low of the day once a candle closes above or below the the DR levels.
The IDR/DR range is determined 1 hour after session open, 09:30 am est.
I have incorporated the fibonacci tool to help you mark the retracement for a good entry in the premium or discount zone.
Important
This indicator is designed for the indices and M5 timeframe, but you are welcome to

The indicator is based on the calculation of liquidity on the market and thus shows where the market can most likely turn.. It shows the places of liquidity where the price will reach sooner or later... The indicator can be set to several types of liquidity and therefore can display several levels on the graph.. It is a unique tool that can help you very well in your trading The indicator is suitable for currency pairs with the most liquidity (Forex,Crypto...)

Unveil Market Secrets with Sneaky Busters on MetaTrader 4! Delve deeper into the intricate world of trading with the Sneaky Busters indicator, specifically crafted to spotlight the sophisticated maneuvers of smart money and uncover hidden market trends. Comprehensive Features: 1. Smart Money Accumulation & Distribution Detection: Accurate Analysis: Identify key zones where smart money collects and disperses assets. These insights help you understand market sentiment and potential turning points.
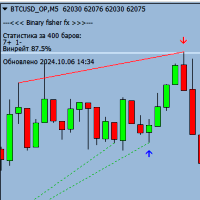
Binary Fisher FX - это мощный индикатор для бинарных опционов, который работает на любом таймфрейме и с любой валютной парой. Этот индикатор предназначен для выявления трендовых движений и указывает на входные точки в виде стрелки перед закрытием текущей свечи. Основные особенности индикатора: Работает на любом таймфрейме (M1, M5, M15, M30, H1, H4, D1) Поддерживает любые валютные пары Экспирация от 1 до 3 свечей (по умолчанию 1 свеча) Указывает на входные точки в виде стрелки перед закрытием тек
FREE
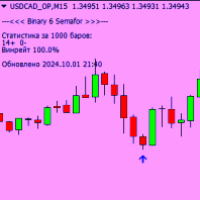
Binary 6 Semafor - у ниверсальный индикатор бинарых опционов для MetaTrader 4. -Работает на любом таймфрейме и валютной паре -Точное обнаружение точки входа -Сигнал на графике появляется перед закрытием текущей свечи -Экспирация 1 свеча -Буферные стрелки для входа -Отображение статистики для текущего актива
Результаты тестов:
Индикатор прошел тесты с впечатляющей доходностью, демонстрируя свою эффективность в различных рыночных условиях. Он идеально подходит для трейдеров, которые хотят макс
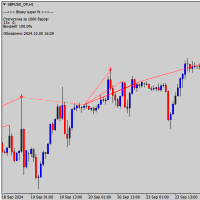
Binary Super FX для MetaTrader 4 - это мощный осциллятор для торговли бинарными опционами. Он может быть использован на любом таймфрейме и на любой валютной паре. Индикатор Binary Super FX выдает точные сигналы на вход в виде буферных стрелок перед закрытием свечи, с экспирацией 1 свеча. Это позволяет трейдерам принимать быстрые и информированные решения о входе в сделку. Важно отметить, что перед покупкой индикатора рекомендуется протестировать его на демо счете, чтобы убедиться в его эффективн
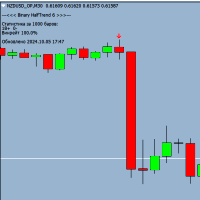
Binary HalfTrend 6 это мощный трендовый индикатор предназначен для торговли бинарными опционами, обеспечивая точные сигналы на покупку и продажу. Срок экспирации только 1 свеча, вы можете торговать на любом таймфрейме. Индикатор Binary HalfTrend 6 анализирует рыночные тренды и генерирует надежные сигналы в виде стрелок на графике для прибыльных торгов. Перед использованием его в живой торговле рекомендую протестировать на демо счете, чтобы выбрать наиболее прибыльные валютные пары для работы.

Trading System Double Trend - самостоятельная торговая ситема, состоящая из нескольких индикаторов. Определяет направление общего тренда и дает сигналы в направлении движения цены.
Можно использовать для скальпинга, торговли внутри дня или недели.
Возможности
Работает на любых тайм-фреймах и торговых инструментах(форекс, криптовалюты, металлы, акции, индексы.) Простое визуальное чтение информации не загружающей график Индикатор не перерисовывается и не достраивает сигналы Работает только по з

Откройте для себя расширенные торговые возможности на рынке NASDAQ 100 с помощью NASDAQ Smart Indicator. NASDAQ Smart Indicator — это мощный и эффективный инструмент для торговли на рынке NASDAQ 100. Этот индикатор специально разработан для временных интервалов в 1 и 5 минут и работает с высокой точностью и профессионализмом. Вы можете легко активировать его и использовать все его преимущества. Основные характеристики: Оптимальная производительность на 1-минутных и 5-минутных таймфреймах: Этот и

CCI Divergence Scanner Dashboard for MT4 — это мощный инструмент, предназначенный для помощи трейдерам в определении бычьих и медвежьих дивергенций на основе индикатора CCI (Commodity Channel Index) на нескольких валютных парах и таймфреймах. Он упрощает процесс анализа, непрерывно сканируя рынок и отображая возможности прямо на интуитивно понятной панели. С помощью оповещений в реальном времени, настраиваемых параметров и быстрой навигации по графикам трейдеры могут находить высоковероятностные

Support Resistance Whisperer — это мощный инструмент, призванный помочь трейдерам определить важные уровни поддержки и сопротивления на рынке. Этот индикатор использует ценовое действие для динамического рисования красных линий сопротивления и зеленых линий поддержки на вашем графике, предлагая четкое и наглядное представление ключевых ценовых зон, где могут произойти потенциальные развороты или прорывы рынка. В отличие от традиционных методов, которые полагаются на фракталы, этот индикатор из
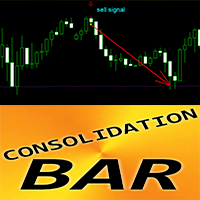
Индикатор Crypto_Forex Consolidation Bar Pattern для MT4.
- Индикатор "Consolidation Bar" - очень мощный индикатор, ориентированный на прорывы, для торговли по ценовому действию. - Индикатор определяет консолидацию цены в узкой области в течение 1 бара и показывает: направление прорыва, местоположение отложенного ордера и местоположение SL. - Бычий консолидационный бар - сигнал синей стрелки на графике (см. рисунки). - Медвежий консолидационный бар - сигнал красной стрелки на графике (см. рису

Трендовый индикатор Fxcycle - точная торговля для стабильной прибыли
Версия: 1.00 Авторские права: Fxcycle
Fxcycle Trend Indicator - это мощный инструмент следования за трендом, призванный помочь трейдерам с легкостью определять направление движения рынка. Созданный для трейдеров с любым уровнем опыта, этот индикатор дает точные сигналы на покупку и продажу, основанные на передовом анализе тренда, что делает его идеальным инструментом для тех, кто стремится максимизировать свою прибыль на рын
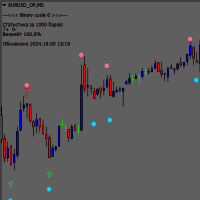
Индикатор Binary Cucle 6 - это мощный осциллятор для торговли бинарными опционами на платформе MetaTrader 4. Он предназначен для работы на таймфреймах от M5 и выше, а также может быть использован на любой валютной паре. Индикатор Binary Cucle 6 выдает точные сигналы для входа в сделку в виде стрелок синего и красного цвета, которые появляются на графике перед закрытием текущей свечи. Это позволяет трейдерам принимать быстрые и информированные решения о входе в сделку. Важно отметить, что сигнал

### **FxCycle WaveSignal Indicator**
Индикатор **FxCycle WaveSignal** - это идеальное решение для трейдеров, желающих определить сильные и точные торговые возможности, используя подход **волновой модели** в сочетании с **экспоненциальными скользящими средними (EMA)**. Индикатор разработан для обеспечения четких сигналов **покупки** и **продажи** на основе движения цены вокруг **верхней** и **нижней волновой линии**, а также представляет привлекательное визуальное отображение непосредственно на

The Area of Interest (AOI) Indicator is a powerful tool designed to help traders identify key market zones where price reactions are highly probable. This indicator specifically highlights two critical zones: Seller AOI (Area of Interest) : This zone represents areas where sellers are likely to enter the market, often acting as resistance. When the price approaches or touches this zone, it signals that a potential sell-off could occur. Buyer A OI (Area of Interest) : The BOI zone identifies re
FREE

Advanced Reversal Hunter Pro (ARH) -это мощнейший,инновационный индикатор импульсов,основанный на волатильности.Предназначенный для точного определения ключевых разворотов тренда . Разработанный с использованием специального алгоритма, который обеспечивает четкое построение диапазона средней волатильности, без перерисовки своих значений и их не меняет. Индикатор подстраивается под любую волатильность рынка и динамически корректирует ширину диапазона полос, в зависимости от текущих рыночных ус

Introducing Order Blocks Breaker , a brand-new way to identify and leverage order blocks in your trading strategy. After developing multiple order block tools with unique concepts, I’m proud to present this tool that takes things to the next level. Unlike previous tools, Order Blocks Breaker not only identifies order blocks but also highlights Breaker Order Blocks —key areas where the price is likely to retest after a breakout. MT5 - https://www.mql5.com/en/market/product/124102/ This tool inco
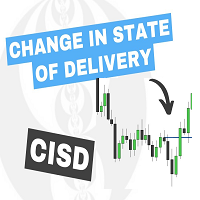
The Change In State Of Delivery (CISD) indicator detects and displays Change in State Of Delivery, a concept related to market structures.
Users can choose between two different CISD detection methods. Various filtering options are also included to filter out less significant CISDs.
USAGE Figure 2 A Change in State of Delivery (CISD) is a concept closely related to market structures, where price breaks a level of interest, confirming trends and their continuations from the resulting
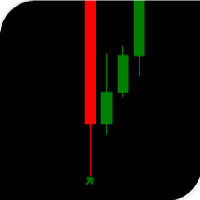
Стрелочный индикатор без перерисовки показывают потенциальные точки входа в рынок в виде стрелок соответствующего цвета: стрелки вверх (обычно зеленые) предлагают открыть покупку, красные стрелки вниз – продажу. Появление стрелок может сопровождаться звуковыми сигналами. Обычно предполагается вход на следующем баре после указателя, но могут быть и нестандартные рекомендации. Стрелочные индикаторы визуально «разгружают» ценовой график и экономят время анализа: нет сигнала – нет сделки, если появи

Live Signal: Click One
Have you ever wondered why most systems are not effective in live trading? My answer is that it's all the fault of the so-called "Smart Money" or the institutional ones,, they constantly create spikes first up then down and vice versa to screw all the retail investors by tearing away their capital, confusing them and making the markets move randomly without any rules. But in all this there is a famous strategy, which in 2009 won the world championship, exploiting and r
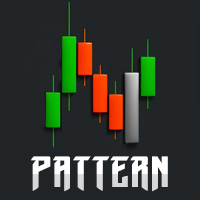
About:
Looks for price making a trend flip pattern. Importance of this pattern is that after it happens, price tends to range a bit and then breakout right after.
Features:
Looks for trend flip pattern Num of bars creating pattern Extend lines to right to wait for breakout Bull/Bear Strength for candles making the pattern Filter using Halftrend/NRTR
How it Works:
Use this technique for scalping. After a pattern happens, you will see a red/green rectangle. Red means a Bearish pattern and green
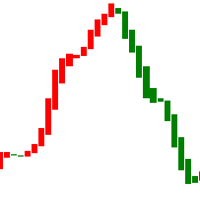
This is an indicator that tracks price trends and can alert traders when the market exhibits abnormalities. The indicator chart is marked with red and green colors. The background color of the chart is white and cannot be modified to other background colors. When the indicator color changes from red to green, it means that the market price has paused or even reversed. This is a reminder to traders of the possibility of short orders. When the indicator color changes from green to red, it means t
the indicator presents three supertrends that identify a possible trend for the day and places possible entry flags when they are aligned, audible and visual alarms available, usable on all timeframes, ability to customize trends, colors, and time filter.
each asset needs its own specific supertrends, indicator has standard trends that can be used on M5

Indicator description: The Ratel Strength indicator is mainly used to determine the strength of long and short trends and give reference signals for buying and selling points. It is suitable for gold, foreign exchange, digital currencies, etc. Indicator parameters: Proid:14 B/S signal reversal deviation value: 1.00
Display B/S signal: TRUE Up trend signal color: clrLightSeaGreen Down trend signal color: clrRed Indicator usage:
Above the 0 axis of the column, long position are relatively strong

The script tries to determine the overall direction of the market, using smoothed Heiken Ashi candles. The coloring system (using bright and dark colors) is an attempt to detect strong market and weak market conditions. There's also an oscillator within the script
These are the features: Alert condition Features: You can now set alerts in the alert dialog for events like trend switch, trend strengthening and weakening; all for both Bullish and Bearish trend.
I also added the code for custom a
FREE

Detailed post explained:
https://www.mql5.com/en/blogs/post/759269
This is a slope indicator for Bollinger Bands indicator. It provides slopes for BB top band, center band (main) and Lower Band. You can also set a threshold value for Center line to control Red/Green slope histogram lines. Settings:
You can choose which line you need the slope and Threshold Alerts for in Drop down.
Slope Thresholds: for Alerts. Please note that Alerts only happen when Threshold is crossed. e.g.: If Threshold
FREE

Advancing in NASDAQ 100 Trading with the Smart "Candle Color" Indicator The indicator we offer is one of the good tools for trading in the NASDAQ 100 market, especially in the 1-minute and 5-minute timeframes. This indicator is designed with precision and scientific rigor and can also be used in other timeframes. All you need to do is activate it and leverage its power. Unique Features: Optimized Performance in 1-Minute and 5-Minute Timeframes: This indicator is specifically designed for these

Magic Moving AI The Magic Moving AI indicator is one of the best tools for trading in the NASDAQ 100 market. This tool is specifically designed for the 1-minute and 5-minute timeframes and operates with high precision. You can easily activate this indicator and benefit from its advantages. Unique Features: Specialized Performance in 1-Minute and 5-Minute Timeframes: While this indicator is capable of working in other timeframes, its primary focus is on these two timeframes to deliver optimal re

The indicator now available to you is one of the best tools for trading in the NASDAQ 100 market, particularly in the 1-minute and 5-minute timeframes. This tool is designed with precision and can also be used for other timeframes. All you need to do is activate it. Key Features: Specialized Performance in 1-Minute and 5-Minute Timeframes: While this indicator can work in other timeframes, it delivers optimal results in these two timeframes. Compatibility with the NASDAQ 100 Secret Strategy: Th
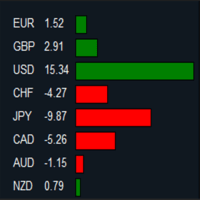
MT5 Version: https://www.mql5.com/en/market/product/124136 Imagine you’re at the helm of your trading terminal, scanning charts of various currency pairs, trying to figure out which ones are strong, which ones are weak, and where the real opportunities lie. It’s a lot to process—flipping between charts, calculating movements, and comparing performance. But what if all of that could be done for you, neatly displayed in one place? That’s where this Forex Strength Dashboard comes in. Picture thi
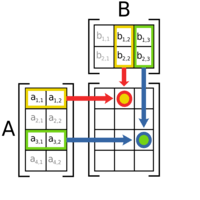
MT5 Version: https://www.mql5.com/en/market/product/124107 A Day in the Life of a Trader: Discovering the Forex Matrix Dashboard In the fast-paced world of forex trading, keeping track of multiple currency pairs can feel overwhelming. That’s where the Forex Matrix Dashboard comes in, making the life of a trader much easier. Imagine opening the dashboard and instantly seeing all your favorite currency pairs, like EUR/USD, GBP/USD, and USD/JPY, displayed clearly with their latest prices. No mo
MetaTrader Маркет - единственный магазин, где можно скачать демоверсию торгового робота и подвергнуть его проверке и даже оптимизации на исторических данных.
Прочитайте описание и отзывы других покупателей на заинтересовавший вас продукт, скачайте его прямо в терминал и узнайте, как протестировать торгового робота перед покупкой. Только у нас вы можете получить представление о программе, не заплатив за неё.
Вы упускаете торговые возможности:
- Бесплатные приложения для трейдинга
- 8 000+ сигналов для копирования
- Экономические новости для анализа финансовых рынков
Регистрация
Вход
Если у вас нет учетной записи, зарегистрируйтесь
Для авторизации и пользования сайтом MQL5.com необходимо разрешить использование файлов Сookie.
Пожалуйста, включите в вашем браузере данную настройку, иначе вы не сможете авторизоваться.