YouTubeにあるマーケットチュートリアルビデオをご覧ください
ロボットや指標を購入する
仮想ホスティングで
EAを実行
EAを実行
ロボットや指標を購入前にテストする
マーケットで収入を得る
販売のためにプロダクトをプレゼンテーションする方法
MetaTrader 4のための新しいテクニカル指標 - 33

Crypto_Forex インジケーター HTF Ichimoku for MT4。
- Ichimoku インジケーターは、最も強力なトレンド インジケーターの 1 つです。HTF は、Higher Time Frame を意味します。 - このインジケーターは、トレンド トレーダーや、プライス アクション エントリとの組み合わせに最適です。 - HTF Ichimoku インジケーターを使用すると、より高い時間枠の Ichimoku を現在のチャートに添付できます。 - 上昇トレンド - 赤い線が青い線より上 (両方の線が雲より上) / 下降トレンド - 赤い線が青い線より下 (両方の線が雲より下)。 - 価格が Ichimoku 雲の上部境界を突破した場合にのみ、買い注文を開きます。 - 価格が Ichimoku 雲の下部境界を突破した場合にのみ、売り注文を開きます。 - HTF Ichimoku インジケーターを使用すると、大きなトレンドを捉える機会が得られます。
高品質のトレーディングロボットとインジケーターをご覧になるにはここをクリックしてください! これは、この M
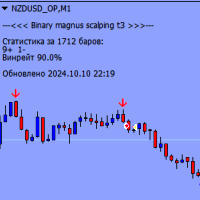
Binary Magnus Scalping T3 は、あらゆる時間枠および通貨ペアで機能するバイナリー オプション インジケーターです。クラスター分析を使用してエントリーポイントを特定し、現在のローソク足が閉じる前に、ポップアップウィンドウと赤または青のチャート上のバッファ矢印の形式でアラートを発行します。
インジケーターの主な特徴:
あらゆる時間枠で動作します (M1、M5、M15、M30、H1、H4、D1) あらゆる通貨ペアをサポート 有効期限は 1 ~ 3 キャンドル (デフォルトは 1 キャンドル) クラスター分析を実行してエントリーポイントを特定します 現在のローソク足が閉じる前に、ポップアップ ウィンドウとチャート上に赤または青のバッファ矢印の形式でアラートを発行します 重要な情報:
インジケーターが正しく機能するには、ターミナルフォルダーに「MQL5」フォルダーをダウンロードしてインストールする必要があります。リンクからフォルダーをダウンロードできます: https://disk.yandex.ru/d/DPyo0ntaevi_2A ストラテジーテスターを使用し

ATR Pyramid ️: ステロイド注射されたジェンガの塔よりも高く利益を積み上げるチケット 、市場のボラティリティをトレンドサーフィン ️とポジション追加パーティー に変える、最初のトレードだけが大損のリスクがある中 、残りはストップロスをエレベーターのように上げて守り 、エスプレッソを飲んだウサギより速くあなたのフォレックス口座を増やす唯一の本当の方法となる快適ゾーンを作り出す!!! 利益積み上げ屋とトレンドサーファーの皆さん、注目! ️ この ATR Pyramid インジケーターは、金融ピラミッドを構築するのが好きな方々のためのものです(合法的なものだと約束します )。 ATRは市場のボラティリティしか示さないって言われてるの知ってる? でも、どんでん返し - それが全てじゃないんだ! この賢い小さなツールは、カフェイン中毒のブラッドハウンドより速くトレンドの方向を嗅ぎ分けられるんだ。 そして何を思う? 食べ放題バイキングのように、これを使って利益を積み上げているんだ。 ️ でも、まだあ
FREE
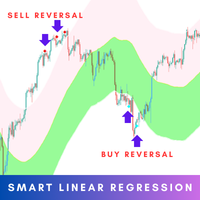
The Smart Linear Regression indicator is a powerful, non-repainting tool designed for traders looking for enhanced accuracy in market analysis. Unlike the typical linear regression channels that often repaint, this indicator provides reliable insights without changing past values, making it more trustworthy for forecasting future price movements. MT5 Version - https://www.mql5.com/en/market/product/124894/ Overview: The Smart Linear Regression Indicator goes beyond the basic linear regression c

Scalper Inside Volume Pro is a professional trading system that combines multiple indicators to calculate an overall composite signal. It is based on an algorithm focused on volume, the Money Flow Index, and the Smart Money concept. The indicator takes into account structural Swing points where price reversals occur. Scalper Inside Volume Pro provides all the necessary tools for successful scalping. This comprehensive trading system is suitable for traders in the Forex market as well as for use

MTF (Multi-Timeframe) Countdown Timer indicator, designed for MetaTrader 4 (MT4). The indicator displays the remaining time for new candles across multiple timeframes, along with other essential trading information such as server time, local time, and the spread of custom currency pairs. Features: Multi-Timeframe Countdown : Displays the time remaining for the next candle in up to six configurable timeframes, such as M5, H1, or D1. Customizable Appearance : Background, border, and text colors ca
FREE

The indicator is based on the calculation of liquidity on the market and thus shows where the market can most likely turn.. It shows the places of liquidity where the price will reach sooner or later... The indicator can be set to several types of liquidity and therefore can display several levels on the graph.. It is a unique tool that can help you very well in your trading The indicator is suitable for currency pairs with the most liquidity (Forex,Crypto...)
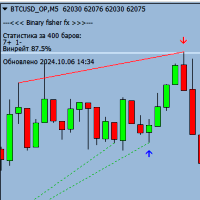
Binary Fisher FX は、あらゆる時間枠と通貨ペアで機能する強力なバイナリー オプション インジケーターです。このインジケーターはトレンドの動きを識別するように設計されており、現在のローソク足が閉じる前に矢印の形でエントリーポイントを示します。
インジケーターの主な特徴:
あらゆる時間枠で動作します (M1、M5、M15、M30、H1、H4、D1) あらゆる通貨ペアをサポート 有効期限は 1 ~ 3 キャンドル (デフォルトは 1 キャンドル) 現在のローソク足が閉じる前にエントリーポイントを矢印の形で示します トレンドに応じて機能するため、大きく変動する市場を特定できます。 重要な情報:
インジケーターが正しく機能するには、ターミナルフォルダーに「MQL5」フォルダーをダウンロードしてインストールする必要があります。リンクからインジケーターが含まれるフォルダーをダウンロードできます: https://disk.yandex.ru/d/DPyo0ntaevi_2A Binary Fisher FXインジケーターを使用する利点:
トレンドの動きを正確に特定することで
FREE
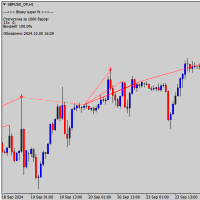
MetaTrader 4 の Binary Super FX は、バイナリー オプション取引用の強力なオシレーターです。あらゆる時間枠と通貨ペアで使用できます。
バイナリ スーパー FX インジケーターは、ローソク足を閉じる前にバッファ矢印の形で正確なエントリーシグナルを提供し、1 つのローソク足で満了します。これにより、トレーダーは取引への参加について、情報に基づいた迅速な決定を下すことができます。
インジケーターを購入する前に、デモ口座でテストして、その有効性とシグナルの正確性を確認することをお勧めします。これは、インジケーターのパフォーマンスを評価し、バイナリー オプション取引での使用について情報に基づいた決定を下すのに役立ちます。
バイナリースーパーFXインジケーターの主な利点:
シグナルの精度: このインジケーターは、市場のトレンドとパターンの分析に基づいて、取引に参加するための非常に正確なシグナルを提供します。 視覚的表示: シグナルはバッファー矢印として表示されるため、トレーダーはシグナルを迅速かつ簡単に識別できます。 柔軟性: このインジケーターは、任意の時間
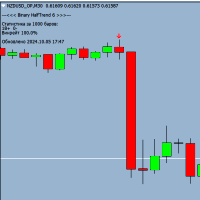
Binary HalfTrend 6 is a powerful trend indicator designed for binary options trading, providing accurate buy and sell signals. The expiration time is only 1 candle, you can trade on any timeframe. The Binary HalfTrend 6 indicator analyzes market trends and generates reliable signals in the form of arrows on the chart for profitable trades. Before using it in live trading, I recommend testing it on a demo account to choose the most profitable currency pairs for work.
Attention, for the indicato

Trading System Double Trend - 複数のインジケーターで構成された独立したトレーディングシステムです。全体的なトレンドの方向を判断し、価格変動の方向を示すシグナルを発します。
スキャルピング、日中取引、週次取引に使用できます。
機能
あらゆる時間枠と取引商品(FX、仮想通貨、貴金属、株式、指数)で動作します。 チャートをロードすることなく、情報を視覚的に簡単に確認できます。 インジケーターは再描画されず、シグナルも完了しません。 ローソク足が閉じた時のみ機能します。 シグナルには複数の種類のアラートがあります。 視覚的に理解しやすく、チャートに貼り付けて、シグナルのシンプルな推奨事項に従うだけです。
入力パラメータは、システム内のトレンドごとに設定されています。
General trend - 全体的なトレンドを判断します。 Signal trend - エントリーとエグジットのシグナルを発します。 Play sound / Display pop-up message / Send push notification / Send email -

CCI Divergence Scanner Dashboard for MT4 は、複数の通貨ペアとタイムフレームにわたるCCI(商品チャンネル指数)に基づく強気および弱気のダイバージェンスシグナルを効率的に検出するために設計された強力なツールです。市場を継続的にスキャンし、直感的なダッシュボードにチャンスを直接表示することで、分析プロセスを簡素化します。リアルタイムアラート、カスタマイズ可能な設定、スムーズなチャートナビゲーションにより、トレーダーは手動でチャートを切り替えることなく高確率のセットアップを特定できます。効率的に複数資産を監視したいトレーダーに最適です。 Key Features 複数通貨ペアスキャン:複数のシンボルをリアルタイムで監視し、即座にCCIダイバージェンスパターンを検出。 直感的なダッシュボード:強気と弱気の全ダイバージェンスシグナルを一目で確認可能。 過去シグナル分析:過去のダイバージェンスシグナルを分析して戦略を改善。 マルチタイムフレーム対応:異なる時間軸にわたってダイバージェンスを検出。 ワンクリックチャートナビゲーション:ダッシュボードからワンク

サポート レジスタンス ウィスパラーは、 トレーダーが市場で重要なサポート レベルとレジスタンス レベルを特定できるように設計された強力なツールです。このインジケーターは、価格アクションを使用してチャート上に赤いレジスタンス ラインと緑のサポート ラインを動的に描画し、潜在的な市場の反転やブレイクアウトが発生する可能性のある主要な価格帯を明確かつ視覚的に表示します。フラクタルに依存する従来の方法とは異なり、このインジケーターは、カスタマイズ可能なルックバック期間の最高価格と最低価格に基づいてサポートとレジスタンスを計算することで遅延を回避します。 主な特徴: ルックバック期間: LookbackPeriod パラメータを使用して、特定の数のローソク足の価格データを分析するようにインジケーターをカスタマイズします。これにより、トレーダーはサポート レベルとレジスタンス レベルの感度を微調整できます。 履歴データ分析: このインジケーターは、最大 500 個の履歴バー ( 履歴 パラメーターで調整可能) をスキャンして、市場価格の変動を包括的に分析できます。 SR 継続フィルター:
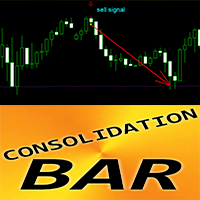
Crypto_Forex インジケーター MT4 用コンソリデーション バー パターン。
- インジケーター「コンソリデーション バー」は、価格アクション取引用の非常に強力なブレイクアウト重視のインジケーターです。 - インジケーターは、1 つのバーの間に狭い領域で価格コンソリデーションを検出し、ブレイクアウトの方向、保留中の注文の場所、および SL の場所を表示します。 - 強気コンソリデーション バー - チャート上の青い矢印信号 (画像を参照)。 - 弱気コンソリデーション バー - チャート上の赤い矢印信号 (画像を参照)。 - 再描画なし、遅延なし、高い R/R 比率 (報酬/リスク)。 - PC、モバイル、および電子メール アラート付き。 - インジケーター「コンソリデーション バー パターン」は、サポート/レジスタンス レベルと組み合わせるのに適しています。
高品質のトレーディングロボットとインジケーターをご覧になるにはここをクリックしてください! これは、この MQL5 Web サイトでのみ提供されるオリジナル製品です。

Fxcycle トレンドインジケータ - 安定した利益のための精密取引
バージョン: 1.00 著作権 Fxcycle
Fxcycleトレンドインジケータは、トレーダーが簡単に市場の方向性を識別できるように設計された強力なトレンドフォローツールです。あらゆる経験レベルのトレーダー向けに構築されたこのインジケータは、高度なトレンド分析に基づき、正確な売買シグナルを提供します。
主な特徴 正確なトレンド検出: 高度な移動平均アルゴリズムに基づき、Fxcycleは強気・弱気のトレンドを高精度で識別します。 カスタム・アラートと通知: 売買シグナルが検出されると、即座にデスクトップアラートとモバイルへのプッシュ通知を直接受信します。 マルチタイムフレームサポート: お客様の取引スタイルや戦略に合わせて、異なる時間枠(M15、H1、H4など)で動作するように設計されています。 視覚的シグナル: このインディケータは、売買シグナルをチャート上に明瞭な矢印で表 示し、より迅速で確実な意思決定を支援します。 洗練されたモダンなデザイン: Fxcycleのトレンドラインとシグナルは、洗練された視
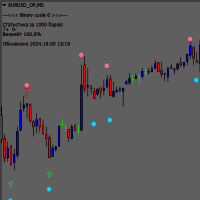
Binary Cucle 6 インジケーターは、MetaTrader 4 プラットフォームでバイナリー オプション取引を行うための強力なオシレーターであり、M5 以上のタイムフレームで動作するように設計されており、あらゆる通貨ペアでも使用できます。
Binary Cucle 6 インジケーターは、現在のローソク足が閉じる前にチャート上に表示される青と赤の矢印の形で取引にエントリーするための正確なシグナルを提供します。これにより、トレーダーは取引への参加について、情報に基づいた迅速な決定を下すことができます。
円や太い矢印の形の信号は正確ではなく、再描画される可能性があるため、考慮すべきではないことに注意することが重要です。スクリーンショットで丸で囲まれた矢印のみに主な注意を払う必要があります。これは、取引に参加するための信頼できる正確なシグナルです。
Binary Cucle 6 インジケーターの主な利点:
シグナルの精度: このインジケーターは、市場のトレンドとパターンの分析に基づいて、取引に参加するための正確なシグナルを提供します。 視覚的な表示: シグナルは青と赤の矢印

### FxCycle WaveSignal Indicator*** は、**指数移動平均**と組み合わせた**波動 パターン**のアプローチを使用して、強力で正確な取引機会を特定するトレー ダーに最適なソリューションです。
FxCycle WaveSignal Indicator**は、**指数移動平均(EMA)**と組み合わされた**波動パ ターン**のアプローチを使用して、強力かつ正確な取引機会を特定するトレー ダーにとって完璧なソリューションです。 このインディケータは、**上限波動ライン**と**下限波動ライン**を中心とした 価格の動きに基づいて、明確な**買い**と**売り**のシグナルを提供するよう に設計されており、チャートに直接魅力的なビジュアル表示を行います。
#### 主な機能:*** 1.
1. **正確な売買シグナルの検出。 - このインディケータは、**EMA** 計算を使用して、**上波動線** と**下波動線** を形成します。価格が波動線をブレイクすると、**買いシグナル**または**売りシグナル**が検出され、チャートに直接矢印で表

MASTER MAは、移動平均クロスベースのインジケータであり、異なる期間の3つの移動平均を使用してシグナルを生成し、戦略は非常にシンプルですが、インジケータには、勝率/総利益などの有用なインスタントバックテスト結果を示す統計ダッシュボードがあります...など、このインジケーターにはポイント単位でTPとSLの入力があるため、TPとSLをTPの緑の点とSLの赤いxの形でチャートに表示することができ、インジケーターはそれらの値を使用して勝敗率を計算します。
この指標は、新しいバーが厳密に開いているときに信号を送ります。信号が再描画されたり遅延したりすることはありません。
推奨事項:m5以上を使用してください...毎日の目標を持つ...インジケーターの期間をいじって、より良い結果を得てください。
パラメーター:
3つの移動平均の期間と種類
アラート
TP/SL値は、各シグナルとともにチャートに印刷し、以下に基づいて勝敗を計算します。
ダッシュボードの色と位置の入力
-------------------------------------------------------

The Area of Interest (AOI) Indicator is a powerful tool designed to help traders identify key market zones where price reactions are highly probable. This indicator specifically highlights two critical zones: Seller AOI (Area of Interest) : This zone represents areas where sellers are likely to enter the market, often acting as resistance. When the price approaches or touches this zone, it signals that a potential sell-off could occur. Buyer A OI (Area of Interest) : The BOI zone identifies re
FREE

Advanced Reversal Hunter Pro (ARH) is a powerful, innovative volatility-based momentum indicator designed to accurately identify key trend reversals. Developed using a special algorithm that provides a clear construction of the average volatility range, without redrawing its values and does not change them. The indicator adapts to any market volatility and dynamically adjusts the width of the band range, depending on current market conditions. Indicator advantages: Advanced Reversal Hunter Pro

Alpha Trend signは私たちの取引システムを検証し、取引信号を明確に提示し、信号がドリフトすることはありません。
主な機能:
•市場が活況を示している地域に応じて、指標に基づいて現在の相場がトレンド相場に属しているか、それとも揺れ相場に属しているかを直感的に判断することができる。
そして、指標の指示矢印に基づいて市場に切り込み、緑の矢印は購入を提示し、赤の矢印は販売を提示する。
•小周期変動による頻繁な取引信号の発生を回避するために、5分以上の時間周期で取引を行うことを推奨します。
•最適な取引タイミングを逃さないために、シグナルプロンプトをオンにすることもできます。
•本指標はトレンド相場をよく予測するだけでなく、幅広振動相場でも利益を得ることができる。
•本指標は大道至簡の原則に基づいており、異なる段階のトレーダーが使用するのに適している。
注意事項:
•Alpha Trend signには明確な入退場信号があり、損失を与えないように逆位相操作を提案しない。
•Alpha Trend signは特に成熟した指標であり、デルのチー

Introducing Order Blocks Breaker , a brand-new way to identify and leverage order blocks in your trading strategy. After developing multiple order block tools with unique concepts, I’m proud to present this tool that takes things to the next level. Unlike previous tools, Order Blocks Breaker not only identifies order blocks but also highlights Breaker Order Blocks —key areas where the price is likely to retest after a breakout. MT5 - https://www.mql5.com/en/market/product/124102/ This tool inco

The indicator is designed to display key price ranges on the graph and analysis of market dynamics within the established limits. It uses the parameter Period = 1200 , which means the calculation of data based on 1200 candles or bars to form and display the range. This period is suitable for long -term trends and allows you to identify important levels of support and resistance.
The Alert = True function activates a sound or visual notice when reached the price of the boundaries of the range o

Live Signal: Click One
Have you ever wondered why most systems are not effective in live trading? My answer is that it's all the fault of the so-called "Smart Money" or the institutional ones,, they constantly create spikes first up then down and vice versa to screw all the retail investors by tearing away their capital, confusing them and making the markets move randomly without any rules. But in all this there is a famous strategy, which in 2009 won the world championship, exploiting and r
About:
Looks for price making a trend flip pattern. Importance of this pattern is that after it happens, price tends to range a bit and then breakout right after.
Features:
Looks for trend flip pattern Num of bars creating pattern Extend lines to right to wait for breakout Bull/Bear Strength for candles making the pattern Filter using Halftrend/NRTR
How it Works:
Use this technique for scalping. After a pattern happens, you will see a red/green rectangle. Red means a Bearish pattern and green
the indicator presents three supertrends that identify a possible trend for the day and places possible entry flags when they are aligned, audible and visual alarms available, usable on all timeframes, ability to customize trends, colors, and time filter.
each asset needs its own specific supertrends, indicator has standard trends that can be used on M5

Indicator description: The Ratel Strength indicator is mainly used to determine the strength of long and short trends and give reference signals for buying and selling points. It is suitable for gold, foreign exchange, digital currencies, etc. Indicator parameters: Proid:14 B/S signal reversal deviation value: 1.00
Display B/S signal: TRUE Up trend signal color: clrLightSeaGreen Down trend signal color: clrRed Indicator usage:
Above the 0 axis of the column, long position are relatively strong
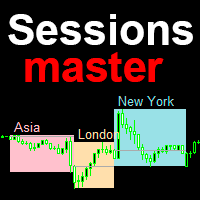
Session master - индикатор торговых сессий с расширенными возможностями. По умолчанию отображает Азиатскую, Лондонскую и Нью Йоркскую сессии, с возможностью самостоятельно настроить каждую сессию индикатора под свою торговлю. Описание Отображает прямоугольной областью заданный период в часах дня Максимум и минимум сессии соответствуют максимам и минимумам прямоугольных областей сессий Индивидуальная настройка для каждой сессии, имя, цвет, период в часах Автоматически переводит время сессий зада

L'indicatore QuantumBlocks è uno strumento avanzato progettato per i trader che desiderano identificare con precisione zone di accumulazione o distribuzione nel mercato, comunemente note come "Order Blocks". Questi livelli rappresentano aree chiave dove istituzioni finanziarie o trader di grande volume piazzano i loro ordini, influenzando pesantemente il movimento dei prezzi. Funzionalità principali: Identificazione automatica dei blocchi di ordini rialzisti e ribassisti : L'indicatore scansion

This indicator is based on the strategy shared by TheMas7er on his youtube channel.
The IDR/DR range will help you identify the high and low of the day once a candle closes above or below the the DR levels.
The IDR/DR range is determined 1 hour after session open, 09:30 am est.
I have incorporated the fibonacci tool to help you mark the retracement for a good entry in the premium or discount zone.
Important
This indicator is designed for the indices and M5 timeframe, but you are welcome to

Want to create an Expert Advisor (EA) using an indicator that doesn’t store the required data in a buffer (visible in the Data Window) and only draws objects on the chart? This solution captures chart objects and places them into buffers, allowing you to create an EA—whether you're using EA Builder Pro or writing code with iCustom—by selecting the correct values using those buffers (modes). It works with any object visible in the Object List that has a unique Name or Description, such as: Trend

Unveil Market Secrets with Sneaky Busters on MetaTrader 4! Delve deeper into the intricate world of trading with the Sneaky Busters indicator, specifically crafted to spotlight the sophisticated maneuvers of smart money and uncover hidden market trends. Comprehensive Features: 1. Smart Money Accumulation & Distribution Detection: Accurate Analysis: Identify key zones where smart money collects and disperses assets. These insights help you understand market sentiment and potential turning points.
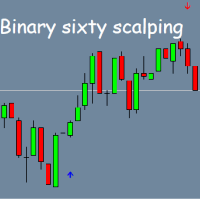
Binary Sixty Scalping – MT4のバイナリーオプション用インジケーター Binary Sixty Scalpingは、MT4プラットフォーム用のバイナリーオプション取引専用のインジケーターです。どの時間枠でも機能しますが、精度を高めるためにはM5以上の時間枠の使用が推奨されます。インジケーターはすべての通貨ペアに対応し、さまざまな市場に適応できます。 主な特徴: デフォルトの有効期限 – 1キャンドル (設定で変更可能); トレンドに基づく取引 :インジケーターはトレンドの方向を分析し、最適なエントリーポイントを見つけてシグナルを出します; キャンドルが閉じる前の正確なシグナル :チャート上に矢印を表示し、青は買い、赤は売りを示します; シグナルの統計 :シグナルの成功率の統計を表示し、インジケーターの効果を評価するのに役立ちます; 再描画なし :信頼性と安定性のあるシグナルを提供します。 インストールガイド: 正しく動作させるために、"MQL5"フォルダーをターミナルのルートフォルダーにコピーします。ファイルのダウンロードはこちら: Yandex Disk 。
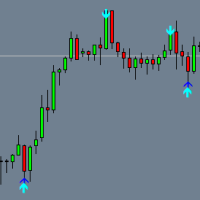
MT4用Binary DUNKS Binary DUNKSは、バイナリーオプション取引のための高い勝率を誇るインジケーターで、M5以上のタイムフレームとあらゆる通貨ペアで効果的に機能します。 満期: デフォルトでは1本のローソク足に設定されていますが、設定で変更可能です。 シグナル: 矢印で表示されます:
赤い矢印 — 売りシグナル。
青い矢印 — 買いシグナル。
取引は、ローソク足の上または下に2つの矢印(確認)がある場合のみ推奨されます。 統計: グラフにはシグナルの成功率に関する統計が表示され、リアルタイムでインジケーターの有効性を分析できます。 インストール方法:
インジケーターを正しく動作させるには、「MQL5」フォルダをターミナルのディレクトリにコピーしてください。 ここ からダウンロード 。
インストール手順: 動画 を見る 。 追加情報:
シグナルが表示された際にポップアップ通知を受け取るには、 追加 のインジケーター をご利用ください。
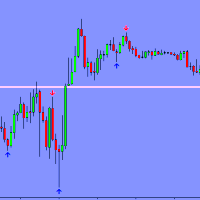
バイナリー クレーターは、バイナリー オプション取引専用に設計された MetaTrader 4 の強力で多用途なインジケーターです。どの時間枠でもどの通貨ペアでも効果的に機能するため、トレーダーにとって非常に柔軟なツールとなります。
主な特徴:
トレンド分析: このインジケーターは市場の現在のトレンドを自動的に判断するため、トレーダーがトレンドの方向に沿って取引を開始できるようになり、取引が成功する可能性が高まります。
シグナルの発行: このインジケーターは、取引へのエントリーの可能性を示すバッファー矢印を生成します。上矢印は買いシグナルを示し、下矢印は売りシグナルを示します。
1 キャンドル満期: このインジケーターは、シグナルを 1 つのキャンドル満期に使用できるため、短期取引に最適です。
汎用性: このインジケーターはあらゆる時間枠と通貨ペアに適用できるため、さまざまな戦略や好みを持つトレーダーにとって役立ちます。
使いやすさ: このインジケーターはインストールと使用が簡単で、あらゆるレベルのトレーダーが利用できます。
あらゆる利点があるにもかかわらず、バイナリー
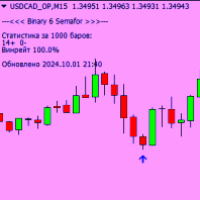
Binary 6 Semafor は、MetaTrader 4 のユニバーサル バイナリー オプション インジケーターです。
- あらゆる時間枠と通貨ペアで動作します
- エントリーポイントの正確な検出
- 現在のローソク足が閉じる前にシグナルがチャートに表示されます
-有効期限1キャンドル
- 入力用のバッファ矢印
- 現在の資産の統計を表示します
テスト結果:
このインジケーターは素晴らしいリターンでテストに合格し、さまざまな市場状況での有効性を実証しています。利益を最大化し、リスクを最小限に抑えたいトレーダーにとって理想的です。
注意、インジケーターが正しく動作するには、ターミナルフォルダーに「MQL5」フォルダーを配置する必要があります。以下のリンクからダウンロードできます: https://disk.yandex.ru/d/DPyo0ntaevi_2A
注記:
この指標は利益を保証するものではなく、適切なリスク管理と併せて使用する必要があります。実際の口座で使用する前に、デモ口座でインジケーターをテストすることをお勧めします。

The Fast flat indicator can recognize and notify you of short flats after the price rises or falls. Where the price can rush further or reverse. ++ The indicator is open to arbitrary flat settings. You will probably have to conduct quite a few tests, approaching the best results. I will be very grateful if you share in the comments your tests, parameters and advice to other users, who may also be able to improve your results. Should I use it for entry signals, order stops, hedging...? - The indi

Gann Box インジケーターは、トレーダーが市場の重要なレベルを特定し、活用するのを支援するために設計された強力で多機能なツールです。このインジケーターを使用すると、チャート上に長方形を描くことができ、それが自動的に 0, 0.25, 0.50, 0.75, 1 の戦略的レベルを持つ複数のゾーンに分割されます。価格がこれらのレベルのいずれかに達すると、アラートがトリガーされ、トレーディングの意思決定に貴重な支援を提供します。描いたゾーンに対する市場の動きを即座に把握できます。ゾーンをトレースするには、単純な長方形を描いて名前を GannBox に変更するだけです。 このインジケーターは、 サポートとレジスタンス の概念を使用するトレーダー、 サプライとデマンド 、 ICTテクニック 、または**公正価値ギャップ(FVG)**の専門家など、すべてのタイプのトレーダー向けに設計されています。 デイトレーダー、スイングトレーダー、またはポジショントレーダーであろうと、 Gann Box は市場の動きをより良く理解し予測する手助けをし、反応性とパフォーマンスを向上させます。 MT5バージョ

トレンドオシレーターは、高度なカスタム Crypto_Forex インジケーター、効率的な取引ツールです!
- 高度な新しい計算方法を使用 - パラメーター「計算価格」のオプションは 20 種類。 - これまで開発された中で最もスムーズなオシレーター。 - 上昇トレンドの場合は緑色、下降トレンドの場合は赤色。 - 売られすぎの値: 5 未満、買われすぎの値: 95 以上。 - このインジケーターを使用すると、標準戦略をアップグレードする機会が十分にあります。 - PC およびモバイルアラート付き。
高品質のトレーディングロボットとインジケーターをご覧になるにはここをクリックしてください! これは、この MQL5 Web サイトでのみ提供されるオリジナル製品です。

NASDAQ 100市場での高度な取引機会をNASDAQスマートインジケーターで発見 NASDAQスマートインジケーターは、NASDAQ 100市場での取引において非常に強力で効果的なツールの一つです。このインジケーターは特に1分と5分のタイムフレームに合わせて設計されており、高精度で高度なパフォーマンスを発揮します。簡単に設定してそのメリットを活用できます。 主な特徴 : 1分と5分のタイムフレームでの最適なパフォーマンス :このインジケーターは特にこれら2つのタイムフレーム向けに設計され、最高の結果を提供します。ほかのタイムフレームでも機能しますが、特に重要なこれらのタイムフレームに注力しています。 NASDAQ 100戦略との互換性 :このインジケーターは私たちのNASDAQ 100戦略の重要な要素で、適切な取引機会の理解を助けます。 このインジケーターは1年間にわたり利用・バックテストされてから提供されており、満足のいくパフォーマンスを示しています。しかし、利用前に必ずユーザー自身でバックテストし、機能性を確認してください。 オシレーター構造 :NASDAQスマートインジケータ
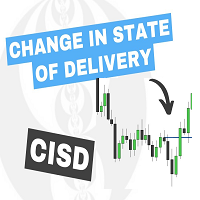
The Change In State Of Delivery (CISD) indicator detects and displays Change in State Of Delivery, a concept related to market structures.
Users can choose between two different CISD detection methods. Various filtering options are also included to filter out less significant CISDs.
USAGE Figure 2 A Change in State of Delivery (CISD) is a concept closely related to market structures, where price breaks a level of interest, confirming trends and their continuations from the resulting

ADX Shark Scalper – The Ultimate Hybrid Indicator for Precision Scalping Dive into the markets with the ADX Shark Scalper , a powerful and versatile tool designed for traders who seek precision in every trade. This cutting-edge indicator seamlessly combines multiple advanced technical signals into one streamlined system, allowing you to spot good buy and sell opportunities with ease. At its core, the ADX Shark Scalper leverages the power of trend and momentum detection through the integration of

Vondereich MTF Strength System – The Ultimate BBMA Dashboard for MT4 Overview Stop wasting time scanning dozens of charts manually!
The Vondereich MTF Strength System is a professional dashboard designed for traders who follow the BBMA (Bollinger Bands & Moving Averages) methodology. It automatically scans multiple pairs and timeframes, highlighting high-probability setups such as Re-entry, CSM, MHV, and Extreme . With a clean and responsive interface, you’ll instantly see market momentum
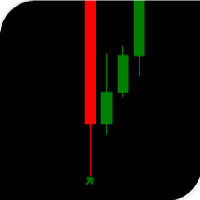
The arrow indicator without redrawing shows potential entry points into the market in the form of arrows of the appropriate color: the up arrows (usually green) suggest opening a purchase, the red down arrows suggest selling. The appearance of arrows may be accompanied by beeps. It is usually assumed to enter at the next bar after the pointer, but there may be non-standard recommendations. Arrow indicators visually "unload" the price chart and save time for analysis: no signal – no deal, if ther
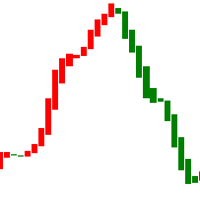
This is an indicator that tracks price trends and can alert traders when the market exhibits abnormalities. The indicator chart is marked with red and green colors. The background color of the chart is white and cannot be modified to other background colors. When the indicator color changes from red to green, it means that the market price has paused or even reversed. This is a reminder to traders of the possibility of short orders. When the indicator color changes from green to red, it means t

This dashboard shows you the 3MA Cross Overs current status for Multi-currency multi-timeframes. Works for Metatrader 4 (MT4) platform. Detailed Post:
https://www.mql5.com/en/blogs/post/759238
How it Works:
MA Cross Signals It will show “S” Green/Red Strong Signals and “M” or “W” Green/Red Medium or Weak signals. We have 3 types of MA: Faster, Medium and Slower MA. A strong signal is when FasterMA and MediumMA are both above/below SlowerMA. A medium signal is when only FasterMA is above/below

The script tries to determine the overall direction of the market, using smoothed Heiken Ashi candles. The coloring system (using bright and dark colors) is an attempt to detect strong market and weak market conditions. There's also an oscillator within the script
These are the features: Alert condition Features: You can now set alerts in the alert dialog for events like trend switch, trend strengthening and weakening; all for both Bullish and Bearish trend.
I also added the code for custom a
FREE

Detailed post explained:
https://www.mql5.com/en/blogs/post/759269
This is a slope indicator for Bollinger Bands indicator. It provides slopes for BB top band, center band (main) and Lower Band. You can also set a threshold value for Center line to control Red/Green slope histogram lines. Settings:
You can choose which line you need the slope and Threshold Alerts for in Drop down.
Slope Thresholds: for Alerts. Please note that Alerts only happen when Threshold is crossed. e.g.: If Threshold
FREE

Machine Learning Adaptive SuperTrend - Take Your Trading to the Next Level!
Introducing the Machine Learning Adaptive SuperTrend , an advanced trading indicator designed to adapt to market volatility dynamically using machine learning techniques. This indicator employs k-means clustering to categorize market volatility into high, medium, and low levels, enhancing the traditional SuperTrend strategy. Perfect for traders who want an edge in identifying trend shifts and market conditio

Scopri l'Indicatore Avanzato di Zone di Offerta e Domanda Sei pronto a portare il tuo trading al livello successivo? L'indicatore "Advanced Supply and Demand Zone" è lo strumento definitivo per identificare con precisione le zone chiave di supporto e resistenza sul mercato, permettendoti di prendere decisioni informate e tempestive. Come Funziona Questo indicatore innovativo analizza il mercato utilizzando frattali veloci e lenti per individuare i punti di inversione del prezzo. Si basa sui prin

Unlock the Power of Multi-Market Insights with Our Cutting-Edge Dashboard Indicator
Are you tired of juggling multiple charts and indicators just to stay on top of the markets? Introducing the "RSI & EMA Cross Dashboard" - a revolutionary trading tool that consolidates critical signals across your favorite currency pairs and timeframes into a single, easy-to-read display.
Meticulously coded by our team of seasoned developers, this indicator harnesses the power of RSI and EMA crossover analysi

Advancing in NASDAQ 100 Trading with the Smart "Candle Color" Indicator The indicator we offer is one of the good tools for trading in the NASDAQ 100 market, especially in the 1-minute and 5-minute timeframes. This indicator is designed with precision and scientific rigor and can also be used in other timeframes. All you need to do is activate it and leverage its power. Unique Features: Optimized Performance in 1-Minute and 5-Minute Timeframes: This indicator is specifically designed for these

Magic Moving AI The Magic Moving AI indicator is one of the best tools for trading in the NASDAQ 100 market. This tool is specifically designed for the 1-minute and 5-minute timeframes and operates with high precision. You can easily activate this indicator and benefit from its advantages. Unique Features: Specialized Performance in 1-Minute and 5-Minute Timeframes: While this indicator is capable of working in other timeframes, its primary focus is on these two timeframes to deliver optimal re

The indicator now available to you is one of the best tools for trading in the NASDAQ 100 market, particularly in the 1-minute and 5-minute timeframes. This tool is designed with precision and can also be used for other timeframes. All you need to do is activate it. Key Features: Specialized Performance in 1-Minute and 5-Minute Timeframes: While this indicator can work in other timeframes, it delivers optimal results in these two timeframes. Compatibility with the NASDAQ 100 Secret Strategy: Th
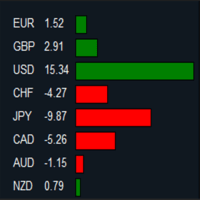
MT5 Version: https://www.mql5.com/en/market/product/124136 Imagine you’re at the helm of your trading terminal, scanning charts of various currency pairs, trying to figure out which ones are strong, which ones are weak, and where the real opportunities lie. It’s a lot to process—flipping between charts, calculating movements, and comparing performance. But what if all of that could be done for you, neatly displayed in one place? That’s where this Forex Strength Dashboard comes in. Picture thi
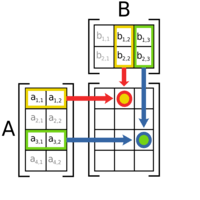
MT5 Version: https://www.mql5.com/en/market/product/124107 A Day in the Life of a Trader: Discovering the Forex Matrix Dashboard In the fast-paced world of forex trading, keeping track of multiple currency pairs can feel overwhelming. That’s where the Forex Matrix Dashboard comes in, making the life of a trader much easier. Imagine opening the dashboard and instantly seeing all your favorite currency pairs, like EUR/USD, GBP/USD, and USD/JPY, displayed clearly with their latest prices. No mo

MT5 Version: https://www.mql5.com/en/market/product/124150 You’re sitting in your trading room, sipping coffee as the markets start their day. The screen in front of you is alive with numbers, price movements, and endless charts. Each one demands your attention. But you don’t have time to dive into every single detail. You need a quick, reliable way to read the market’s mood. That’s when you glance at your Sentiment Dashboard—a custom-built tool designed to simplify your trading decisions. This
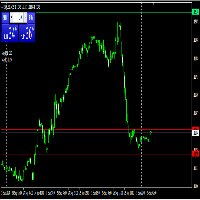
Please share a comment or rate for improvement Main Function : The start function is called on each new tick. It performs the main logic of the indicator: It initializes arrays to store daily high and low prices. It resizes and initializes these arrays based on the number of days specified by the DAYS input parameter. It copies the daily high and low prices into these arrays. It finds the highest high and the lowest low over the specified number of days. It displays these values as com
FREE
Brilliant Reversal Multicurrency Scanner MT4 は、Brilliant Reversalインジケーターを使用して、複数の通貨ペアと時間枠を監視するために設計された強力なツールです。このスキャナーは、市場の潜在的な反転を特定するプロセスを簡素化し、集中型ダッシュボードからリアルタイムのスキャンとアラートを提供します。主要ペア、マイナーペア、またはエキゾチックペアを取引する場合でも、このツールは包括的な市場カバレッジと取引戦略に合わせたカスタマイズ可能な設定を提供します。市場の動きを先取りし、この必須ツールでエントリーを洗練してください。 このツールは、シグナルをグリッド形式で整理し、買いシグナルと売りシグナルをそれぞれの強度とともに表示します: S :強い M :中 W :弱い MT5バージョンはこちらで入手できます: Brilliant Reversals MultiCurrency Scanner MT5 詳細なドキュメントはこちらをクリックしてください: here 主な機能: 統合 Brilliant Reversal:Small Bar
Nadaraya Watson Envelopeマルチカレンシースキャナー MT4 は、複数の通貨ペアと時間枠にわたる重要な反転シグナルを監視するための簡素化された方法を提供します。TradingViewでその正確な反転シグナルで知られている人気のインジケーターを基に構築されたこのスキャナーは、同じコアロジックをMT4互換の形式に適応させています。低時間枠での短期的な機会と高時間枠での強いトレンドシグナルに焦点を当て、トレーダーが市場の転換点に注意を払うのに役立ちます。 MT5バージョンはこちらで入手できます: Nadaraya Watson Envelope Multicurrency Scanner MT5 詳細なドキュメントはこちらをクリックしてください: ドキュメント 主な機能: インジケーターの統合:Nadaraya Watson Envelopeインジケーターを使用し、価格行動の周囲に滑らかなエンベロープを計算します。トレーダーはLengthパラメーターを調整して考慮するバーの数を定義し、Bandwidthを調整して平滑化を制御し、Multiplierを設定してエンベロープ
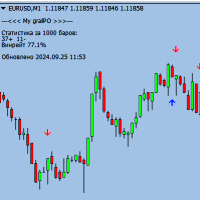
Attention, for the indicator to work correctly, you need to put the "MQL5" folder in your terminal folder, you can download it from the link below: https://disk.yandex.ru/d/DPyo0ntaevi_2A
Binary Scalper 7 is a powerful tool designed to identify and predict the next candle, allowing traders to make informed decisions when trading binary options. This indicator works on any time frame and with any expiration, making it a versatile and reliable tool for traders of all levels.
How it works:
The

FVG ゾーン インジケーターは、 市場における公正価値ギャップ (FVG) を特定し、公正価値と市場価格の間の価格不均衡を浮き彫りにするために設計された強力なツールです。このギャップの正確な特定により、トレーダーは潜在的な市場参入および市場退出ポイントを見極めることができ、情報に基づいた取引決定を行う能力が大幅に向上します。 FVG ゾーン インジケーターは、直感的でユーザー フレンドリーなインターフェイスを備えており、チャート上の公正価値ギャップを自動的にスキャンして、価格チャートにこれらのゾーンをリアルタイムでマークします。これにより、トレーダーは、今後の価格修正やトレンドの継続を示唆する可能性のある潜在的な価格の不均衡を迅速かつ簡単に認識できます。 主な機能は次のとおりです。 リアルタイムギャップ検出: FVG が現れると自動的に識別してマークします。 ギャップのサイズをピップ単位で表示: このインジケーターは、識別された各ギャップのサイズをピップ単位で表示し、トレーダーがギャップの重要性を理解するのに役立ちます。 現在の価格からのピップ距離: 特定された公正価値ギャップか

小さな価格変動をフィルタリングし、大きなトレンドに焦点を当てる . Renkoチャート指標は、小さな価格変動をフィルタリングして、全体のトレンドに焦点を当てるのに役立ちます。 価格が指定された距離だけ動くことで、Renkoブロックが作成されます。 これにより、価格が動いている現在のトレンド方向を簡単に特定できます。 多機能ユーティリティ : 66以上の機能を含む | ご質問があればご連絡ください | MT5バージョン インジケーターの設定で、以下を構成できます: 計算設定: ブロックサイズ(ポイント単位); インジケーターのスタイル:
ブロックの色; プログラムファイルは " Indicators " ディレクトリに配置してください。

Keltner Channel Multicurrency Scanner MT4 Keltner Channel Multicurrency Scanner MT4 は、複数の通貨ペアと時間枠でKeltnerチャネルの突破を検出し、リアルタイムで分析を提供することにより、あなたの取引戦略を強化するための高度なツールです。この強力なスキャナーは、トレーダーが重要な価格の動きや突破の機会を迅速に特定するのに役立ち、意思決定を加速し、市場分析を向上させます。 主な特徴 効率的なマルチカレンシースキャン: 複数の通貨ペアをリアルタイムで監視し、Keltnerチャネルの突破を即座に検出します。手動でチャートを切り替える必要はありません。 ダッシュボードによる包括的な概要: 明確で使いやすいダッシュボードで、強気および弱気の突破信号を確認します。市場の状況を追跡し、情報に基づいた取引判断を行います。 履歴信号の追跡: 過去のKeltnerチャネルの突破信号をレビューし、そのパフォーマンスを分析して戦略を最適化し、トレンドを把握します。 複数の時間枠のスキャン: 異なる時間枠でKeltnerチャネ

MT4用Heiken Ashiマルチカレンシースキャナー は、トレーダーがHeiken Ashiインジケーターを使用して市場のトレンドを効率的に監視できるように設計された高度なツールです。このスキャナーを使用すると、複数の通貨ペアを同時にスキャンでき、トレンドや反転のチャンスを素早く特定できます。 主な機能 簡単なマルチカレンシースキャン: 複数の通貨ペアをリアルタイムで監視し、重要なHeiken Ashiシグナルが検出された際に即座にアラートを受信します。 包括的なダッシュボード表示: さまざまな通貨ペアにおけるHeiken Ashiの強気および弱気トレンドをわかりやすいダッシュボードで確認できます。 幅広い通貨ペア対応: 主要通貨からエキゾチック通貨まで、さまざまな市場を分析可能です。 過去シグナルの追跡: 過去のHeiken Ashiトレンドシグナルをレビューし、取引戦略の改善に役立てることができます。 複数時間軸のスキャン: 短期から長期まで、さまざまな時間軸での取引チャンスを把握します。 シームレスなチャートナビゲーション: ダッシュボードからワンクリックで通貨ペアを切り替え

Binary Scalper 6 – MT4用の強力なバイナリーオプション指標
Binary Scalper 6 は、 MetaTrader 4 (MT4) 向けに設計された、先進的なトレンド分析とバイナリーオプショントレーディングツールです。すべてのレベルのトレーダーに適しており、明確なシグナルと統計を提供します。 主な特徴: トレンド検出 :トレンド市場を正確に特定し、明確な方向性を提示。 すべての通貨ペアに対応 :お好みの市場で取引可能。 あらゆるタイムフレームに対応 :1分足から月足まで。 1キャンドルの満期シグナル :迅速かつ簡潔なトレーディング機会。 統計情報を表示 :市場のパフォーマンスに関する貴重なデータを提供。 バッファ矢印 :取引エントリーを視覚的にサポート。 使用方法:
MQL5 フォルダをダウンロードし、MetaTrader 4 ディレクトリに移動します。 こちら からダウンロードできます。

Trend StarteR は、上昇トレンドと下降トレンドのシグナルを矢印の形で提供するマルチ RSI ベースのインジケーターです。このインジケーターは、起こり得るトレンドを予測し、トレーダーがそれらのトレンドの取引に参加できるようにするために作成されました。 このインジケーターは鉱石のバックペイントを再描画しません。このインジケーター信号は遅延しません。 ================= 推奨事項 : 低スプレッドのブローカー、時間枠は問いませんが、スプレッドに勝つには M5 以上に固執することをお勧めします。 ================================= パラメータ: 第 1、第 2、および第 3 RSI 期間 クロスが発生したときに信号が出力される上下のレベル 通知設定: モバイルアラート、サウンドアラート、MT4メッセージ ================================================= ================

RSI Divergence Multicurrency Scanner Dashboard for MT4 は、複数の通貨ペアおよびタイムフレームにわたるRSI(相対力指数)ダイバージェンス信号を効率的に検出するために設計された強力なツールです。このスキャナーは、市場の反転の潜在的なチャンスを簡単に特定でき、中央のダッシュボードからリアルタイムのスキャンとアラートを提供します。主要通貨ペア、マイナー通貨ペア、エキゾチック通貨ペアを取引している場合でも、このスキャナーは広範囲の市場をカバーし、あなたの取引戦略に合わせたカスタマイズ可能な設定を提供します。過去の信号を確認し、チャートを簡単に切り替えて設定を調整することで、このツールを使用して各チャートを常に監視することなく、情報に基づいた意思決定を行うことができます。市場の動きを先取りし、エントリーポイントを最適化するためのこの重要なツールを活用しましょう。 主な特徴 効率的なマルチ通貨ペアスキャン:複数の通貨ペアをリアルタイムで監視し、手動でチャートを切り替えることなく、RSIダイバージェンス信号を即座に検出します。 ダッシュボードの

Candlestick Pattern Scanner Dashboard MT4 は、複数の通貨ペアと時間足にわたるキャンドルパターンを監視するための強力なツールです。検出されたパターンはグリッド形式で整理され、パターンの短縮形と何本前のキャンドルで表示されたかを示します(例:BUEN(3)は、3本前にBullish Engulfingパターンが検出されたことを示します)。 MT5バージョンはこちらで確認できます: CandleStick Patterns Multicurrency Scanner MT5 詳細なドキュメントはこちらをご覧ください Documentation Link 主な特徴 キャンドルパターン検出:Doji (DOJ)、Hammer (HAM)、Bullish Engulfing (BUEN)、Bearish Engulfing (BEEN)、Three White Soldiers (TWS)など、15種類の人気パターンを識別します。 複数時間足スキャン:M1からMN1までの時間足でパターンを監視し、特定のスキャンを有効または無効にする柔軟性があります。 コ
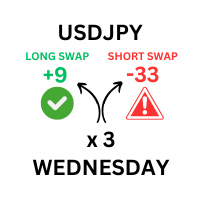
このツールは、取引プラットフォームで利用可能なすべての通貨ペアの詳細なスワップレートを表示するように設計されています。 これにより、トレーダーは視覚的に強化された別個のウィンドウでロングとショートの両方のスワップ値をすばやく確認できます。 このツールは、ロット サイズのユーザー定義の入力を提供し、現在のスワップ レートと取引量に基づいて正確な計算を保証します。 さらに、標準レートと週末調整レートの両方を考慮して、スワップ手数料が適用される時期も提供されます。 注: スワップ情報は取引プラットフォームに応じて毎日変わります。 ------------------------------------------------------------------------------------------------------------------------------------------------------------- このツールは、取引プラットフォームで利用可能なすべての通貨ペアの詳細なスワップレートを表示するように設計されています。 これにより、トレーダーは視覚的
MetaTraderマーケットは自動売買ロボットとテクニカル指標を販売するための最もいい場所です。
魅力的なデザインと説明を備えたMetaTraderプラットフォーム用アプリを開発するだけでいいのです。マーケットでプロダクトをパブリッシュして何百万ものMetaTraderユーザーに提供する方法をご覧ください。
取引の機会を逃しています。
- 無料取引アプリ
- 8千を超えるシグナルをコピー
- 金融ニュースで金融マーケットを探索
新規登録
ログイン