Neue technische Indikatoren für den MetaTrader 4 - 33

Gann-Theorie Die Gann-Theorie ist ein wichtiges Instrument der Finanzmarktanalyse, das auf den Annahmen der Marktzyklizität und der Naturgesetze beruht und Marktbewegungen mit Hilfe spezifischer technischer Analyseinstrumente vorhersagt. Zu den wichtigsten Elementen der Gann-Theorie gehören: Marktzyklen : Gann geht davon aus, dass es zyklische Schwankungen auf dem Markt gibt und dass diese Zyklen durch spezifische Zeit- und Preiszyklen identifiziert werden können. Preis und Zeit : Ganns Theorie
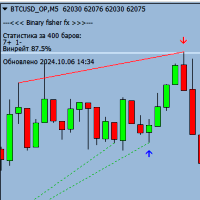
Binary Fisher FX ist ein leistungsstarker Indikator für binäre Optionen, der in jedem Zeitrahmen und mit jedem Währungspaar funktioniert. Dieser Indikator dient zur Identifizierung von Trendbewegungen und zeigt Einstiegspunkte in Form eines Pfeils vor dem Schließen der aktuellen Kerze an.
Hauptmerkmale des Indikators:
Funktioniert in jedem Zeitrahmen (M1, M5, M15, M30, H1, H4, D1) Unterstützt alle Währungspaare Ablauf von 1 bis 3 Kerzen (Standard 1 Kerze) Zeigt Einstiegspunkte in Form eines P
FREE

Simple ATR Stop Loss : Ihr Marktvolatilitäts-Kompass , der Ihnen hilft, durch die tückischen Gewässer des Handels zu navigieren , intelligentere Stop Losses zu setzen und Sie wie einen Handels-Ninja aussehen zu lässt (Umhang nicht inbegriffen). Achtung, alle Handelsliebhaber und Marktexperten! Seht her, der Simple ATR Stop Loss Indikator – Ihr neuer bester Freund in der wilden Welt des Handels. Er ist einfacher als ein zweiteiliges Puzzle aber mächtiger als ein koffeingeladener B
FREE

**FxCycle WaveSignal-Indikator**
Der **FxCycle WaveSignal Indicator** ist die perfekte Lösung für Trader, die starke und genaue Handelsgelegenheiten mit Hilfe eines **Wellenmuster**-Ansatzes in Kombination mit **Exponentiellen Gleitenden Durchschnitten (EMA)** identifizieren möchten. Der Indikator wurde entwickelt, um klare **Kauf-** und **Verkaufssignale** zu liefern, die auf der Preisbewegung um die **obere** und **untere Wellenlinie** basieren, sowie eine attraktive visuelle Darstellung dir

MASTER MA ist ein kreuzbasierter Indikator für gleitende Durchschnitte, der 3 gleitende Durchschnitte mit unterschiedlichen Perioden verwendet, um Signale zu generieren, die Strategie ist sehr einfach, aber der Indikator verfügt über ein Statistik-Dashboard, das nützliche sofortige Backtest-Ergebnisse wie Gewinnrate / gewonnene Gesamtgewinne anzeigt... usw., dieser Indikator hat TP- und SL-Eingaben in Punkten, so dass Sie Ihre gewünschten TP und SL auf dem Chart in Form eines grünen Punktes für

Crypto_Forex-Indikator HTF Ichimoku für MT4.
- Der Ichimoku-Indikator ist einer der leistungsstärksten Trendindikatoren. HTF steht für „Higher Time Frame“. - Dieser Indikator eignet sich hervorragend für Trendhändler sowie für die Kombination mit Price Action-Einträgen. - Der HTF Ichimoku-Indikator ermöglicht es Ihnen, Ichimoku aus einem höheren Zeitrahmen an Ihr aktuelles Diagramm anzuhängen. - Aufwärtstrend – rote Linie über der blauen (und beide Linien liegen über der Wolke) / Abwärtstrend
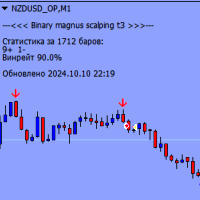
Binary Magnus Scalping T3 ist ein Indikator für binäre Optionen, der in jedem Zeitrahmen und mit jedem Währungspaar funktioniert. Verwendet die Clusteranalyse, um Einstiegspunkte zu identifizieren und gibt eine Warnung in Form eines Popup-Fensters und eines Pufferpfeils auf dem roten oder blauen Diagramm aus, bevor die aktuelle Kerze schließt.
Hauptmerkmale des Indikators:
Funktioniert in jedem Zeitrahmen (M1, M5, M15, M30, H1, H4, D1) Unterstützt alle Währungspaare Ablauf von 1 bis 3 Kerzen

ATR Pyramid ️: Ihre Eintrittskarte, um Gewinne höher zu stapeln als ein Jenga-Turm auf Steroiden , indem Sie die Marktvolatilität in eine Trend-Surfing ️, Positionserweiterungsparty verwandeln, bei der nur der erste Handel einen Wipeout riskiert , während Sie den Rest absichern, indem Sie Ihren Stop-Loss wie einen Aufzug nach oben schieben und so eine Komfortzone schaffen, die der einzig wahre Weg ist, Ihr Forex-Konto schneller zu vermehren als ein Kaninchen auf Espresso!!!
FREE

Der Area of Interest (AOI)-Indikator ist ein leistungsfähiges Instrument, das Händlern hilft, wichtige Marktzonen zu identifizieren, in denen Preisreaktionen sehr wahrscheinlich sind. Dieser Indikator hebt insbesondere zwei kritische Zonen hervor: Verkäufer-AOI (Area of Interest) : Diese Zone stellt Bereiche dar, in denen Verkäufer wahrscheinlich in den Markt eintreten werden und oft als Widerstand wirken. Wenn sich der Kurs dieser Zone nähert oder sie berührt, signalisiert dies, dass ein poten
FREE

Alpha Trend Zeichen ist seit langem ein sehr beliebtes Handelstool in unserem Unternehmen. Es kann unser Handelssystem überprüfen und Handelssignale klar anzeigen, und die Signale werden nicht driften.
Hauptfunktionen:
Anhand der Marktanzeige aktiver Bereiche können Indikatoren intuitiv bestimmen, ob der aktuelle Markttrend zu einem Trendmarkt oder zu einem volatilen Markt gehört.
Und betreten Sie den Markt gemäß den Indikatorpfeilen, mit grünen Pfeilen für Kauf und roten Pfeilen für Verkauf
Der Indikator wurde entwickelt, um wichtige Preisspannen in der Grafik anzuzeigen und die Marktdynamik innerhalb der festgelegten Grenzen zu analysieren. Er verwendet den Parameter Periode = 1200 , was bedeutet, dass die Daten auf der Grundlage von 1200 Kerzen oder Balken berechnet werden, um den Bereich zu bilden und anzuzeigen. Dieser Zeitraum eignet sich für langfristige Trends und ermöglicht es Ihnen, wichtige Unterstützungs- und Widerstandsebenen zu identifizieren.
Die Funktion Alert = Tr

Scalper Inside Volume Pro ist ein professionelles Handelssystem, das mehrere Indikatoren kombiniert, um ein zusammengesetztes Gesamtsignal zu berechnen. Es basiert auf einem Algorithmus, der sich auf das Volumen, den Money Flow Index und das Smart Money Konzept konzentriert. Der Indikator berücksichtigt strukturelle Swing-Punkte, an denen Preisumkehrungen auftreten. Scalper Inside Volume Pro bietet alle notwendigen Werkzeuge für erfolgreiches Scalping. Dieses umfassende Handelssystem eignet sich

DER PREISAKTIONSINDIKATOR! Dieses Programm findet Candlestick-Absorptionsmuster und einen falschen Zusammenbruch, woraufhin es die Einstiegspunkte mit Pfeilen einzeichnet.
Eingabeparameter :
1. PPR_Pfeil Der On-Parameter/Off-Anzeige der Absorptionsmuster-Pfeile. Standardmäßig ist er auf true gesetzt.
2. FB_Pfeil Entspricht dem ersten Parameter, nur für Modelle mit falscher Aufschlüsselung. Standardmäßig ist er auf true gesetzt.
Mit freundlichen Grüßen, Novak Production.
FREE

Live-Signal: Klick Eins
Haben Sie sich jemals gefragt, warum die meisten Systeme im Live-Handel nicht effektiv sind? Meine Antwort ist, dass es die Schuld des so genannten "Smart Money" oder der Institutionellen ist, die ständig Spikes erst nach oben und dann nach unten und umgekehrt erzeugen, um alle Kleinanleger zu verarschen, indem sie ihnen ihr Kapital wegnehmen, sie verwirren und die Märkte ohne Regeln zufällig bewegen lassen. Aber bei all dem gibt es eine berühmte Strategie, die 2009 die
Über:
Sucht nach Kursen, die ein Trendumkehrmuster bilden. Die Bedeutung dieses Musters besteht darin, dass der Kurs nach dem Auftreten dieses Musters dazu neigt, ein wenig zu schwanken und gleich danach auszubrechen.
Merkmale:
Sucht nach einem Trendumkehrmuster Anzahl der Balken, die das Muster bilden Linien nach rechts verlängern, um auf den Ausbruch zu warten Bull/Bear-Stärke für Kerzen, die das Muster bilden Filter mit Halftrend/NRTR
Wie es funktioniert:
Verwenden Sie diese Technik zum Sca

Der QuantumBlocks-Indikator ist ein fortschrittliches Instrument für Händler, die Akkumulations- oder Distributionszonen auf dem Markt, allgemein bekannt als "Order-Blöcke", genau identifizieren möchten. Diese Niveaus stellen Schlüsselbereiche dar, in denen Finanzinstitutionen oder Händler mit hohem Handelsvolumen ihre Aufträge platzieren und damit die Kursentwicklung stark beeinflussen. Hauptmerkmale: Automatische Erkennung von bullischen und bärischen Orderblöcken : Der Indikator scannt das Ch

Dieser Indikator basiert auf der Strategie, die von TheMas7er auf seinem YouTube-Kanal geteilt wird.
Der IDR/DR-Bereich hilft Ihnen, das Tageshoch und -tief zu identifizieren, sobald eine Kerze über oder unter den DR-Levels schließt.
Der IDR/DR-Bereich wird 1 Stunde nach Sitzungseröffnung, 09:30 Uhr morgens, bestimmt.
Ich habe das Fibonacci-Tool integriert, um Ihnen zu helfen, das Retracement für einen guten Einstieg in die Premium- oder Discount-Zone zu markieren.
Wichtig
Dieser Indikator w

Der Indikator basiert auf der Berechnung der Liquidität auf dem Markt und zeigt somit, wo der Markt am ehesten drehen kann... Er zeigt die Orte der Liquidität an, die der Preis früher oder später erreichen wird... Der Indikator kann auf mehrere Arten von Liquidität eingestellt werden und kann daher mehrere Ebenen auf dem Diagramm anzeigen... Es handelt sich um ein einzigartiges Instrument, das Ihnen bei Ihrem Handel sehr helfen kann. Der Indikator ist für die Währungspaare mit der höchsten Liqui

Enthüllen Sie Marktgeheimnisse mit Sneaky Busters auf MetaTrader 4! Tauchen Sie mit dem Sneaky Busters-Indikator tiefer in die komplizierte Welt des Handels ein. Der Indikator wurde speziell entwickelt, um die raffinierten Manöver des cleveren Geldes zu beleuchten und versteckte Markttrends aufzudecken. Umfassende Funktionen: 1. Erkennung der Akkumulation und Verteilung von intelligentem Geld: Genaue Analyse: Identifizieren Sie Schlüsselzonen, in denen intelligentes Geld Vermögenswerte sammelt u
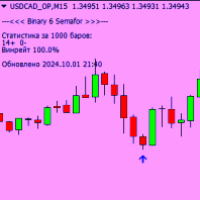
Binary 6 Semafor ist ein universeller Indikator für binäre Optionen für MetaTrader 4.
-Funktioniert für jeden Zeitrahmen und jedes Währungspaar
-Präzise Erkennung des Eintrittspunkts
-Das Signal erscheint auf dem Chart, bevor die aktuelle Kerze schließt
-Ablauf 1 Kerze
-Pufferpfeile für den Eintrag
-Zeigen Sie Statistiken für das aktuelle Asset an
Testergebnisse:
Der Indikator hat Tests mit beeindruckenden Ergebnissen bestanden und seine Wirksamkeit unter verschiedenen Marktbedingungen
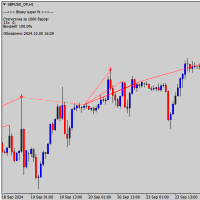
Binary Super FX für MetaTrader 4 ist ein leistungsstarker Oszillator für den Handel mit binären Optionen. Es kann für jeden Zeitrahmen und jedes Währungspaar verwendet werden.
Der Binary Super FX-Indikator liefert präzise Einstiegssignale in Form von Pufferpfeilen vor dem Schließen einer Kerze mit einem Ablauf von 1 Kerze. Dies ermöglicht es Händlern, schnelle und fundierte Entscheidungen über den Abschluss eines Handels zu treffen.
Es ist wichtig zu beachten, dass vor dem Kauf eines Indikato
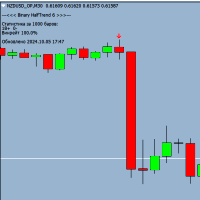
Binary HalfTrend 6 ist ein leistungsstarker Trendindikator, der für den Handel mit binären Optionen entwickelt wurde und genaue Kauf- und Verkaufssignale liefert. Das Ablaufdatum beträgt nur 1 Kerze, Sie können in jedem Zeitrahmen handeln. Der Binary HalfTrend 6-Indikator analysiert Markttrends und generiert zuverlässige Signale in Form von Pfeilen auf dem Diagramm für einen profitablen Handel. Bevor ich es im Live-Handel verwende, empfehle ich, es auf einem Demokonto zu testen, um die profitab

Der Fast-Flat-Indikator kann kurze Flats nach einem Kursanstieg oder -rückgang erkennen und Sie darüber informieren. Hier kann der Preis weiter steigen oder umkehren. ++ Der Indikator ist offen für beliebige Flat-Einstellungen. Sie werden wahrscheinlich einige Tests durchführen müssen, um sich den besten Ergebnissen zu nähern. Ich wäre Ihnen sehr dankbar, wenn Sie in den Kommentaren Ihre Tests, Parameter und Ratschläge mit anderen Nutzern teilen würden, die vielleicht auch Ihre Ergebnisse verbes

Trading System Double Trend – ein unabhängiges Handelssystem bestehend aus mehreren Indikatoren. Bestimmt die Richtung des allgemeinen Trends und gibt Signale in Richtung der Preisbewegung.
Kann für Scalping, Intraday- oder Intraweek-Handel verwendet werden.
Möglichkeiten
Funktioniert mit allen Zeitrahmen und Handelsinstrumenten (Forex, Kryptowährungen, Metalle, Aktien, Indizes). Einfaches visuelles Lesen von Informationen, ohne ein Diagramm laden zu müssen Der Indikator zeichnet keine Signal

Der Gann Box Indikator ist ein leistungsstarkes und vielseitiges Werkzeug, das dazu entwickelt wurde, Händlern zu helfen, die Schlüsselniveaus des Marktes zu identifizieren und zu nutzen. Dieser Indikator ermöglicht es, ein Rechteck im Diagramm zu zeichnen, das automatisch in mehrere Zonen mit strategischen Niveaus 0, 0.25, 0.50, 0.75, 1 unterteilt wird. Wenn der Preis eines dieser Niveaus erreicht, werden Warnungen ausgelöst, was eine wertvolle Hilfe bei Handelsentscheidungen bietet. Sie wissen

Entdecken Sie fortgeschrittene Handelsmöglichkeiten im NASDAQ 100 Markt mit dem NASDAQ Smart Indicator Der NASDAQ Smart Indicator ist eines der leistungsstarken und effektiven Werkzeuge für den Handel im NASDAQ 100 Markt. Dieser Indikator wurde speziell für die Zeitrahmen von 1 Minute und 5 Minuten entwickelt und arbeitet mit hoher Präzision und Expertise. Sie können ihn leicht aktivieren und von seinen Vorteilen profitieren. Hauptmerkmale : Optimale Leistung im 1- und 5-Minuten-Zeitrahmen : Die

CCI Divergence Scanner Dashboard for MT4 ist ein leistungsstarkes Tool, das Händlern hilft, bullische und bärische Divergenzsignale basierend auf dem CCI (Commodity Channel Index) über mehrere Währungspaare und Zeitrahmen hinweg effizient zu erkennen. Es vereinfacht den Analyseprozess, indem es den Markt kontinuierlich scannt und Chancen direkt auf einem intuitiven Dashboard präsentiert. Mit Echtzeitwarnungen, anpassbaren Einstellungen und nahtloser Chart-Navigation ermöglicht es Händlern, hochw

Der Support Resistance Whisperer ist ein leistungsstarkes Tool, das Händlern dabei hilft, wichtige Unterstützungs- und Widerstandsniveaus auf dem Markt zu identifizieren. Dieser Indikator nutzt die Preisbewegung, um dynamisch rote Widerstandslinien und grüne Unterstützungslinien in Ihr Diagramm einzuzeichnen und bietet so eine klare und visuelle Darstellung wichtiger Preiszonen, in denen potenzielle Marktumkehrungen oder Ausbrüche auftreten können. Im Gegensatz zu herkömmlichen Methoden, die
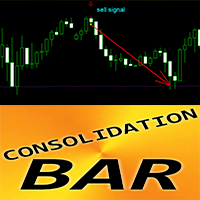
Crypto_Forex-Indikator Konsolidierungsbalkenmuster für MT4.
- Der Indikator „Konsolidierungsbalken“ ist ein sehr leistungsstarker, auf Ausbrüche fokussierter Indikator für den Price-Action-Handel. - Der Indikator erkennt die Preiskonsolidierung in einem engen Bereich während 1 Balken und zeigt: Ausbruchsrichtung, ausstehende Auftragsposition und SL-Position. - Bullischer Konsolidierungsbalken – Blaues Pfeilsignal auf dem Diagramm (siehe Bilder). - Bärischer Konsolidierungsbalken – Rotes Pfeils

Fxcycle Trend Indicator - Präzisionshandel für konstante Gewinne
Version: 1.00 Copyright: Fxcycle
Der Fxcycle Trend-Indikator ist ein leistungsfähiges Trendfolge-Tool, das Händlern hilft, die Marktrichtung mit Leichtigkeit zu erkennen. Dieser Indikator wurde für Händler aller Erfahrungsstufen entwickelt und liefert präzise Kauf- und Verkaufssignale, die auf einer fortschrittlichen Trendanalyse basieren. Damit ist er das perfekte Werkzeug für alle, die ihre Gewinne auf dem Devisenmarkt maximie
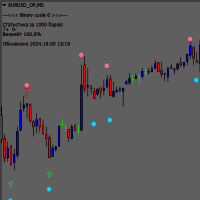
Der Indikator Binary Cucle 6 ist ein leistungsstarker Oszillator für den Handel mit binären Optionen auf der MetaTrader 4-Plattform. Er ist für den Einsatz in Zeitrahmen ab M5 konzipiert und kann auch für jedes Währungspaar verwendet werden.
Der Binary Cucle 6-Indikator liefert präzise Signale für den Einstieg in einen Handel in Form von blauen und roten Pfeilen, die auf dem Chart erscheinen, bevor die aktuelle Kerze schließt. Dies ermöglicht es Händlern, schnelle und fundierte Entscheidungen

Advanced Reversal Hunter Pro (ARH) ist ein leistungsstarker, innovativer volatilitätsbasierter Momentum-Indikator, der entwickelt wurde, um wichtige Trendumkehrungen genau zu erkennen. Er wurde mit einem speziellen Algorithmus entwickelt, der eine klare Konstruktion der durchschnittlichen Volatilitätsspanne bietet, ohne deren Werte neu zu zeichnen und sie nicht zu verändern. Der Indikator passt sich jeder Marktvolatilität an und passt die Breite des Bandes je nach den aktuellen Marktbedingungen

Ich stelle Ihnen Order Blocks Breaker vor, eine brandneue Methode zur Identifizierung und Nutzung von Orderblöcken in Ihrer Handelsstrategie. Nachdem ich mehrere Orderblock-Tools mit einzigartigen Konzepten entwickelt habe, bin ich stolz darauf, dieses Tool zu präsentieren, das die Dinge auf die nächste Stufe hebt. Im Gegensatz zu früheren Tools identifiziert Order Blocks Breaker nicht nur Orderblöcke, sondern hebt auch Breaker Order Blocks hervor - Schlüsselbereiche , in denen der Preis nach ei
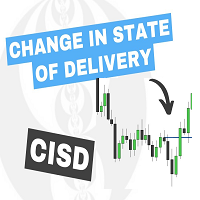
Der Indikator Change In State Of Delivery (CISD) erkennt und zeigt die Änderung des Lieferzustands an, ein Konzept, das sich auf die Marktstrukturen bezieht.
Der Benutzer kann zwischen zwei verschiedenen CISD-Erkennungsmethoden wählen. Außerdem gibt es verschiedene Filteroptionen, um weniger bedeutende CISDs herauszufiltern.
ANWENDUNG Abbildung 2 Ein Change in State of Delivery (CISD) ist ein Konzept, das eng mit Marktstrukturen verwandt ist, bei dem der Preis ein interessantes Niveau dur
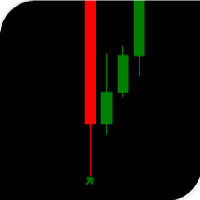
Der Pfeilindikator ohne Umzeichnung zeigt potenzielle Einstiegspunkte in den Markt in Form von Pfeilen in der entsprechenden Farbe an: Die Aufwärtspfeile (in der Regel grün) deuten auf einen Kauf hin, die roten Abwärtspfeile auf einen Verkauf. Das Erscheinen der Pfeile kann von Signaltönen begleitet werden. In der Regel wird davon ausgegangen, dass der Einstieg beim nächsten Balken nach dem Zeiger erfolgt, aber es kann auch abweichende Empfehlungen geben. Pfeilindikatoren "entladen" das Preisdia
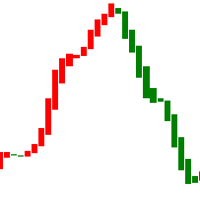
Dies ist ein Indikator, der Preistrends verfolgt und Händler warnen kann, wenn der Markt Anomalien aufweist. Das Diagramm des Indikators ist mit roten und grünen Farben gekennzeichnet. Die Hintergrundfarbe des Diagramms ist weiß und kann nicht in andere Hintergrundfarben geändert werden. Wenn die Farbe des Indikators von rot zu grün wechselt, bedeutet dies, dass der Marktpreis eine Pause eingelegt oder sich sogar umgekehrt hat. Dies ist ein Hinweis für Händler auf die Möglichkeit von Short-Order
Der Indikator präsentiert drei Supertrends, die einen möglichen Trend für den Tag identifizieren und platziert mögliche Einstiegsflaggen, wenn sie ausgerichtet sind, akustische und visuelle Alarme verfügbar, verwendbar auf allen Zeitrahmen, Fähigkeit, Trends, Farben und Zeitfilter anzupassen.
jeder Vermögenswert benötigt seine eigenen spezifischen Supertrends, der Indikator hat Standardtrends, die auf M5 verwendet werden können

Beschreibung des Indikators: Der Ratel Strength-Indikator wird hauptsächlich verwendet, um die Stärke von Long- und Short-Trends zu bestimmen und Referenzsignale für Kauf- und Verkaufspunkte zu geben. Er eignet sich für Gold, Devisen, digitale Währungen, etc. Parameter des Indikators: Proid:14 B/S-Signal Umkehrung Abweichung Wert:1 .00
Anzeige B/S-Signal:TRUE Farbe des Aufwärtstrendsignals:clrLightSeaGreen Farbe des Abwärtstrendsignals:clrRot Verwendung des Indikators:
Oberhalb der 0-Achse der

Dieses Dashboard zeigt Ihnen den aktuellen Status der 3MA Cross Overs für Multiwährungs-Multitimeframes. Funktioniert für die Plattform Metatrader 4 (MT4). Ausführlicher Beitrag:
https://www.mql5.com/en/blogs/post/759238
Wie es funktioniert:
MA Cross-Signale Es werden "S" grün/rote starke Signale und "M" oder "W" grün/rote mittlere oder schwache Signale angezeigt. Es gibt 3 Arten von MA: Faster, Medium und Slower MA. Ein starkes Signal liegt vor, wenn der FasterMA und der MediumMA beide über/u

Das Skript versucht, die Gesamtrichtung des Marktes zu bestimmen, indem es geglättete Heiken Ashi-Kerzen verwendet. Das Einfärbesystem (mit hellen und dunklen Farben) ist ein Versuch, starke und schwache Marktbedingungen zu erkennen. Das Skript verfügt auch über einen Oszillator
Dies sind die Merkmale: Alarmbedingungen Funktionen: Sie können jetzt Alarme im Alarm-Dialog für Ereignisse wie Trendwechsel, Trendverstärkung und -abschwächung einstellen; sowohl für Bullen- als auch für Bären-Trends.
FREE

Ausführlicher Beitrag erklärt:
h ttps://www.mql5 .com/en/blogs/post/759269
Dies ist ein Neigungsindikator für den Bollinger Bands Indikator. Er liefert Steigungen für das obere BB-Band, das mittlere Band (Hauptband) und das untere Band. Sie können auch einen Schwellenwert für die Mittellinie festlegen, um die roten/grünen Histogrammlinien zu steuern. Einstellungen:
Sie können in der Dropdown-Liste auswählen, für welche Linie Sie die Steigung und die Schwellenwerte für Alarme benötigen.
Schwell
FREE

Erschließen Sie die Macht der Multi-Market Insights mit unserem innovativen Dashboard-Indikator
Sind Sie es leid, mit mehreren Charts und Indikatoren zu jonglieren, nur um den Überblick über die Märkte zu behalten? Wir stellen Ihnen das "RSI & EMA Cross Dashboard" vor - ein revolutionäres Handelsinstrument, das wichtige Signale für Ihre bevorzugten Währungspaare und Zeitrahmen in einer einzigen, leicht lesbaren Anzeige zusammenfasst.
Dieser Indikator, der von unserem Team erfahrener Entwickle

Fortschritte im NASDAQ 100 Handel mit dem intelligenten "Candle Color" Indikator Der von uns angebotene Indikator ist eines der besten Instrumente für den Handel mit dem NASDAQ 100, insbesondere im 1-Minuten- und 5-Minuten-Zeitrahmen. Dieser Indikator wurde mit Präzision und wissenschaftlicher Strenge entwickelt und kann auch in anderen Zeitrahmen verwendet werden. Sie brauchen ihn nur zu aktivieren und seine Leistung zu nutzen. Einzigartige Eigenschaften: Optimierte Leistung im 1-Minuten- und

Magic Moving AI Der Magic Moving AI-Indikator ist eines der besten Tools für den Handel im NASDAQ 100-Markt. Dieses Tool ist speziell für den 1-Minuten- und 5-Minuten-Zeitrahmen konzipiert und arbeitet mit hoher Präzision. Sie können diesen Indikator leicht aktivieren und von seinen Vorteilen profitieren. Einzigartige Eigenschaften: Spezialisierte Leistung im 1-Minuten- und 5-Minuten-Zeitrahmen: Obwohl dieser Indikator auch in anderen Zeitrahmen funktionieren kann, liegt sein Hauptaugenmerk auf

Der Indikator, der Ihnen jetzt zur Verfügung steht, ist eines der besten Instrumente für den Handel mit dem NASDAQ 100, insbesondere für den 1-Minuten- und 5-Minuten-Zeitrahmen. Dieses Tool wurde mit Präzision entwickelt und kann auch für andere Zeitrahmen verwendet werden. Alles, was Sie tun müssen, ist es zu aktivieren. Hauptmerkmale: Spezialisierte Leistung im 1-Minuten- und 5-Minuten-Zeitrahmen: Obwohl dieser Indikator auch in anderen Zeitrahmen funktionieren kann, liefert er in diesen beid
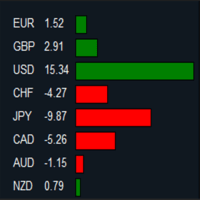
MT5 Version: https://www.mql5.com/en/market/product/124136 Stellen Sie sich vor, Sie sitzen am Steuer Ihres Handelsterminals, scannen die Charts verschiedener Währungspaare und versuchen herauszufinden, welche stark und welche schwach sind und wo die wahren Chancen liegen. Das ist eine Menge Arbeit - zwischen Charts hin und her zu springen, Bewegungen zu berechnen und die Performance zu vergleichen. Aber was wäre, wenn all das für Sie erledigt und an einem Ort übersichtlich dargestellt werden kö
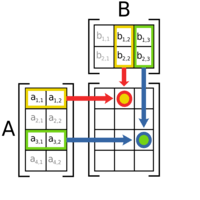
MT5 Version: https://www.mql5.com/en/market/product/124107 Ein Tag im Leben eines Traders: Die Entdeckung des Forex Matrix Dashboard In der schnelllebigen Welt des Devisenhandels kann es sich als überwältigend erweisen, den Überblick über mehrere Währungspaare zu behalten. Hier kommt das Forex Matrix Dashboard ins Spiel, das das Leben eines Traders wesentlich einfacher macht. Stellen Sie sich vor, Sie öffnen das Dashboard und sehen sofort alle Ihre bevorzugten Währungspaare, wie EUR/USD, GBP/USD

MT5 Version: https://www.mql5.com/en/market/product/124150 Sie sitzen in Ihrem Handelsraum und nippen an Ihrem Kaffee, während die Märkte ihren Tag beginnen. Der Bildschirm vor Ihnen ist voll mit Zahlen, Kursbewegungen und endlosen Charts. Jedes einzelne verlangt Ihre Aufmerksamkeit. Aber Sie haben keine Zeit, sich mit jedem einzelnen Detail zu beschäftigen. Sie brauchen eine schnelle, zuverlässige Methode, um die Stimmung auf dem Markt zu erkennen. In diesem Fall werfen Sie einen Blick auf Ihr
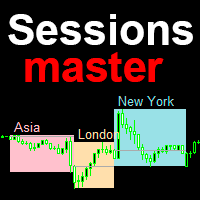
Session Master ist ein Indikator für Handelssitzungen mit erweiterten Funktionen. Standardmäßig zeigt er die asiatischen, Londoner und New Yorker Sessions an, wobei Sie die Möglichkeit haben, jede Session des Indikators für Ihren Handel anzupassen. Beschreibung Zeigt einen rechteckigen Bereich des angegebenen Zeitraums in Stunden des Tages an. Das Maximum und Minimum der Session entspricht den Maxima und Minima der rechteckigen Bereiche der Sessions. Individuelle Einstellung für jede Sitzung, Na

Möchten Sie einen Expert Advisor (EA) mit einem Indikator erstellen, der die erforderlichen Daten nicht in einem Puffer (sichtbar im Datenfenster) speichert und nur Objekte auf dem Chart zeichnet? Diese Lösung erfasst Chart-Objekte und legt sie in Puffern ab. So können Sie einen EA erstellen - unabhängig davon, ob Sie EA Builder Pro verwenden oder mit iCustom Code schreiben - indem Sie die richtigen Werte mithilfe dieser Puffer (Modi) auswählen. Es funktioniert mit jedem in der Objektliste sicht
Nadaraya Watson Envelope Multicurrency Scanner MT4 bietet eine optimierte Möglichkeit, entscheidende Umkehrsignale über mehrere Währungspaare und Zeitrahmen hinweg zu überwachen. Basierend auf dem beliebten TradingView-Indikator, der für seine präzisen Umkehrsignale bekannt ist, passt dieser Scanner die gleiche Kernlogik in ein MT4-kompatibles Format an. Er konzentriert sich auf kurzfristige Chancen in niedrigeren Zeitrahmen und starke Trend-Signale in höheren Zeitrahmen, um Trader bei Marktumke
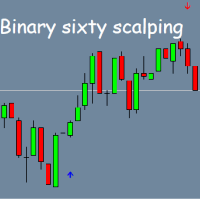
Binary Sixty Scalping – Indikator für binäre Optionen auf MT4 Binary Sixty Scalping ist ein Indikator für die MT4-Plattform, der speziell für den Handel mit binären Optionen entwickelt wurde. Er funktioniert in allen Zeitrahmen, jedoch wird für eine höhere Genauigkeit empfohlen, ihn ab M5 zu verwenden. Der Indikator ist mit allen Währungspaaren kompatibel und kann an verschiedene Märkte angepasst werden. Wichtige Merkmale: Standard-Ablaufzeit – 1 Kerze , anpassbar in den Einstellungen; Trendbas
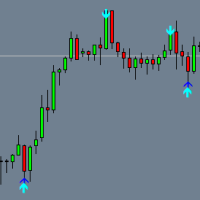
Binary DUNKS ist ein Tool für den Handel mit binären Optionen, optimiert für Zeiteinheiten ab M5 . Dieser Indikator funktioniert mit jedem Währungspaar und hilft dabei, potenzielle Einstiegspunkte auf dem Markt zu identifizieren. Hauptmerkmale Ablauf:
Standardmäßig auf 1 Kerze eingestellt, in den Indikatoreinstellungen anpassbar. Signale:
Der Indikator generiert Pfeile: Roter Pfeil — Verkaufssignal. Blauer Pfeil — Kaufsignal.
Die Signale sind am effektivsten, wenn es zwei Bestätigungen g
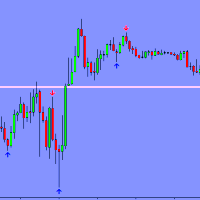
Binary Crater ist ein leistungsstarker und vielseitiger Indikator für MetaTrader 4, der speziell für den Handel mit binären Optionen entwickelt wurde. Es funktioniert effektiv in jedem Zeitrahmen und mit jedem Währungspaar, was es zu einem äußerst flexiblen Werkzeug für Händler macht.
Hauptmerkmale:
Trendanalyse: Der Indikator ermittelt automatisch den aktuellen Trend auf dem Markt, was Händlern hilft, Geschäfte in Trendrichtung einzugehen, wodurch die Wahrscheinlichkeit eines erfolgreichen H
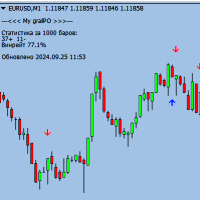
Achtung, damit der Indikator richtig funktioniert, müssen Sie den Ordner "MQL5" in Ihren Terminal-Ordner legen. Sie können ihn über den folgenden Link herunterladen: https://disk.yandex.ru/d/DPyo0ntaevi_2A
Binary Scalper 7 ist ein leistungsfähiges Tool, das entwickelt wurde, um die nächste Kerze zu identifizieren und vorherzusagen, so dass Trader fundierte Entscheidungen beim Handel mit binären Optionen treffen können. Dieser Indikator funktioniert auf jedem Zeitrahmen und mit jedem Ablaufdatu
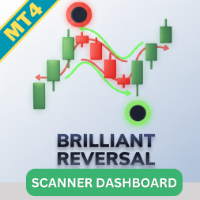
Der Brilliant Reversal Multicurrency Scanner MT4 ist ein leistungsstarkes Tool, das entwickelt wurde, um Tradern beim Überwachen mehrerer Währungspaare und Zeitrahmen mit dem Brilliant Reversal Indikator zu helfen. Dieser Scanner vereinfacht die Identifizierung potenzieller Marktumbrüche, indem er Echtzeit-Scans und Benachrichtigungen direkt von einem zentralen Dashboard bereitstellt. Egal, ob Sie mit Major-, Minor- oder exotischen Paaren handeln, dieses Tool bietet umfassende Marktüberwachung u

Der Keltner Channel Multicurrency Scanner MT4 ist ein fortschrittliches Tool, das entwickelt wurde, um Ihre Handelsstrategie zu verbessern, indem es Keltner Channel Breakouts erkennt und Echtzeit-Analysen für mehrere Währungspaare und Zeitrahmen bietet. Dieser leistungsstarke Scanner hilft Händlern, schnell bedeutende Preisschwankungen und Breakout-Gelegenheiten zu identifizieren, was die Entscheidungsfindung beschleunigt und die Marktanalyse verbessert. Hauptfunktionen Müheloses Multicurrency-S

Der Heiken Ashi Multicurrency Scanner für MT4 ist ein leistungsstarkes Tool, das Trader dabei unterstützt, Markttrends mithilfe des Heiken Ashi Indikators effizient zu überwachen. Mit diesem Scanner können Sie mehrere Währungspaare gleichzeitig analysieren und Trend- sowie Umkehrmöglichkeiten schnell identifizieren. Wichtigste Funktionen Müheloses Multicurrency-Scanning: Überwachen Sie mehrere Währungspaare in Echtzeit und erhalten Sie sofortige Benachrichtigungen, wenn wichtige Heiken Ashi Sign

Binary Scalper 6 – Leistungsstarker Indikator für binäre Optionen für MT4
Binary Scalper 6 ist ein fortschrittliches Tool zur Trendanalyse und zum Handel mit binären Optionen auf MetaTrader 4 (MT4) . Geeignet für Trader aller Erfahrungsstufen, bietet er klare Signale und detaillierte Statistiken. Hauptmerkmale: Trend-Erkennung : Präzise Identifikation von Trendmärkten. Unterstützt alle Währungspaare : Flexibilität für bevorzugte Märkte. Funktioniert auf jedem Zeitrahmen : Von 1-Minuten- bis zu

Trend StarteR ist ein Multi-RSI-basierter Indikator, der Aufwärts- und Abwärtstrendsignale in Form von Pfeilen ausgibt. Der Indikator wurde entwickelt, um mögliche Trends vorherzusagen und Händlern dabei zu helfen, am Handel mit diesen Trends teilzunehmen. Dieser Indikator färbt die Rückseite nicht neu, das Signal dieses Indikators verzögert sich nicht. ================= Empfehlungen: Broker mit niedrigem Spread, jeder Zeitrahmen, aber bleiben Sie besser bei M5 und höher, um den Spread zu schla

RSI Divergence Multicurrency Scanner Dashboard for MT4 ist ein leistungsstarkes Tool, das Händlern hilft, RSI (Relative Strength Index) Divergenzsignale effizient in mehreren Währungspaaren und Zeitrahmen zu erkennen. Dieser Scanner vereinfacht die Identifizierung potenzieller Marktumkehrsignale, indem er eine Echtzeitscannung und Benachrichtigungen direkt von einem zentralen Dashboard bietet. Egal, ob Sie mit Hauptwährungspaaren, Nebenwährungspaaren oder exotischen Paaren handeln, der Scanner b

Candlestick Pattern Scanner Dashboard MT4 ist ein leistungsstarkes Werkzeug zur Überwachung von Candlestick-Mustern auf mehreren Währungspaaren und Zeitrahmen. Es organisiert die erkannten Muster in einem Gitterformat, zeigt die Kurzform des Musters und die Anzahl der Kerzen an, seitdem es aufgetreten ist (z. B. BUEN(3) für ein Bullish Engulfing-Muster, das vor drei Kerzen erkannt wurde). Die MT5-Version finden Sie hier: CandleStick Patterns Multicurrency Scanner MT5 Für detaillierte Dokumentat

Trend Oscillator – ist ein erweiterter benutzerdefinierter Crypto_Forex-Indikator, ein effizientes Handelstool!
- Es wird eine erweiterte neue Berechnungsmethode verwendet – 20 Optionen für den Parameter „Preis für Berechnung“. - Der sanfteste Oszillator, der je entwickelt wurde. - Grüne Farbe für Aufwärtstrends, Rote Farbe für Abwärtstrends. - Überverkaufte Werte: unter 5, überkaufte Werte: über 95. - Es gibt viele Möglichkeiten, selbst Standardstrategien mit diesem Indikator zu verbessern. -
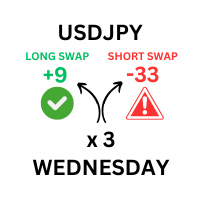
Dieses Tool wurde entwickelt, um detaillierte Swap-Kurse für alle verfügbaren Währungspaare auf Ihrer Handelsplattform anzuzeigen.
Es ermöglicht Händlern, sowohl Long- als auch Short-Swap-Werte schnell in einem separaten, optisch verbesserten Fenster anzuzeigen.
Dieses Tool bietet benutzerdefinierte Eingaben für die Losgröße und gewährleistet präzise Berechnungen auf Basis der aktuellen Swap-Sätze und des Handelsvolumens.
Darüber hinaus wird der Zeitpunkt angegeben, zu dem die Swap-Gebühren
Achtung, damit der Indikator richtig funktioniert, müssen Sie den Ordner "MQL5" in Ihren Terminal-Ordner legen. Sie können ihn über den folgenden Link herunterladen: https://disk.yandex.ru/d/DPyo0ntaevi_2A
Einer der besten Pfeilindikatoren für binäre Optionen, der auch auf dem Forex-Markt verwendet werden kann. Jeder Zeitrahmen von M1 bis MN, jedes Währungspaar, kann auch auf Aktien verwendet werden - der Indikator ist universell. Verfall von 1 bis 5 Kerzen. Zeigt Verkehrsstatistiken in einem D
FREE

Der Bullish and Bearish Engulfing Pattern Screener für MetaTrader 4 ist ein leistungsstarkes Tool für Händler, die wichtige Umkehrmuster an den Finanzmärkten erkennen möchten. Dieser Indikator durchsucht Preisdiagramme nach bullischen und bearischen Engulfing-Mustern, die potenzielle Trendumkehrungen signalisieren. Hauptmerkmale: Scannen in Echtzeit : Analysiert fortlaufend die Kursdaten, um sofortige Warnungen zu liefern, wenn Engulfing-Muster erkannt werden. Anpassbare Einstellungen : Ermöglic
FREE

Der Statistische Trendindikator ist ein fortschrittlicher benutzerdefinierter Indikator, der Marktbewegungen analysiert und Händlern berechnete Wahrscheinlichkeiten für Aufwärts- oder Abwärtstrends liefert. Durch die Analyse historischer Kursdaten über einen bestimmten Rückblickzeitraum berechnet dieser Indikator die Wahrscheinlichkeit, dass sich der Markt in eine der beiden Richtungen fortsetzt und bietet Händlern einen statistischen Vorteil bei der Entscheidungsfindung.
Hauptmerkmale: Wahrsc

ADX Shark Scalper - Der ultimative Hybrid-Indikator für präzises Scalping Tauchen Sie ein in die Märkte mit dem ADX Shark Scalper , einem leistungsstarken und vielseitigen Tool für Händler, die bei jedem Handel Präzision suchen. Dieser hochmoderne Indikator kombiniert nahtlos mehrere fortschrittliche technische Signale in einem optimierten System, mit dem Sie mühelos gute Kauf- und Verkaufschancen erkennen können. Im Kern nutzt der ADX Shark Scalper die Kraft der Trend- und Momentum-Erkennung du

Vondereich MTF Strength System - Das ultimative BBMA Dashboard für MT4 Übersicht Verschwenden Sie keine Zeit mehr damit, Dutzende von Charts manuell zu scannen!
Das Vondereich MTF Strength System ist ein professionelles Dashboard für Trader, die der BBMA (Bollinger Bands & Moving Averages) Methodik folgen. Es scannt automatisch mehrere Paare und Zeitrahmen und hebt Setups mit hoher Wahrscheinlichkeit hervor, wie z. B. Re-entry, CSM, MHV und Extreme . Dank der übersichtlichen und reaktions

Leonardo Breakout SMC - Fortgeschrittener Handelsindikator
Übersicht Der Leonardo Breakout SMC ist ein Meisterwerk an Präzision und Innovation, geschaffen für alle, die die unsichtbaren Kräfte des Marktes verstehen und nutzen wollen. So wie Da Vinci die natürliche Welt mit akribischer Detailgenauigkeit beobachtete, enthüllt dieser MetaTrader 4 (MT4) Indikator die verborgenen Strukturen der Preisbewegung und ermöglicht es Händlern, die Essenz von Smart-Money-Konzepten (SMC) zu erfassen und make
FREE
MetaTrader Market - Handelsroboter und technische Indikatoren stehen Ihnen direkt im Kundenterminal zur Verfügung.
Das MQL5.community Zahlungssystem wurde für die Services der MetaTrader Plattform entwickelt und steht allen registrierten Nutzern der MQL5.com Webseite zur Verfügung. Man kann Geldmittel durch WebMoney, PayPal und Bankkarten einzahlen und sich auszahlen lassen.
Sie verpassen Handelsmöglichkeiten:
- Freie Handelsapplikationen
- Über 8.000 Signale zum Kopieren
- Wirtschaftsnachrichten für die Lage an den Finanzmärkte
Registrierung
Einloggen
Wenn Sie kein Benutzerkonto haben, registrieren Sie sich
Erlauben Sie die Verwendung von Cookies, um sich auf der Website MQL5.com anzumelden.
Bitte aktivieren Sie die notwendige Einstellung in Ihrem Browser, da Sie sich sonst nicht einloggen können.