MultiDimensional Momentum
- Indicateurs
-
Vincent Jose Proenca
 Je suis trader depuis plus de dix ans, spécialisé principalement sur les CFD. Ce que j’aime dans le trading, c’est la logique, la discipline et la création d’outils qui simplifient la prise de décision. Ne trouvant pas d’indicateurs qui collent à mon approche, j’ai commencé à les coder — d’abord par
 - Version: 2.10
- Activations: 5
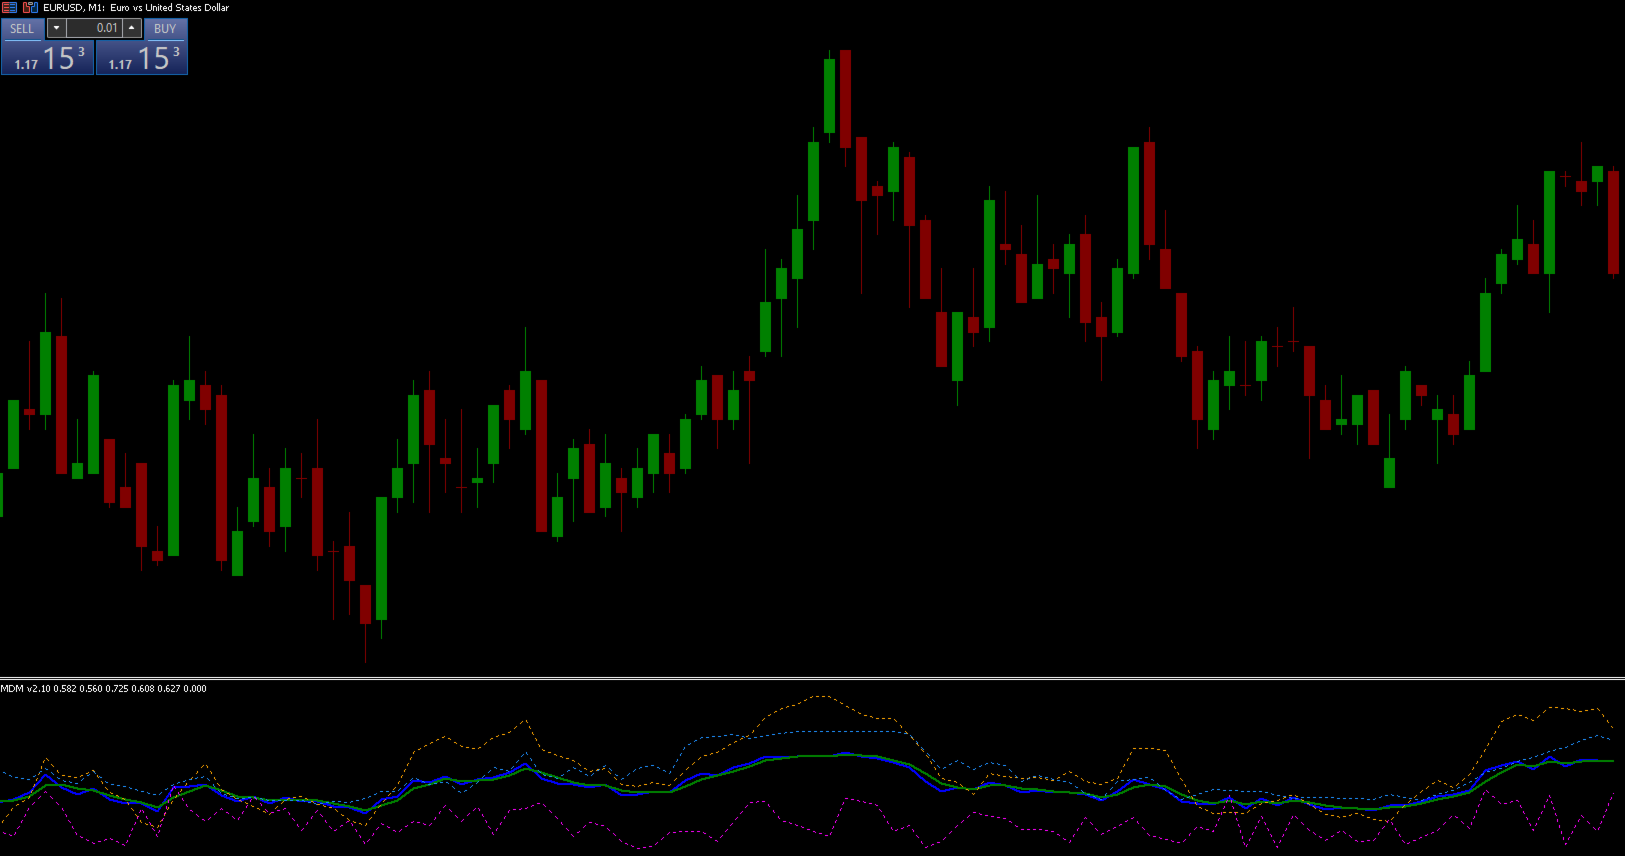
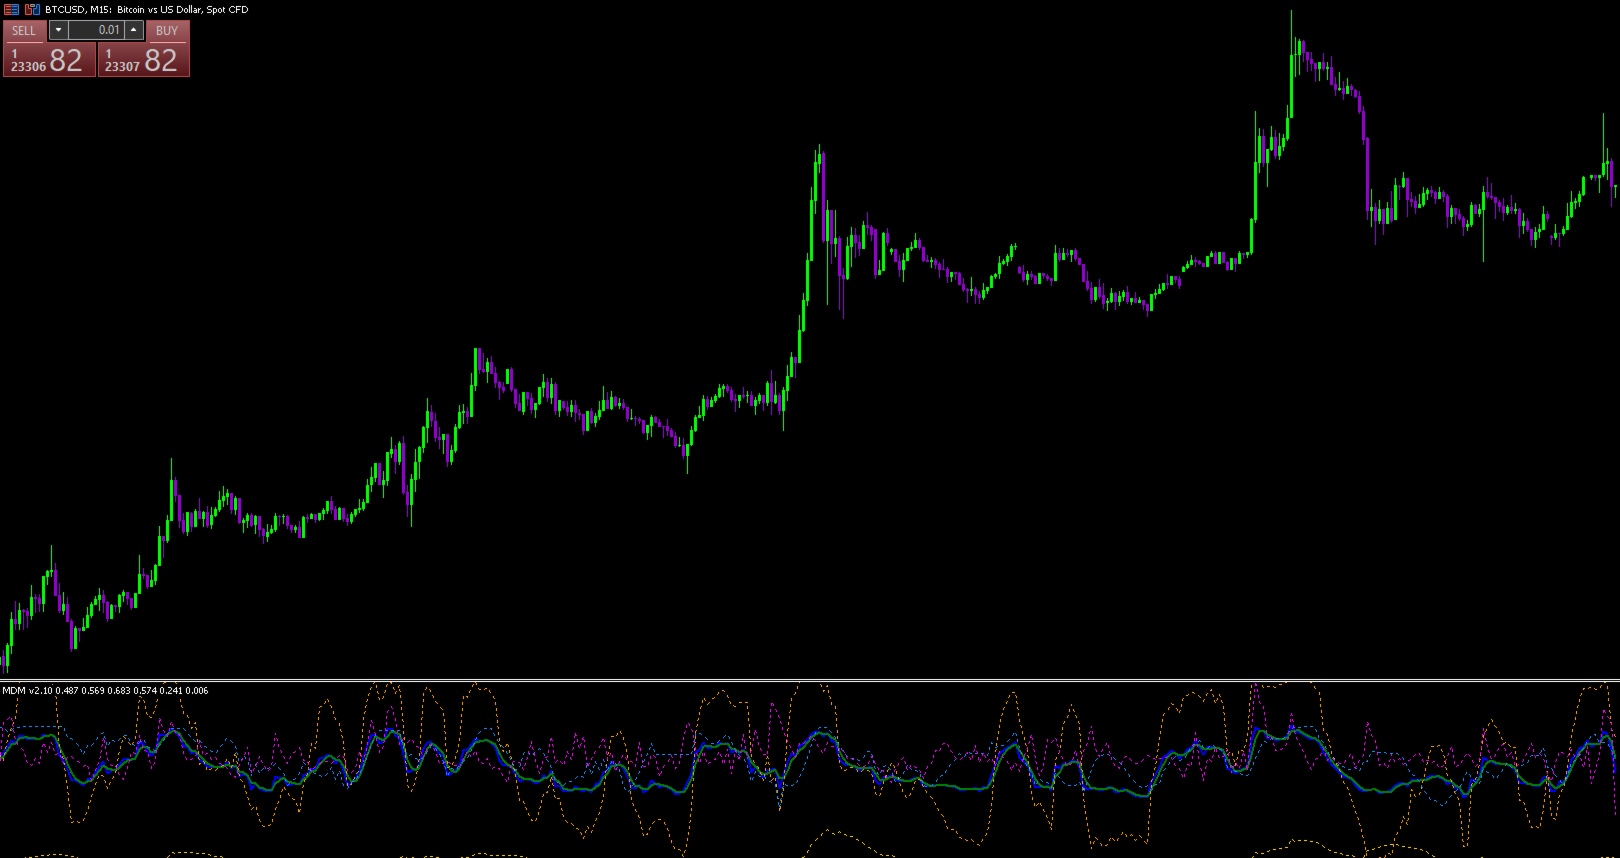
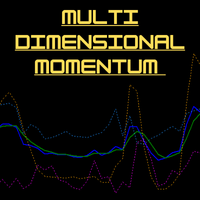
MDM indicator is the IMM (Integrated Market Momentum) line, which oscillates between 0 and 1. Here's how to interpret it:
-
General Interpretation of the IMM Line: The indicator calculates this final value by combining momentum, trend, volume, aggressiveness, and price strength scores
. Generally, readings above 0.50 suggest a strong bullish zone, while readings below 0.50 suggest a strong bearish zone. The area between 0.45 and 0.55 is often considered neutral or consolidating.
Generating Trading Signals: You can use the interaction between the two main lines to find potential entry and exit points.
-
A buy signal may be considered when the Smoothed IMM (green line) is above 0.50 and shows a strong, sustained rise, especially if confirmed by strong momentum and trend components.
-
A sell signal may be considered when the Smoothed IMM (green line) is below 0.50 and shows a strong, sustained decline.
-
Look for situations where the main blue line crosses above the green smoothed line as a confirmation of strengthening momentum, and vice versa.
Using the Components for Confirmation: For a higher-probability signal, check if the individual component dots align
:
-
A strong buy signal is more convincing if the Momentum (orange), Trend (blue), and Volume (magenta) dots are also at high levels.
-
A strong sell signal is more reliable if these same components are at low levels.
-
High Aggressiveness (gold) can indicate that a strong price move is underway, but it can also precede a period of volatility or a reversal.