
自定义指标(第一部份):在MQL5中逐步开发简单自定义指标的入门指南
简介
将市场信息进行可视化呈现是交易的基石。如果没有对市场数据和价格进行可视化建模的能力,交易就不会如此高效。从早期的图表绘制到如今复杂的技术分析工具,交易者一直依赖视觉线索来在金融市场中做出明智的决策。
MQL5指标是强化视觉分析能力的有力工具。通过数学计算和算法,MQL5指标统计并识别市场行为来帮助交易者识别盈利机会。这些指标可以直接应用于价格图表,为交易者提供关于市场动态的真知灼见。
在本系列文章中,我们将探讨如何创建、自定义和使用MQL5指标来增强MetaTrader 5中的交易策略。从基本的指标逻辑到高级的自定义选项,我们将涵盖基础知识,并随着一系列文章的推进,逐渐深入到指标开发的更高级概念。本系列文章的主要目的是让你能够创建符合自己交易偏好和交易目标的MQL5自定义指标。
什么是指标?
指标是一种用于分析过去价格数据并预测未来价格走势的工具。指标主要侧重于市场数据分析,而非执行交易。它们不能开立、修改或关闭头寸和订单。它们仅提供相关的指示,而不执行交易。
从本质上讲,指标是将数学计算或算法应用于历史价格数据,以生成市场行为的可视化形式,并随着实时数据的更新而更新其状态。
这些视觉效果可以是多种形式,包括折线图、蜡烛图、直方图、箭头或价格图表上的叠加层。指标通过突出显示趋势、识别潜在的反转或发出超买或超卖信号,帮助交易者解读市场动态。
根据功能的不同,指标可以分为不同类别,如趋势跟踪指标、动量指标、波动率指标和成交量指标。
MQl5中的指标类型
MQL5中有两种类型的指标类型,即技术指标和自定义指标。
1. 技术指标
技术指标是MetaTrader 5中预加载的默认指标。它们包括一系列交易者可轻松获取的技术指标,交易者可以将这些指标加载到MetaTrader 5图表中对市场走势进行分析。这些指标包括振荡器、趋势跟踪和基于成交量的指标等热门工具。
这些标准指标的源代码无法直接查看或修改,因为它们已内置于MetaTrader 5平台中。唯一能从您的MQL5代码中访问它们的方式是使用预定义的MQL5技术指标函数标准程序语言。这一功能使我们能够使用MQL5来升级或自定义这些标准指标,以创建新的高级自定义指标和交易工具。在本文后续部分,我将展示如何扩展技术指标的功能,我们将开发一个基于平滑彩色K线图的自定义指标。
标准MetaTrader 5技术指标的例子包括:
- iMA(简单移动平均):计算指定价格序列的简单移动平均值。
- iRSI(相对强弱指数):通过衡量近期价格变动的幅度来评估超买或超卖状况。
- iMACD(移动平均线收敛/发散指标):通过分析两条移动平均线的收敛和发散来识别趋势方向和潜在的反转点。
2. 自定义指标
顾名思义,自定义指标是您可以自行构建来分析金融市场的技术分析工具。它们与内置指标的不同之处在于,它们可以根据您自身的交易需求进行特定的计算和图形可视化。
作为MQL5程序员,您可以根据自身从任意来源获取到的数据来创建指标。您还可以导入已经创建的自定义指标,或者扩展和修改系统内预置的MQL5技术指标,以构建更复杂和高级的自定义指标,正如我们将要做的那样。
自定义指标的好处
一下是一些自定义指标的性质和优点:
计算上的无与伦比的灵活性:- 您可以设计自定义指标来使用您所能想到的任何技术指标公式或交易策略。
- 使用MQL5,您可以探索各种自定义指标的算法和数学模型,以满足您的特定需求。
- 您可以自定义指标结果在图表上的显示方式。
- MQL5提供了使用线条样式、蜡烛图、箭头、颜色对象以及许多其他图形元素的选项,以创建与您交易风格相匹配的清晰且信息丰富的可视化效果。
- MQL5不仅仅提供从零开始创建指标的功能。
- 您还可以利用除典型价格数据之外的其他外部数据源,来创建一系列技术或基本面分析指标。
- 导入其他MQL5程序员创建的内置自定义指标,以改进或扩展其功能。
- 通过扩展和修改内置指标,您可以创建出符合您独特交易需求的复杂自定义指标。
结合这些功能,MQL5使您能够创建不仅能满足您技术分析需求的、还能融入传统价格指标之外的数据和算法的自定义指标。
MetaTrader 5终端中的免费自定义指标示例MetaTrader 5终端还提供了一系列指标样例,您可以访问并使用它们,或者通过研究这些样例来更好地理解MQL5中的指标开发。MetaTrader 5中免费的样例指标源代码易于获取,是MQL5程序员学习和尝试创建指标时的重要资源。MQL5样例指标存储在MetaTrader 5安装目录中的MQL5\Indicators\Examples和MQL5\Indicators\Free Indicators文件夹内。
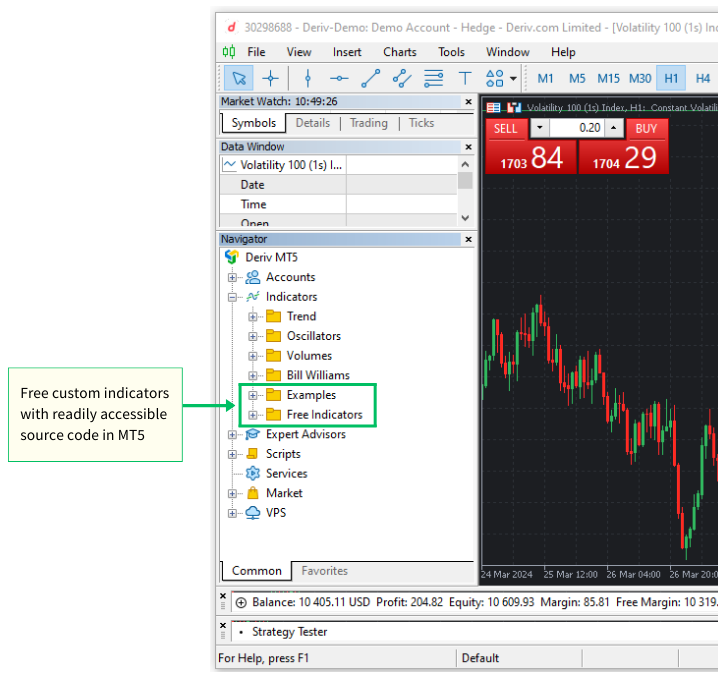
通过研究并修改样例指标,您可以深入了解MQL5的编程技巧、指标的逻辑以及最佳的编程实践。这种亲身实践的方法有助于学习,并使您能够开发出符合自己特定交易目标的自定义指标。
MQL5自定义指标的基本构建模块
在学习MQL5中自定义指标的开发之前,了解MQL5指标的基本结构是至关重要的。通过熟悉指标的关键组件和功能,您将能够更有效地在MetaTrader 5中创建、修改和使用指标。
自定义指标文件(.mq5)
MQL5指标通常存储在一个带有".mq5"扩展名的文件中。该文件包含用MQL5编程语言编写的源代码,定义了指标的逻辑和运行方式。所有指标都存储在MetaTrader 5安装目录中的MQL5\Indicators文件夹内。
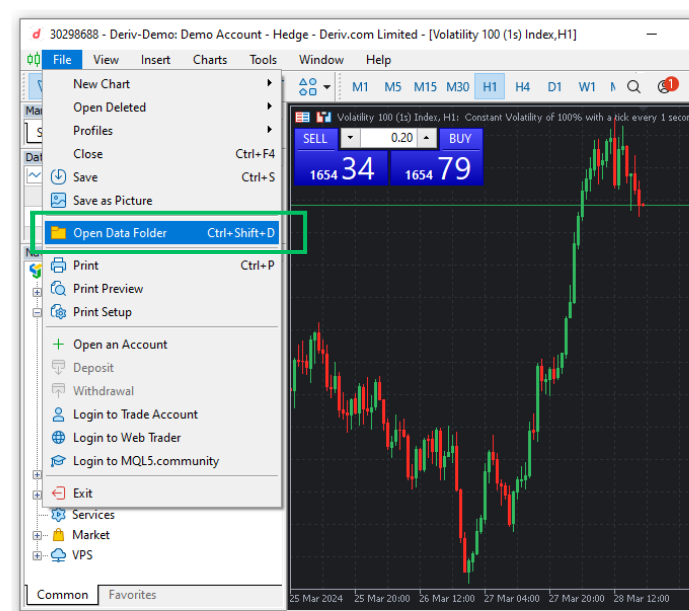
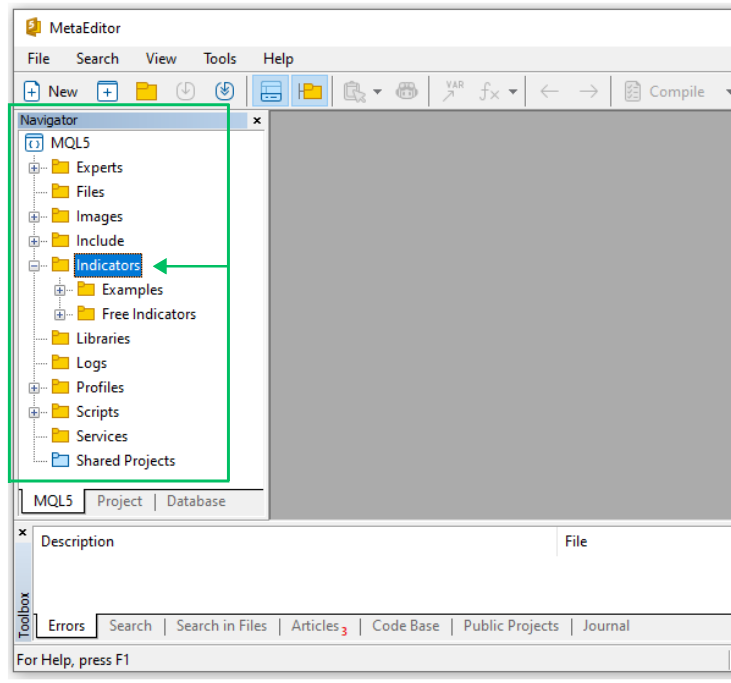
您可以使用在MetaTrader 5交易终端和MetaEditor中都能找到的Navigator面板来访问Indicators文件夹。您还可以通过以下两种方法使用"MQL5"文件夹访问Indicator文件夹:
如何从MetaTrader 5交易终端访问指标文件:
- 点击菜单上方的“File”。
- 选择“打开数据文件夹”或使用键盘快捷键(Ctrl + Shift + D)。
- 导航到“MQL5/Indicators”文件夹。
如何从MetaEditor访问指标文件:
- MetaEditor的Navigator(导航器)面板默认位于MetaEditor窗口的左侧,可以直接访问MQL5文件夹。
- 如果Navigator(导航器)面板被禁用,您可以通过使用键盘快捷键(Ctrl + D)来启用它,或者在MetaEditor 5窗口顶部的View(视图)菜单选项中找到并点击它。在那里,选择标有Navigator(导航器)的选项。选择此选项将启用导航面板,使您可以访问MQL5文件夹。
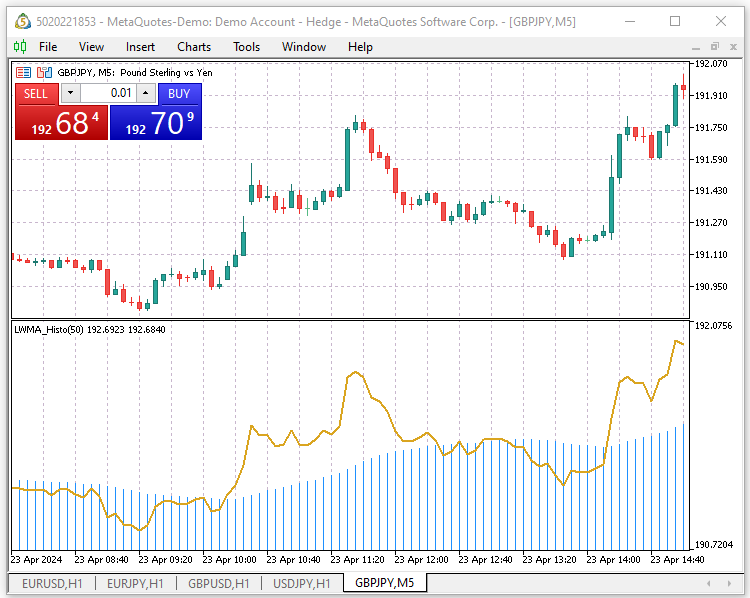
示例1:线性移动平均直方图自定义指标 - (LinearMovingAverageHistogram.mq5) 让我们创建一个自定义指标,以便我们直观地了解构建自定义指标所需的不同的代码组成部分。在这次演示中,我们将我们的第一个自定义指标命名为'LinearMovingAverageHistogram'。它将在价格图下方的单独窗口中绘制一个线性加权移动平均直方图,以及一条表示当前价格的线。
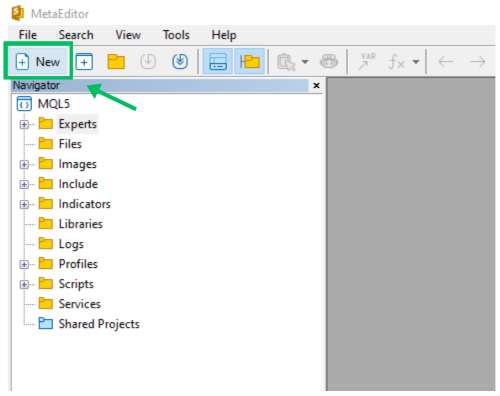
让我们开始使用MQL5向导创建一个新的自定义指标文件。
如何使用MQL5向导创建新的自定义指标文件
步骤1:打开MetaEditor IDE,并通过“新建”菜单项按钮启动“MQL向导”。
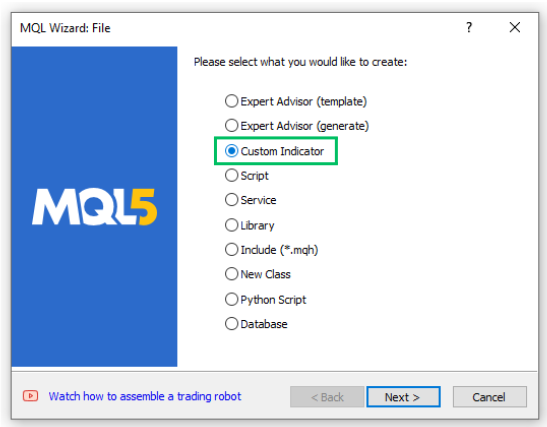
步骤2:选择“自定义指标”选项,并点击“下一步”。
步骤3:在“常规属性”部分,为您的新自定义指标填写文件夹和名称“Indicators\Article\LinearMovingAverageHistogram”,然后点击“下一步”。
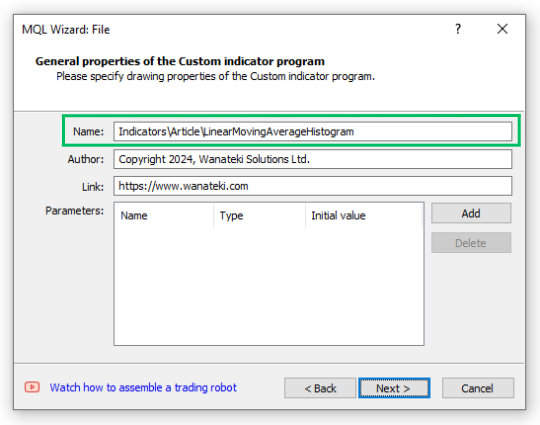
步骤4:在“事件处理程序”部分,选择第二个“OnCalculate(...,prices)”选项,不选中OnTimer和OnChartEvent复选框,然后点击“下一步”继续。
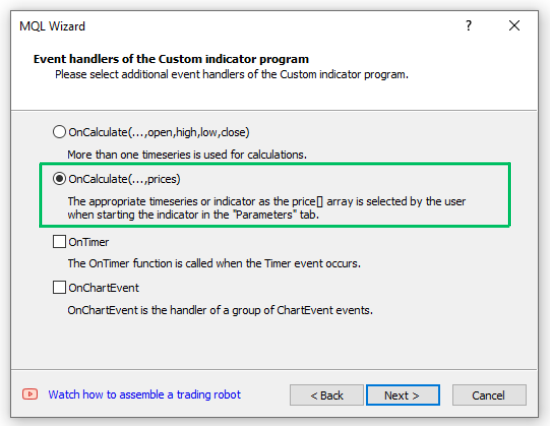
步骤5:在“绘图属性”部分,选中或启用“在单独窗口中显示指标”复选框。取消选中或禁用“最小值”和“最大值”复选框,并将“绘图”文本输入框留空。点击“完成”以生成新的MQL5自定义指标文件。
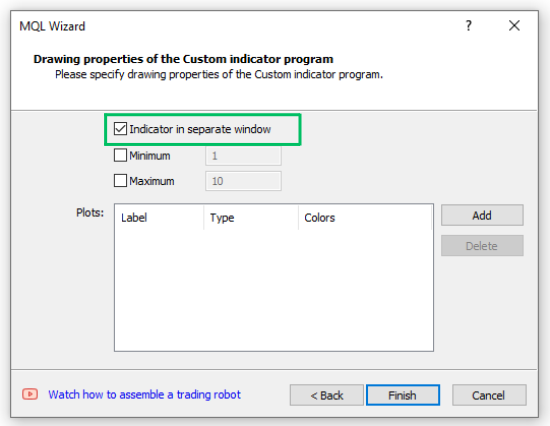
在“MQL5/Indicators”文件夹中,您会找到一个名为“Article”的新子文件夹。这个子文件夹包含了我们刚刚创建的自定义指标文件“LinearMovingAverageHistogram.mq5”。作为演示的一部分,我们将在本文中编写几个自定义指标。为了保持适当的文件结构,我们将把所有指标文件保存在这个新的“Articles”文件夹中。
现在我们有了一个新的MQL5自定义指标文件,它只包含必要的函数(OnInit和OnCalculate)。记住先保存新文件,然后再继续。以下是我们新生成的自定义指标代码:
//+------------------------------------------------------------------+
//|                                 LinearMovingAverageHistogram.mq5 |
//|                          Copyright 2024, Wanateki Solutions Ltd. |
//|                                         https://www.wanateki.com |
//+------------------------------------------------------------------+
#property copyright "Copyright 2024, Wanateki Solutions Ltd."
#property link      "https://www.wanateki.com"
#property version   "1.00"
#property indicator_separate_window
//+------------------------------------------------------------------+
//| Custom indicator initialization function                         |
//+------------------------------------------------------------------+
int OnInit()
  {
//--- indicator buffers mapping

//---
   return(INIT_SUCCEEDED);
  }
//+------------------------------------------------------------------+
//| Custom indicator iteration function                              |
//+------------------------------------------------------------------+
int OnCalculate(const int rates_total,
                const int prev_calculated,
                const int begin,
                const double &price[])
  {
//---

//--- return value of prev_calculated for next call
   return(rates_total);
  }
//+------------------------------------------------------------------+
自定义指标文件(.mq5)的基本组成部分。 指标文件由多个部分组成。让我们分析指标代码的不同部分是如何工作的:
头部区域。 指标头部区域由三部分组成:头部注释、属性指令、外部包含文件和全局变量定义。
以下是我们指标头部区域所包含内容的分解:
1. 头部注释: 这是我们指标代码的第一个部分。它包含关于指标的注释信息,如文件名、版权信息和作者网站的链接。这些注释对指标代码的功能没有任何影响。
//+------------------------------------------------------------------+
//|                                 LinearMovingAverageHistogram.mq5 |
//|                          Copyright 2024, Wanateki Solutions Ltd. |
//|                                         https://www.wanateki.com |
//+------------------------------------------------------------------+
2. #property指令:#property指令提供了关于指标的额外信息。它们包括版权信息、与指标或作者相关联的链接、指标的当前版本,以及关于如何显示指标的具体指令。最重要的#property指令是"#property indicator_separate_window",它指示平台将指标显示在一个单独的窗口中。
#property copyright "Copyright 2024, Wanateki Solutions Ltd."
#property link      "https://www.wanateki.com"
#property version   "1.00"
#property indicator_separate_window
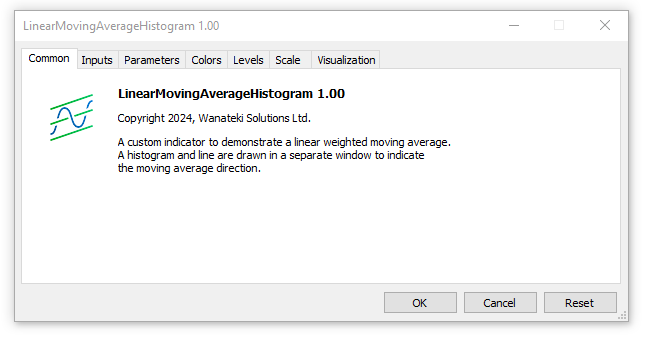
当您在图表上加载指标时,会出现一个小的指标设置子窗口(面板),版权信息、链接、作者和描述的#property指令在该子窗口的“常规”选项卡上可见。
3. 全局变量:所有全局变量都放置在#property指令下方。我们的指标代码目前没有包含全局变量,因为在使用MQL5向导生成文件时我们没有指定它们。在本文中,我们将继续在#property指令下方定义所有的全局变量和用户输入变量。
MQL5标准自定义指标函数:在头部区域下方,您会看到不同的函数。所有指标都必须包含MQL5标准函数OnInit和OnCalculate。用户创建的函数是可选的,但为了代码的良好组织,推荐使用。以下是我们的指标代码中不同函数的概述:1. 指标初始化函数(OnInit()):当指标被初始化时,会调用OnInit()函数。它通常执行设置任务,例如映射指标缓冲区并初始化任何全局变量。随着我们深入文章,我将向您介绍指标缓冲区。当函数成功执行时,它返回INIT_SUCCEEDED;当初始化失败时,它返回INIT_FAILED。
//+------------------------------------------------------------------+
//| Custom indicator initialization function                         |
//+------------------------------------------------------------------+
int OnInit()
  {
//--- indicator buffers mapping

//---
   return(INIT_SUCCEEDED);
  }
2. 指标迭代函数(OnCalculate()):在MQL5中,OnCalculate() 函数是所有自定义指标计算的主要神经中枢。每当价格数据发生变化时,就会调用此函数,从而促使指标更新其值。OnCalculate() 函数主要有两个版本,我将在文章后面进一步解释。
//+------------------------------------------------------------------+
//| Custom indicator iteration function                              |
//+------------------------------------------------------------------+
int OnCalculate(const int rates_total,
                const int prev_calculated,
                const int begin,
                const double &price[])
  {
//---

//--- return value of prev_calculated for next call
   return(rates_total);
  }
3. 指标反初始化函数(OnDeinit()):虽然OnDeinit()函数尚未添加到我们的代码中,但它是一个非常重要的函数。当指标终止时,会调用此函数,并负责执行反初始化过程。它通常执行所有清理任务,例如释放任何技术指标句柄。
//+------------------------------------------------------------------+
//| Indicator deinitialization function                              |
//+------------------------------------------------------------------+
void OnDeinit(const int reason)
  {
   //-- deinitialization code
  }
//+------------------------------------------------------------------+
当我们编译指标代码时,遇到了一个警告:“没有为指标定义指标绘图”。

这个警告表明我们的自定义指标缺少了一个关键定义,即如何在图表上显示其数据。正如预期的那样,我们当前的指标代码只是一个没有任何功能组件的空壳。为了解决这个问题,让我们深入研究并编写将使我们的指标焕发活力的关键代码段。
描述属性(Property)指令 :让我们首先在指标头部区域编写自定义指标的简短描述:
#property description "A custom indicator to demonstrate a linear weighted moving average." #property description "A histogram and line are drawn in a separate window to indicate " #property description "the moving average direction."缓冲区与绘图属性指令:所有自定义指标都具有不同的属性,这些属性总是位于文件的开头,我之前已经详细阐述过。其中一些是可选的,但以下三个属性总是必需的:
- indicator_separate_window or indicator_chart_window: :用于指定指标是将在单独的窗口中绘制还是直接在图表窗口中绘制。
- indicator_buffers: 确定自定义指标所使用的指标缓冲区数量。
- indicator_plots:指定自定义指标所使用的绘图数量
为了满足这一要求,我们将定义指标缓冲区和绘图属性。在indicator_separate_window属性下,我们给出指定指标缓冲区和绘图的代码。指标缓冲区和绘图用于在图表上显示指标数据。我们使用属性(property)指令来设置用于计算指标的缓冲区数量。这个数量是一个介于1到512之间的整数。由于这是一个预处理指令,在源代码预处理阶段还不存在变量,因此我们必须指定一个数字(1到512之间)作为值。
我们需要两个指标缓冲区和两个绘图区来存储和绘制我们的新自定义指标数据。一个指标缓冲区用于直方图,另一个用于显示交易品种当前的价格线。接着是一个用于直方图的绘图,另一个是用于价格线的绘图。
//--- indicator buffers and plots
#property indicator_buffers 2
#property indicator_plots   2
标签、类型和样式属性指令
接下来,我们将要确定其他更为详细的信息,如直方图和价格线的指标标签、类型、颜色、样式和宽度。
//--- plots1 details for the ma histogram
#property indicator_label1  "MA_Histogram"
#property indicator_type1   DRAW_HISTOGRAM
#property indicator_color1  clrDodgerBlue
#property indicator_style1  STYLE_SOLID
#property indicator_width1  1

//--- plots2 details for the price line
#property indicator_label2  "Current_Price_Line"
#property indicator_type2   DRAW_LINE
#property indicator_color2  clrGoldenrod
#property indicator_style2  STYLE_SOLID
#property indicator_width2  2
全局用户输入变量
接下来,我们指定自定义指标的用户输入变量(移动平均周期和位移),这些变量将用于存储不同的指标参数。
//--- input parameters for the moving averages
input int            _maPeriod = 50;       // MA Period
input int            _maShift = 0;         // MA Shift
在全局范围内声明指标缓冲区动态数组
接下来,我们为移动平均直方图和价格线声明指标缓冲区。指标缓冲区是自定义指标的重要组成部分,负责将指标的数据存储在动态数组中。你应该首先声明一个动态数组,然后使用MQL5中的特殊函数SetIndexBuffer将其声明为指标缓冲区,以将其转换为由交易平台特别管理的数组。 完成上述步骤后,交易平台将负责为数组分配内存,并将其作为公共可访问的新时间序列数组,其他指标可以在此基础上进行计算。
我们将首先声明直方图和线条指标缓冲区为动态数组,然后在OnInit()函数中,我们将使用MQL5中的特殊函数'SetIndexBuffer'来声明并将它们转换为交易平台管理的可访问时间序列数组。
//--- indicator buffer
double maHistogramBuffer[], priceLineBuffer[];
自定义指标初始化函数- GetInit()
接下来,我们将创建一个自定义函数,该函数将负责初始化我们的自定义指标。首先,创建一个类型为void的空函数,这意味着它不返回任何数据。将函数命名为'GetInit()'。在函数中设置'SetIndexBuffer(...)'特殊函数,该函数负责将我们之前声明的指标缓冲区动态数组'maHistogramBuffer'和'priceLineBuffer'转换为交易平台管理的时间序列数组。
//+------------------------------------------------------------------+
//| User custom function for custom indicator initialization         |
//+------------------------------------------------------------------+
void GetInit()
  {
//--- set the indicator buffer mapping
   SetIndexBuffer(0, maHistogramBuffer, INDICATOR_DATA);
   SetIndexBuffer(1, priceLineBuffer, INDICATOR_DATA);

  }
//+------------------------------------------------------------------+
接下来,我们将设置指标的精度以匹配交易品种的小数点位数。
//--- set the indicators accuracy
   IndicatorSetInteger(INDICATOR_DIGITS, _Digits + 1);
接着,我们定义起始柱形(bar),我们将从它开始绘制指标。
//--- set the first bar from where the index will be drawn
   PlotIndexSetInteger(0, PLOT_DRAW_BEGIN, _maPeriod);
   PlotIndexSetInteger(1, PLOT_DRAW_BEGIN, 0);
将移动平均指标偏移量设置为用户指定值,并将价格线的偏移量设置为零。这将在绘制或显示指标时使用。
//--- set the indicator shifts when drawing PlotIndexSetInteger(0, PLOT_SHIFT, _maShift); PlotIndexSetInteger(1, PLOT_SHIFT, 0);接下来,我们为来自指标数据缓冲区的指标值设置将在MT5数据窗口中显示的名称。我们使用一个开关控件来设置数据窗口中指标的简称。
//--- set the name to be displayed in the MT5 DataWindow
   IndicatorSetString(INDICATOR_SHORTNAME, "LWMA_Histo" + "(" + string(_maPeriod) + ")");
为了完成指标初始化函数,我们将直方图设置为一个空值。
//--- set the drawing histogram and line to an empty value
   PlotIndexSetDouble(0, PLOT_EMPTY_VALUE, 0.0);
   PlotIndexSetDouble(1, PLOT_EMPTY_VALUE, 0.0);
自定义函数计算线性加权移动平均 - GetLWMA()
接下来,我们需要创建一个名为'GetLWMA(..)'的自定义函数,该函数将负责计算线性加权移动平均。由于我们不希望该函数返回任何数据,因此其类型将为void。该函数将接受四个参数作为函数参数(rates_total, prev_calculated, begin, &price)。
//+------------------------------------------------------------------+
//|  Function to calculate the linear weighted moving average        |
//+------------------------------------------------------------------+
void GetLWMA(int rates_total, int prev_calculated, int begin, const double &price[])
  {
   int    weight = 0;
   int    x, l, start;
   double sum = 0.0, lsum = 0.0;
//--- first calculation or number of bars was changed
   if(prev_calculated <= _maPeriod + begin + 2)
     {
      start = _maPeriod + begin;
      //--- set empty value for first start bars
      for(x=0; x < start; x++)
        {
         maHistogramBuffer[x] = 0.0;
         priceLineBuffer[x] = price[x];
        }
     }
   else
      start = prev_calculated - 1;

   for(x = start - _maPeriod, l = 1; x < start; x++, l++)
     {
      sum   += price[x] * l;
      lsum  += price[x];
      weight += l;
     }
   maHistogramBuffer[start-1] = sum/weight;
   priceLineBuffer[x] = price[x];
//--- main loop
   for(x=start; x<rates_total && !IsStopped(); x++)
     {
      sum             = sum - lsum + price[x] * _maPeriod;
      lsum            = lsum - price[x - _maPeriod] + price[x];
      maHistogramBuffer[x] = sum / weight;
      priceLineBuffer[x] = price[x];
     }
  }
指标中最主要的迭代计算函数 - OnCalculate()
自定义指标迭代函数'OnCalculate(..)'是我们自定义指标的核心,它负责在有新行情或价格变化时更新和绘制指标,所有必要的计算都源自这里。我们目前使用的是OnCalculate()函数的简写形式:
int OnCalculate(const int rates_total,
                const int prev_calculated,
                const int begin,
                const double &price[])
  {
   return(rates_total);
  }
这个函数有四个输入参数或者变量:
- rates_total:此参数保存price[]数组元素的总数值。它作为输入参数传递,用于计算指标值,就像我们之前在使用'GetLWMA(..)'函数时所做的那样。
- prev_calculated:此参数存储上一次调用'OnCalculate(..)'函数时的执行结果。它在计算指标值的算法中起着关键作用,并确保我们不会在每次调用'OnCalculate(..)'函数或发生新的价格变化时,都对整个历史周期进行计算。
- begin:此参数存储价格数组起始值的编号,该编号对应的数据不同于计算。在我们的自定义指标中,这个值是“_maPeriod”,它简单地告诉'OnCalculte(...)'函数,在所有柱线(bar)数量达到“_maPeriod”值之前,暂停所有计算,以确保有足够的柱线(bar)用于指标计算。
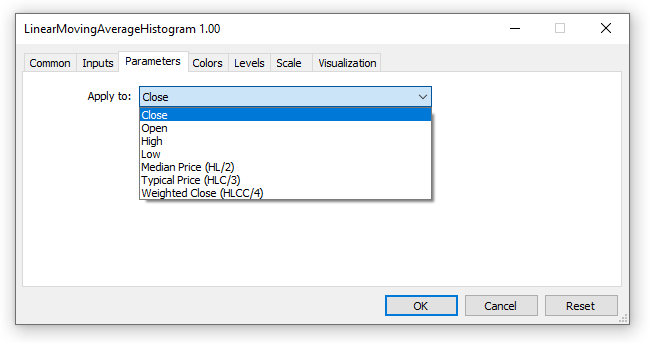
- price:此参数存储用于计算指标数据的价格。当用户在图表上加载自定义指标时,会指定这个价格。用户可以选择开盘价、收盘价、最高价、最低价、中位价(HL / 2)、典型价(HLC / 3)、加权收盘价(HLCC / 4),或者之前加载的指标数据的值。
//+------------------------------------------------------------------+ //| Custom indicator iteration function | //+------------------------------------------------------------------+ int OnCalculate(const int rates_total, const int prev_calculated, const int begin, const double &price[]) { //--- check if we have enough bars to do the calculations if(rates_total < _maPeriod - 1 + begin) return(0); //--- first calculation or number of bars was changed if(prev_calculated == 0) { ArrayInitialize(maHistogramBuffer, 0); PlotIndexSetInteger(0, PLOT_DRAW_BEGIN, _maPeriod - 1 + begin); } //--- calculate the linear weighted moving average and plot it on the chart GetLWMA(rates_total, prev_calculated, begin, price); //--- return value of prev_calculated for next call return(rates_total); } //+------------------------------------------------------------------+现在我们已经有了新创建的自定义指标的所有必要代码段。请确保您的'LinearMovingAverageHistogram'文件看起来与下面的代码完全一致,并且包含了所有必要的组件:
#property version   "1.00"
#property indicator_separate_window

//--- indicator buffers and plots
#property indicator_buffers 2
#property indicator_plots   2

//--- plots1 details for the ma histogram
#property indicator_label1  "MA_Histogram"
#property indicator_type1   DRAW_HISTOGRAM
#property indicator_color1  clrDodgerBlue
#property indicator_style1  STYLE_SOLID
#property indicator_width1  1

//--- plots2 details for the price line
#property indicator_label2  "Current_Price_Line"
#property indicator_type2   DRAW_LINE
#property indicator_color2  clrGoldenrod
#property indicator_style2  STYLE_SOLID
#property indicator_width2  2

//--- input parameters for the moving averages
input int            _maPeriod = 50;       // MA Period
input int            _maShift = 0;         // MA Shift

//--- indicator buffer
double maHistogramBuffer[], priceLineBuffer[];

//+------------------------------------------------------------------+
//| Custom indicator initialization function                         |
//+------------------------------------------------------------------+
int OnInit()
  {
//--- call the custom initialization function
   GetInit();

//---
   return(INIT_SUCCEEDED);
  }
//+------------------------------------------------------------------+
//| Custom indicator iteration function                              |
//+------------------------------------------------------------------+
int OnCalculate(const int rates_total,
                const int prev_calculated,
                const int begin,
                const double &price[])
  {
//--- check if we have enough bars to do the calculations
   if(rates_total < _maPeriod - 1 + begin)
      return(0);

//--- first calculation or number of bars was changed
   if(prev_calculated == 0)
     {
      ArrayInitialize(maHistogramBuffer, 0);
      PlotIndexSetInteger(0, PLOT_DRAW_BEGIN, _maPeriod - 1 + begin);
     }
//--- calculate the linear weighted moving average and plot it on the chart
   GetLWMA(rates_total, prev_calculated, begin, price);

//--- return value of prev_calculated for next call
   return(rates_total);
  }
//+------------------------------------------------------------------+

//+------------------------------------------------------------------+
//| User custom function for custom indicator initialization         |
//+------------------------------------------------------------------+
void GetInit()
  {
//--- set the indicator buffer mapping
   SetIndexBuffer(0, maHistogramBuffer, INDICATOR_DATA);
   SetIndexBuffer(1, priceLineBuffer, INDICATOR_DATA);

//--- set the indicators accuracy
   IndicatorSetInteger(INDICATOR_DIGITS, _Digits + 1);

//--- set the first bar from where the index will be drawn
   PlotIndexSetInteger(0, PLOT_DRAW_BEGIN, _maPeriod);
   PlotIndexSetInteger(1, PLOT_DRAW_BEGIN, 0);

//--- set the indicator shifts when drawing
   PlotIndexSetInteger(0, PLOT_SHIFT, _maShift);
   PlotIndexSetInteger(1, PLOT_SHIFT, 0);

//--- set the name to be displayed in the MT5 DataWindow
   IndicatorSetString(INDICATOR_SHORTNAME, "LWMA_Histo" + "(" + string(_maPeriod) + ")");

//--- set the drawing histogram and line to an empty value
   PlotIndexSetDouble(0, PLOT_EMPTY_VALUE, 0.0);
   PlotIndexSetDouble(1, PLOT_EMPTY_VALUE, 0.0);
  }
//+------------------------------------------------------------------+

//+------------------------------------------------------------------+
//|  Function to calculate the linear weighted moving average        |
//+------------------------------------------------------------------+
void GetLWMA(int rates_total, int prev_calculated, int begin, const double &price[])
  {
   int    weight = 0;
   int    x, l, start;
   double sum = 0.0, lsum = 0.0;
//--- first calculation or number of bars was changed
   if(prev_calculated <= _maPeriod + begin + 2)
     {
      start = _maPeriod + begin;
      //--- set empty value for first start bars
      for(x=0; x < start; x++)
        {
         maHistogramBuffer[x] = 0.0;
         priceLineBuffer[x] = price[x];
        }
     }
   else
      start = prev_calculated - 1;

   for(x = start - _maPeriod, l = 1; x < start; x++, l++)
     {
      sum   += price[x] * l;
      lsum  += price[x];
      weight += l;
     }
   maHistogramBuffer[start-1] = sum/weight;
   priceLineBuffer[x] = price[x];
//--- main loop
   for(x=start; x<rates_total && !IsStopped(); x++)
     {
      sum             = sum - lsum + price[x] * _maPeriod;
      lsum            = lsum - price[x - _maPeriod] + price[x];
      maHistogramBuffer[x] = sum / weight;
      priceLineBuffer[x] = price[x];
     }
  }
当您保存并编译自定义指标时,您会发现现在它没有任何警告或错误。打开您的MetaTrader 5交易平台,在图表中加载并测试它。
更多的实际例子
既然您已经熟悉了构建自定义指标的基本模块,我们应该创建一些简单的自定义指标来巩固这些知识。在下面的示例中,我们将遵循之前定义的所有步骤,并实现自定义指标的所有基本功能。
样例 2:Spread Monitor自定义指标 - (SpreadMonitor.mq5)
让我们继续动手实践,创建另一个简单的自定义指标,该指标使用点差数据在单独窗口中显示一个彩色柱状图。这个指标对于使用浮动点差的交易品种非常有用,它将以直观且易于分析的方式帮助您监控点差如何随时间波动或急剧变化。像之前一样,使用MQL向导来创建一个新的自定义指标文件,并命名为'SpreadMonitor.mq5'。请记住将其保存在'Article'文件夹中,以保持文件结构的整洁和有序。
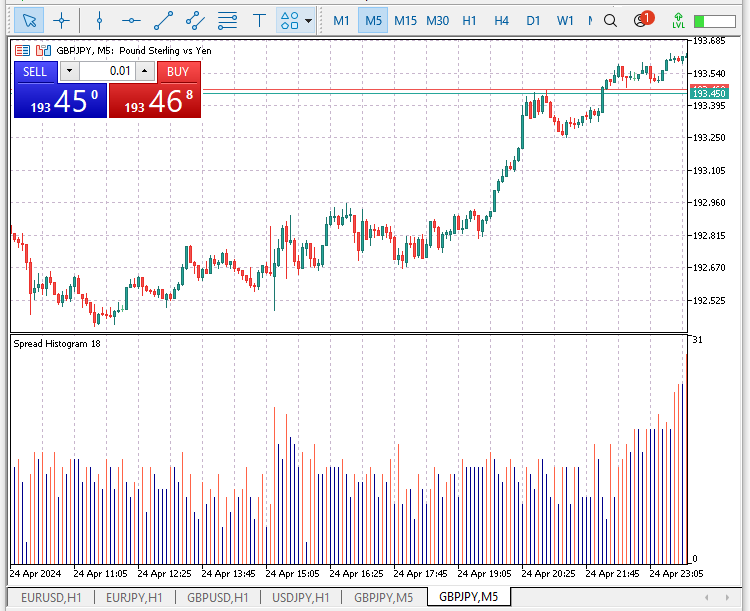
在这个例子中,我将展示如何创建一个含多种颜色图形的指标。当当前点差高于之前点差时,柱状图将变为红色,以表示点差增加;而当当前点差低于之前点差时,柱状图将变为蓝色,以表示点差正在减小。这个自定义指标的功能在具有浮动点差的交易品种上观察效果最佳。当该指标加载到图表上时,只需快速浏览一眼,就能轻松发现点差迅速飙升的时期。
在使用MQL向导生成了新的'SpreadMonitor.mq5'自定义指标文件后,请添加以下代码。
首先,需要指定指标将在哪里显示:
//--- indicator window settings
#property indicator_separate_window
指定指示器缓冲区和图表的数量:
//--- indicator buffers and plots
#property indicator_buffers 2
#property indicator_plots   1
设置指标类型,样式并确定不同的颜色:
//--- indicator type and style settings
#property indicator_type1   DRAW_COLOR_HISTOGRAM
#property indicator_color1  clrDarkBlue, clrTomato
#property indicator_style1  0
#property indicator_width1  1
#property indicator_minimum 0.0
在全局作用域中声明指示器缓冲区的动态数组:
//--- indicator buffers
double spreadDataBuffer[];
double histoColorsBuffer[];
创建一个自定义函数,该函数将负责初始化我们的指标。
//+------------------------------------------------------------------+
//| User custom function for custom indicator initialization         |
//+------------------------------------------------------------------+
void GetInit(){
}
//+------------------------------------------------------------------+
在我们新的指标初始化函数 'GetInit()' 中。定义并映射指示器缓冲区:
//--- set and register the indicator buffers mapping
   SetIndexBuffer(0, spreadDataBuffer, INDICATOR_DATA);
   SetIndexBuffer(1, histoColorsBuffer, INDICATOR_COLOR_INDEX);
将要在MetaTrader 5的DataWindow中显示并作为指标子窗口标签的名称设置为:
//--- name for mt5 datawindow and the indicator subwindow label
   IndicatorSetString(INDICATOR_SHORTNAME,"Spread Histogram");
设置指标值的小数位数(精度):
//--- set the indicators accuracy digits
   IndicatorSetInteger(INDICATOR_DIGITS, 0);
下一步是创建自定义函数计算点差。让我们将这个函数命名为“GetSpreadData()”,并指定其含有三个参数或自变量。由于我们不需要这个函数返回任何数据,因此它的类型为void(无返回值):
//+------------------------------------------------------------------+
//| Custom function for calculating the spread                       |
//+------------------------------------------------------------------+
void GetSpreadData(const int position, const int rates_total, const int& spreadData[])
  {
   spreadDataBuffer[0] = (double)spreadData[0];
   histoColorsBuffer[0] = 0.0;
//---
   for(int x = position; x < rates_total && !IsStopped(); x++)
     {
      double currentSpread = (double)spreadData[x];
      double previousSpread = (double)spreadData[x - 1];

      //--- calculate and save the spread
      spreadDataBuffer[x] = currentSpread;
      if(currentSpread > previousSpread)
        {
         histoColorsBuffer[x] = 1.0; //-- set the histogram to clrTomato
        }
      else
        {
         histoColorsBuffer[x] = 0.0; //-- set the histogram to clrDarkBlue
        }
     }
//---
  }
//+------------------------------------------------------------------+
一个空的OnCalculate()函数是无法运行自定义指标。在这个例子中,我们将使用OnCalculate()的长版本,该版本使用十个参数来存储和处理自定义指标的数据。
//+------------------------------------------------------------------+
//| Custom indicator iteration function                              |
//+------------------------------------------------------------------+
int OnCalculate(const int rates_total,
                const int prev_calculated,
                const datetime &time[],
                const double &open[],
                const double &high[],
                const double &low[],
                const double &close[],
                const long &tick_volume[],
                const long &volume[],
                const int &spread[])
  {
//--- check if we have enough data start calculating
   if(rates_total < 2) //--- don't do any calculations, exit and reload function
      return(0);

//--- we have new data, starting the calculations
   int position = prev_calculated - 1;

//--- update the position variable
   if(position < 1)
     {
      spreadDataBuffer[0] = 0;
      position = 1;
     }
//--- calculate and get the tick volume
   GetSpreadData(position, rates_total, spread);

//--- Exit function and return new prev_calculated value
   return(rates_total);
  }
“SpreadMonitor”自定义指标即将完成,让我们将所有不同的代码段组合在一起,并在编译之前保存文件,然后将其加载到MetaTrader 5的图表中。
//--- indicator window settings
#property indicator_separate_window

//--- indicator buffers and plots
#property indicator_buffers 2
#property indicator_plots   1

//--- indicator type and style settings
#property indicator_type1   DRAW_COLOR_HISTOGRAM
#property indicator_color1  clrDarkBlue, clrTomato
#property indicator_style1  0
#property indicator_width1  1
#property indicator_minimum 0.0

//--- indicator buffers
double spreadDataBuffer[];
double histoColorsBuffer[];

//+------------------------------------------------------------------+
//| Custom indicator initialization function                         |
//+------------------------------------------------------------------+
int OnInit()
  {
//--- initialize the indicator
   GetInit();

   return(INIT_SUCCEEDED);
  }

//+------------------------------------------------------------------+
//| Custom indicator iteration function                              |
//+------------------------------------------------------------------+
int OnCalculate(const int rates_total,
                const int prev_calculated,
                const datetime &time[],
                const double &open[],
                const double &high[],
                const double &low[],
                const double &close[],
                const long &tick_volume[],
                const long &volume[],
                const int &spread[])
  {
//--- check if we have enough data start calculating
   if(rates_total < 2) //--- don't do any calculations, exit and reload function
      return(0);

//--- we have new data, starting the calculations
   int position = prev_calculated - 1;

//--- update the position variable
   if(position < 1)
     {
      spreadDataBuffer[0] = 0;
      position = 1;
     }
//--- calculate and get the tick volume
   GetSpreadData(position, rates_total, spread);

//--- Exit function and return new prev_calculated value
   return(rates_total);
  }

//+------------------------------------------------------------------+
//| Custom function for calculating the spread                       |
//+------------------------------------------------------------------+
void GetSpreadData(const int position, const int rates_total, const int& spreadData[])
  {
   spreadDataBuffer[0] = (double)spreadData[0];
   histoColorsBuffer[0] = 0.0;
//---
   for(int x = position; x < rates_total && !IsStopped(); x++)
     {
      double currentSpread = (double)spreadData[x];
      double previousSpread = (double)spreadData[x - 1];

      //--- calculate and save the spread
      spreadDataBuffer[x] = currentSpread;
      if(currentSpread > previousSpread)
        {
         histoColorsBuffer[x] = 1.0; //-- set the histogram to clrTomato
        }
      else
        {
         histoColorsBuffer[x] = 0.0; //-- set the histogram to clrDarkBlue
        }
     }
//---
  }
//+------------------------------------------------------------------+

//+------------------------------------------------------------------+
//| User custom function for custom indicator initialization         |
//+------------------------------------------------------------------+
void GetInit()
  {
//--- set and register the indicator buffers mapping
   SetIndexBuffer(0, spreadDataBuffer, INDICATOR_DATA);
   SetIndexBuffer(1, histoColorsBuffer, INDICATOR_COLOR_INDEX);

//--- name for mt5 datawindow and the indicator subwindow label
   IndicatorSetString(INDICATOR_SHORTNAME,"Spread Histogram");

//--- set the indicators accuracy digits
   IndicatorSetInteger(INDICATOR_DIGITS, 0);
  }
//+------------------------------------------------------------------+
以下是加载在MetaTrader 5的GBPJPY五分钟图表上的SpreadMonitor自定义指标。
示例3:彩色平滑K线图自定义指标 - (SmoothedCandlesticks.mq5)
由于指标主要用于交易策略的可视化,因此与仅使用单一颜色显示数据的指标相比,彩色指标更受欢迎。彩色指标使交易者能够轻松快速地识别由指标生成的交易信号,这有助于提高指标的效率和易用性。
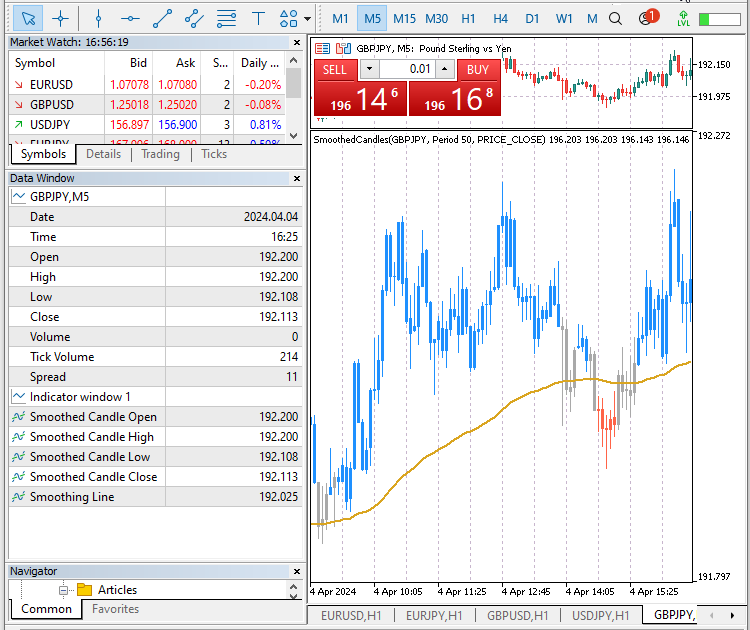
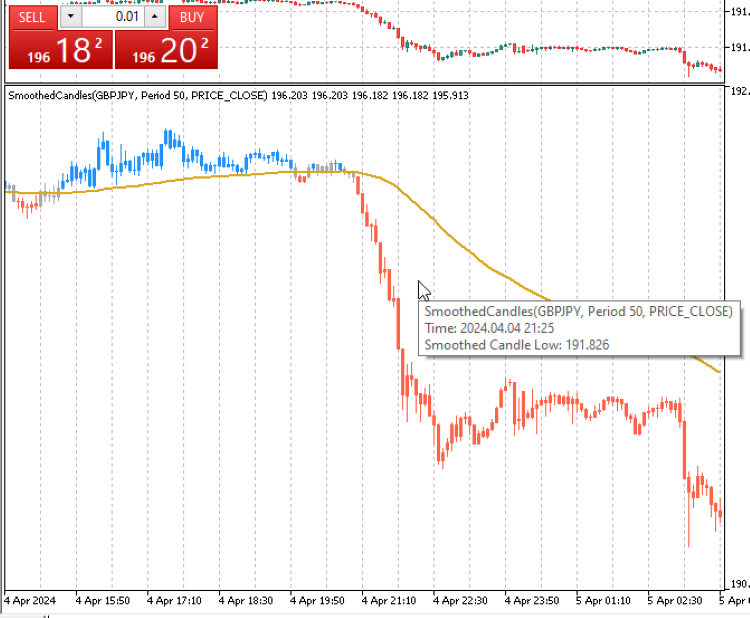
对于任何MQL5开发者来说,能够创建彩色指标是一项非常有用的技能。在本例中,我将演示如何创建一个平滑的彩色K线图自定义指标。消除市场噪音一直是交易者的首要任务,这个简单的指标通过计算平滑移动平均线来创建彩色K线图,这些K线图会根据移动平均线的信号改变颜色。这创建了一个清晰易懂的图表,替代了使用十字线图表工具来检测移动平均线交叉是否发生。
当开盘价、最高价、最低价和收盘价都高于平滑移动平均线时,K线图会变成绿色;而当开盘价、最高价、最低价和收盘价都低于平滑移动平均线时,K线图会变成红色。如果平滑移动平均线触及K线图实体的任何部分,即它位于最高价和最低价之间,那么K线图将变成深灰色,以表示平滑指标没有产生任何入场信号。
本例还将演示如何通过我们之前讨论过的预定义技术指标MQL5函数来使用MQL5标准指标。使用MQL5向导创建一个新的自定义指标文件,并将其命名为'SmoothedCandlesticks.mq5'。记得将它保存在'Article'文件夹中,与我们之前创建的其他自定义指标文件放在一起。
用#Property定义指标的相关属性
首先,指定指标将显示的位置,是在图表窗口中还是在价格图表下方的单独窗口中。该指标在所有场景下都适用,并且您可以在单独窗口中与图表窗口中切换显示,以测试其视觉效果如何。
//--- specify where to display the indicator
#property indicator_separate_window
//#property indicator_chart_window
指定指标的数据缓冲区在这个指标中,我们将使用六个指标缓冲区来绘制和显示我们的数据。我们将有四个指标缓冲区分别用于表示K线的开盘价、收盘价、最高价和最低价。一个指标缓冲区用于平滑移动平均线,另一个指标缓冲区用于存储我们K线的颜色。这加起来总共有六个指标缓冲区。
//--- indicator buffers
#property indicator_buffers 6
我们的指标需要绘制两个图。一个是K线图,另一个是平滑移动平均线。这加起来总共是两个指标图。
//--- indicator plots
#property indicator_plots   2
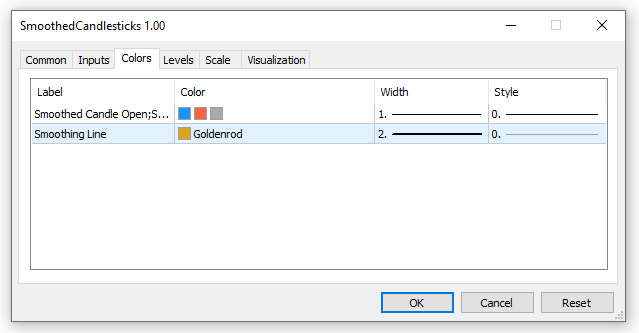
指定平滑K线图的绘图细节。这包括类型、颜色和标签的值。标签将与相应的数据(如价格)一起显示在数据窗口中。我们的指标使用彩色K线图,并且我们需要三种颜色,这些颜色会根据我之前解释过的当前交易信号的变化而变化。在将指标加载到图表上时出现的指标面板中,允许用户选择更改指定颜色。
//--- plots1 details for the smoothed candles
#property indicator_type1   DRAW_COLOR_CANDLES
#property indicator_color1  clrDodgerBlue, clrTomato, clrDarkGray
#property indicator_label1  "Smoothed Candle Open;Smoothed Candle High;Smoothed Candle Low;Smoothed Candle Close;"
重复上述步骤,并为第二个绘图——平滑移动平均线指定绘图细节:对于平滑移动平均线,我们将只为其指定一种颜色,因为它不是彩色线条。
//--- plots2 details for the smoothing line
#property indicator_label2  "Smoothing Line"
#property indicator_type2   DRAW_LINE
#property indicator_color2  clrGoldenrod
#property indicator_style2  STYLE_SOLID
#property indicator_width2  2
全局作用域的用户输入变量
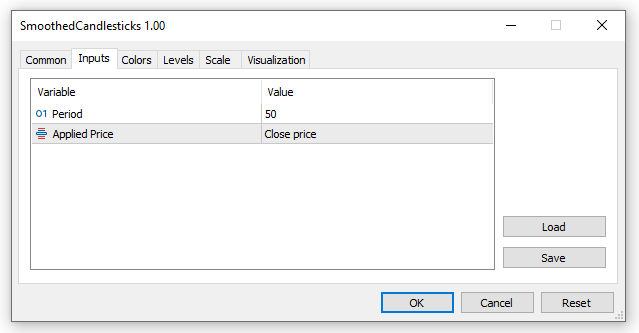
声明用户输入变量以获取和保存平滑移动平均线的周期和用于计算指标值的价格。
//--- user input parameters for the moving averages
input int                _maPeriod = 50;                    // Period
input ENUM_APPLIED_PRICE _maAppliedPrice = PRICE_CLOSE;     // Applied Price
全局作用域中的指标变量,缓冲区和技术指标句柄
在这里,我们将声明动态数组来存储我们的指标缓冲区。我们之前已经使用 #property 指令分配了六个指标缓冲区。让我们首先开始,为开盘价、收盘价、最高价、最低价和K线图存储声明五个指标缓冲区。剩余的用于平滑线的缓冲区将在下面声明,因为我们将使用 MQL5 标准技术指标函数 iMA 来管理这个缓冲区。
//--- indicator buffers
double openBuffer[];
double highBuffer[];
double lowBuffer[];
double closeBuffer[];
double candleColorBuffer[];
接下来,我们声明用于平滑线的缓冲区以及一个句柄,以便访问 iMA 技术指标函数。使用已经创建的 MQL5 标准技术指标函数可以节省我们的时间,并且更加高效,因为所有关于K线图的平滑计算都将以更少的代码高效地执行。
//Moving average dynamic array (buffer) and variables
double iMA_Buffer[];
int maHandle; //stores the handle of the iMA indicator
在这里,我们声明并初始化最后一个全局变量'barsCalculated',并将其值设为零。这个整型变量用于存储从iMA中计算得到的K线数量。我们将在OnCalculate()函数中使用它。
//--- integer to store the number of values in the moving average indicator
int barsCalculated = 0;
用于初始化指标的自定义函数 - GetInit()
既然我们已经完成了自定义指标的开头部分,接下来我们将创建一个自定义函数来执行所有的初始化任务。我们将这个函数命名为'GetInit()',并定义它返回一个布尔类型的值,以标识指标初始化是否成功。如果初始化失败,那么指标应该终止并关闭。
在初始化函数中,我们将执行一些重要的任务,比如:设置并声明指标的缓冲区、保存指标的简称、创建平滑移动平均线iMA的句柄,以及其他一些基本的初始化任务。
//+------------------------------------------------------------------+
//| User custom function for custom indicator initialization         |
//+------------------------------------------------------------------+
bool GetInit()
  {
//--- set the indicator buffer mapping by assigning the indicator buffer array
   SetIndexBuffer(0, openBuffer, INDICATOR_DATA);
   SetIndexBuffer(1, highBuffer, INDICATOR_DATA);
   SetIndexBuffer(2, lowBuffer, INDICATOR_DATA);
   SetIndexBuffer(3, closeBuffer, INDICATOR_DATA);
   SetIndexBuffer(4, candleColorBuffer, INDICATOR_COLOR_INDEX);

//--- buffer for iMA
   SetIndexBuffer(5, iMA_Buffer, INDICATOR_DATA);

//--- set the price display precision to digits similar to the symbol prices
   IndicatorSetInteger(INDICATOR_DIGITS, _Digits);

//--- set the symbol, timeframe, period and smoothing applied price of the indicator as the short name
   string indicatorShortName = StringFormat("SmoothedCandles(%s, Period %d, %s)", _Symbol,
                               _maPeriod, EnumToString(_maAppliedPrice));
   IndicatorSetString(INDICATOR_SHORTNAME, indicatorShortName);
//IndicatorSetString(INDICATOR_SHORTNAME, "Smoothed Candlesticks");

//--- set line drawing to an empty value
   PlotIndexSetDouble(0, PLOT_EMPTY_VALUE, 0.0);

//--- create the maHandle of the smoothing indicator
   maHandle = iMA(_Symbol, PERIOD_CURRENT, _maPeriod, 0, MODE_SMMA, _maAppliedPrice);

//--- check if the maHandle is created or it failed
   if(maHandle == INVALID_HANDLE)
     {
      //--- creating the handle failed, output the error code
      ResetLastError();
      PrintFormat("Failed to create maHandle of the iMA for symbol %s, error code %d",
                  _Symbol, GetLastError());
      //--- we terminate the program and exit the init function
      return(false);
     }

   return(true); // return true, initialization of the indicator ok
  }
//+------------------------------------------------------------------+
在创建了'GetInit()'函数之后,需要在'OnInit()'标准指标函数中调用它,执行它预设的任务。
//+------------------------------------------------------------------+
//| Custom indicator initialization function                         |
//+------------------------------------------------------------------+
int OnInit()
  {
//--- call the custom initialization function
   if(!GetInit())
     {
      return(INIT_FAILED); //-- if initialization failed terminate the app
     }

//---
   return(INIT_SUCCEEDED);
  }
指标中最主要的迭代计算函数 - OnCalculate()
接下来的任务是编写标准的'OnCalculate(...)'函数,以执行指标的所有计算。在这个例子中,我们将使用这个函数的长版本,它总共有十个参数。这个版本的'OnCalculate(...)'是基于当前时间框架时间序列的计算。以下是它包含的参数:
- rates_total:当指标启动时,它保存图表上柱形的总数,并且随着新柱形或数据的加载,它会更新以反映当前可用的柱形总数。
- prev_calculated:它保存了上一次调用时已经处理过的柱形数量。这有助于我们了解哪些数据已经计算或处理过,这样我们就不必在每次调用OnCalculate(...)函数或当新柱形到达时都把每个柱形数据再计算一次。OnCalculate(..)在每次调用时都会返回这个变量的更新版本。
- time, open, high, low, close, tick_volume, volume和 spread:从它们的名称就可以很容易地看出这些数组保存的是什么数据。我们的自定义指标将依赖于这些数组中的数据,并且它将展示如何使用这些数据,特别是对于我们这种基于K线图的指标来说。
将OnCalculate(...)函数体添加到我们的代码中,因为它包含了绘制平滑彩色K线和平滑线所需的所有相关计算。
//+------------------------------------------------------------------+
//| Custom indicator iteration function                              |
//+------------------------------------------------------------------+
int OnCalculate(const int rates_total,
                const int prev_calculated,
                const datetime &time[],
                const double &open[],
                const double &high[],
                const double &low[],
                const double &close[],
                const long &tick_volume[],
                const long &volume[],
                const int &spread[])
  {
//--- declare a int to save the number of values copied from the iMA indicator
   int iMA_valuesToCopy;

//--- find the number of values already calculated in the indicator
   int iMA_calculated = BarsCalculated(maHandle);
   if(iMA_calculated <= 0)
     {
      PrintFormat("BarsCalculated() for iMA handle returned %d, error code %d", iMA_calculated, GetLastError());
      return(0);
     }

   int start;
//--- check if it's the indicators first call of OnCalculate() or we have some new uncalculated data
   if(prev_calculated == 0)
     {
      //--- set all the buffers to the first index
      lowBuffer[0] = low[0];
      highBuffer[0] = high[0];
      openBuffer[0] = open[0];
      closeBuffer[0] = close[0];
      start = 1;


      if(iMA_calculated > rates_total)
         iMA_valuesToCopy = rates_total;
      else   //--- copy the calculated bars which are less than the indicator buffers data
         iMA_valuesToCopy = iMA_calculated;
     }
   else
      start = prev_calculated - 1;

   iMA_valuesToCopy = (rates_total - prev_calculated) + 1;

//--- fill the iMA_Buffer array with values of the Moving Average indicator
//--- reset error code
   ResetLastError();
//--- copy a part of iMA_Buffer array with data in the zero index of the the indicator buffer
   if(CopyBuffer(maHandle, 0, 0, iMA_valuesToCopy, iMA_Buffer) < 0)
     {
      //--- if the copying fails, print the error code
      PrintFormat("Failed to copy data from the iMA indicator, error code %d", GetLastError());
      //--- exit the function with zero result to specify that the indicator calculations were not executed
      return(0);
     }

//--- iterate through the main calculations loop and execute all the calculations
   for(int x = start; x < rates_total && !IsStopped(); x++)
     {
      //--- save all the candle array prices in new non-array variables for quick access
      double candleOpen = open[x];
      double candleClose = close[x];
      double candleHigh = high[x];
      double candleLow  = low[x];

      lowBuffer[x] = candleLow;
      highBuffer[x] = candleHigh;
      openBuffer[x] = candleOpen;
      closeBuffer[x] = candleClose;

      //--- scan for the different trends signals and set the required candle color
      candleColorBuffer[x] = 2.0; // set color clrDarkGray - default (signal for no established trend)
      if(candleOpen > iMA_Buffer[x] && candleClose > iMA_Buffer[x] && candleHigh > iMA_Buffer[x] && candleLow > iMA_Buffer[x])
         candleColorBuffer[x]=0.0; // set color clrDodgerBlue - signal for a long/buy trend

      if(candleOpen < iMA_Buffer[x] && candleClose < iMA_Buffer[x] && candleHigh < iMA_Buffer[x] && candleLow < iMA_Buffer[x])
         candleColorBuffer[x]=1.0; // set color clrTomato - signal for a short/sell trend
     }

//--- return the rates_total which includes the prev_calculated value for the next call
   return(rates_total);
  }
指标反初始化函数 - OnDeinit()
最后一个函数是'OnDeinit()'标准函数,用于反初始化所有需要释放的变量和数组。除了iMA句柄之外,所有的缓冲区数组都是自动管理的,不需要释放或反初始化。为了确保我们的指标在终止时释放所有未使用的资源,我们将使用'IndicatorRelease()' MQL5函数来释放'maHandle'变量所占用的任何资源。
//+------------------------------------------------------------------+
//| Indicator deinitialization function                              |
//+------------------------------------------------------------------+
void OnDeinit(const int reason)
  {
   if(maHandle != INVALID_HANDLE)
     {
      IndicatorRelease(maHandle);//-- clean up and release the iMA handle
     }
  }
//+------------------------------------------------------------------+
我们的指标现在已经几乎完成了,以下是各代码段的组合。请确保您的代码按照以下顺序将所有需要的部分包含在内。
//--- specify where to display the indicator
#property indicator_separate_window
//#property indicator_chart_window

//--- indicator buffers
#property indicator_buffers 6

//--- indicator plots
#property indicator_plots   2

//--- plots1 details for the smoothed candles
#property indicator_type1   DRAW_COLOR_CANDLES
#property indicator_color1  clrDodgerBlue, clrTomato, clrDarkGray
#property indicator_label1  "Smoothed Candle Open;Smoothed Candle High;Smoothed Candle Low;Smoothed Candle Close;"

//--- plots2 details for the smoothing line
#property indicator_label2  "Smoothing Line"
#property indicator_type2   DRAW_LINE
#property indicator_color2  clrGoldenrod
#property indicator_style2  STYLE_SOLID
#property indicator_width2  2

//--- user input parameters for the moving averages
input int                _maPeriod = 50;                    // Period
input ENUM_APPLIED_PRICE _maAppliedPrice = PRICE_CLOSE;     // Applied Price

//--- indicator buffers
double openBuffer[];
double highBuffer[];
double lowBuffer[];
double closeBuffer[];
double candleColorBuffer[];

//Moving average dynamic array (buffer) and variables
double iMA_Buffer[];
int maHandle; //stores the handle of the iMA indicator

//--- integer to store the number of values in the moving average indicator
int barsCalculated = 0;

//+------------------------------------------------------------------+
//| Custom indicator initialization function                         |
//+------------------------------------------------------------------+
int OnInit()
  {
//--- call the custom initialization function
   if(!GetInit())
     {
      return(INIT_FAILED); //-- if initialization failed terminate the app
     }

//---
   return(INIT_SUCCEEDED);
  }

//+------------------------------------------------------------------+
//| Custom indicator iteration function                              |
//+------------------------------------------------------------------+
int OnCalculate(const int rates_total,
                const int prev_calculated,
                const datetime &time[],
                const double &open[],
                const double &high[],
                const double &low[],
                const double &close[],
                const long &tick_volume[],
                const long &volume[],
                const int &spread[])
  {
//--- declare a int to save the number of values copied from the iMA indicator
   int iMA_valuesToCopy;

//--- find the number of values already calculated in the indicator
   int iMA_calculated = BarsCalculated(maHandle);
   if(iMA_calculated <= 0)
     {
      PrintFormat("BarsCalculated() for iMA handle returned %d, error code %d", iMA_calculated, GetLastError());
      return(0);
     }

   int start;
//--- check if it's the indicators first call of OnCalculate() or we have some new uncalculated data
   if(prev_calculated == 0)
     {
      //--- set all the buffers to the first index
      lowBuffer[0] = low[0];
      highBuffer[0] = high[0];
      openBuffer[0] = open[0];
      closeBuffer[0] = close[0];
      start = 1;


      if(iMA_calculated > rates_total)
         iMA_valuesToCopy = rates_total;
      else   //--- copy the calculated bars which are less than the indicator buffers data
         iMA_valuesToCopy = iMA_calculated;
     }
   else
      start = prev_calculated - 1;

   iMA_valuesToCopy = (rates_total - prev_calculated) + 1;

//--- fill the iMA_Buffer array with values of the Moving Average indicator
//--- reset error code
   ResetLastError();
//--- copy a part of iMA_Buffer array with data in the zero index of the the indicator buffer
   if(CopyBuffer(maHandle, 0, 0, iMA_valuesToCopy, iMA_Buffer) < 0)
     {
      //--- if the copying fails, print the error code
      PrintFormat("Failed to copy data from the iMA indicator, error code %d", GetLastError());
      //--- exit the function with zero result to specify that the indicator calculations were not executed
      return(0);
     }

//--- iterate through the main calculations loop and execute all the calculations
   for(int x = start; x < rates_total && !IsStopped(); x++)
     {
      //--- save all the candle array prices in new non-array variables for quick access
      double candleOpen = open[x];
      double candleClose = close[x];
      double candleHigh = high[x];
      double candleLow  = low[x];

      lowBuffer[x] = candleLow;
      highBuffer[x] = candleHigh;
      openBuffer[x] = candleOpen;
      closeBuffer[x] = candleClose;

      //--- scan for the different trends signals and set the required candle color
      candleColorBuffer[x] = 2.0; // set color clrDarkGray - default (signal for no established trend)
      if(candleOpen > iMA_Buffer[x] && candleClose > iMA_Buffer[x] && candleHigh > iMA_Buffer[x] && candleLow > iMA_Buffer[x])
         candleColorBuffer[x]=0.0; // set color clrDodgerBlue - signal for a long/buy trend

      if(candleOpen < iMA_Buffer[x] && candleClose < iMA_Buffer[x] && candleHigh < iMA_Buffer[x] && candleLow < iMA_Buffer[x])
         candleColorBuffer[x]=1.0; // set color clrTomato - signal for a short/sell trend
     }

//--- return the rates_total which includes the prev_calculated value for the next call
   return(rates_total);
  }

//+------------------------------------------------------------------+
//| Indicator deinitialization function                              |
//+------------------------------------------------------------------+
void OnDeinit(const int reason)
  {
   if(maHandle != INVALID_HANDLE)
     {
      IndicatorRelease(maHandle);//-- clean up and release the iMA handle
     }
  }
//+------------------------------------------------------------------+

//+------------------------------------------------------------------+
//| User custom function for custom indicator initialization         |
//+------------------------------------------------------------------+
bool GetInit()
  {
//--- set the indicator buffer mapping by assigning the indicator buffer array
   SetIndexBuffer(0, openBuffer, INDICATOR_DATA);
   SetIndexBuffer(1, highBuffer, INDICATOR_DATA);
   SetIndexBuffer(2, lowBuffer, INDICATOR_DATA);
   SetIndexBuffer(3, closeBuffer, INDICATOR_DATA);
   SetIndexBuffer(4, candleColorBuffer, INDICATOR_COLOR_INDEX);

//--- buffer for iMA
   SetIndexBuffer(5, iMA_Buffer, INDICATOR_DATA);

//--- set the price display precision to digits similar to the symbol prices
   IndicatorSetInteger(INDICATOR_DIGITS, _Digits);

//--- set the symbol, timeframe, period and smoothing applied price of the indicator as the short name
   string indicatorShortName = StringFormat("SmoothedCandles(%s, Period %d, %s)", _Symbol,
                               _maPeriod, EnumToString(_maAppliedPrice));
   IndicatorSetString(INDICATOR_SHORTNAME, indicatorShortName);
//IndicatorSetString(INDICATOR_SHORTNAME, "Smoothed Candlesticks");

//--- set line drawing to an empty value
   PlotIndexSetDouble(0, PLOT_EMPTY_VALUE, 0.0);

//--- create the maHandle of the smoothing indicator
   maHandle = iMA(_Symbol, PERIOD_CURRENT, _maPeriod, 0, MODE_SMMA, _maAppliedPrice);

//--- check if the maHandle is created or it failed
   if(maHandle == INVALID_HANDLE)
     {
      //--- creating the handle failed, output the error code
      ResetLastError();
      PrintFormat("Failed to create maHandle of the iMA for symbol %s, error code %d",
                  _Symbol, GetLastError());
      //--- we terminate the program and exit the init function
      return(false);
     }

   return(true); // return true, initialization of the indicator ok
  }
//+------------------------------------------------------------------+
保存并编译指标代码,确保编译过程中没有出现任何错误或警告。在MetaTrader 5中加载该指标,并使用不同的用户输入参数测试其性能。
结论
在本文中,您已经了解了什么是指标、MetaTrader 5平台中的各种指标类型、自定义指标的不同组成部分,并且通过从头开始使用MQL5开发了一些自定义指标,获得了第一手的实践经验。
使用MQL5开发自定义指标是一个复杂的话题,无法在单篇文章中完全讲透,因此我们将在后续文章中继续探讨更深入的内容。通过本文的学习,您现在已经能够开发自己的简单自定义指标了。我鼓励您继续练习编程技能,并祝您在编程之旅中一切顺利。
本文由MetaQuotes Ltd译自英文
原文地址: https://www.mql5.com/en/articles/14481
注意: MetaQuotes Ltd.将保留所有关于这些材料的权利。全部或部分复制或者转载这些材料将被禁止。
本文由网站的一位用户撰写,反映了他们的个人观点。MetaQuotes Ltd 不对所提供信息的准确性负责,也不对因使用所述解决方案、策略或建议而产生的任何后果负责。
 开发回放系统(第 42 部分):图表交易项目(I)
 神经网络变得简单(第 75 部分):提升轨迹预测模型的性能
 数据处理的分组方法:在MQL5中实现组合算法

感谢罗曼的反馈!很高兴这篇文章对您有所帮助。我同意,MQL5 编程语言在不断发展,虽然旧文章可能无法反映最新更新,但像我这样的新文章有助于解决这一难题。祝您从 MT4 到 MT5 的指标转换取得成功!
我是编程方面的新手,所以每一点信息都对我很有帮助,也很重要。我很感谢你花时间和精力帮助我们这些想学习的新人。
谨致问候
gerrit
我是编程方面的新手,所以每一点信息都对我很有帮助,也很重要。我很感谢你花时间和精力帮助我们这些想学习的新人。
谨致问候
gerrit
不客气,Gerrit,感谢您花时间分享您的想法!这篇文章对您开始 MQL5 编程之旅很有帮助,这对我来说意义重大。编程世界充满机遇,不断学习,不断进取--小步快跑,大步向前。