MultiDimensional Momentum
- インディケータ
-
Vincent Jose Proenca
 私はトレーダーとして10年以上の経験があり、主にCFDを専門としています。トレーディングの魅力は、論理性・規律・そして意思決定を簡単にするツールを作り出すことにあります。自分の手法に合うインジケーターが見つからなかったため、必要に迫られて自作を始め、次第にそれが楽しみになりました。
最初に開発したツールの一部は、Custom Box と Daily Bar Number です。これらのインジケーターは理論上の試作品ではなく、日常使用を目的に設計され、実際の市場環境でテスト・改良を重ねてきました。その結果、実用的で統合しやすく、情報過多に陥ることなく素早い判断を支援するツールが生まれました。 - バージョン: 2.10
- アクティベーション: 5
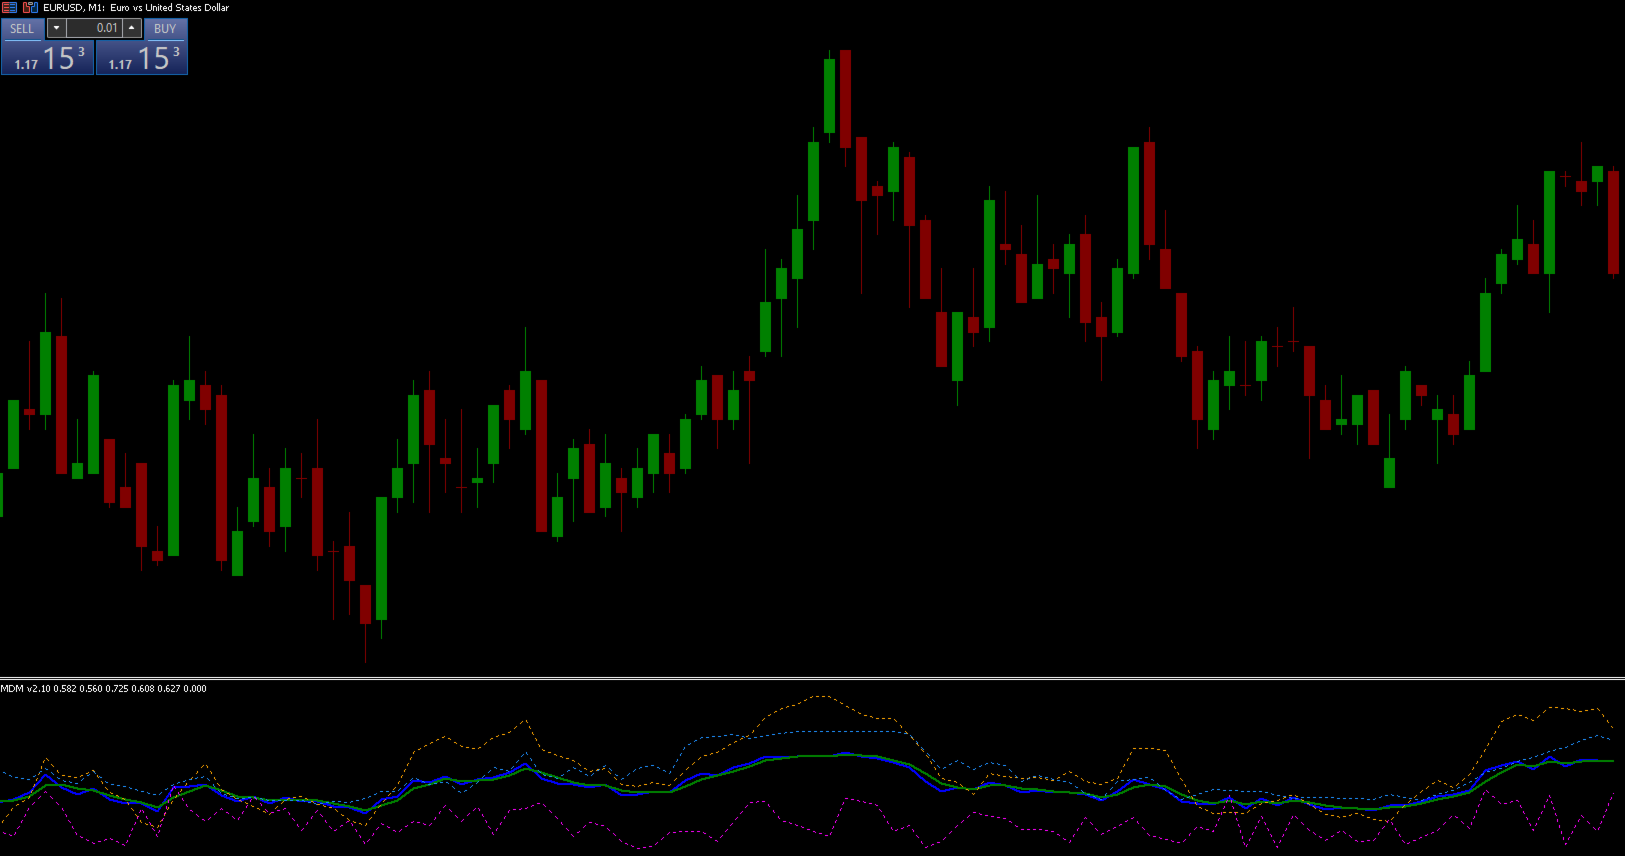
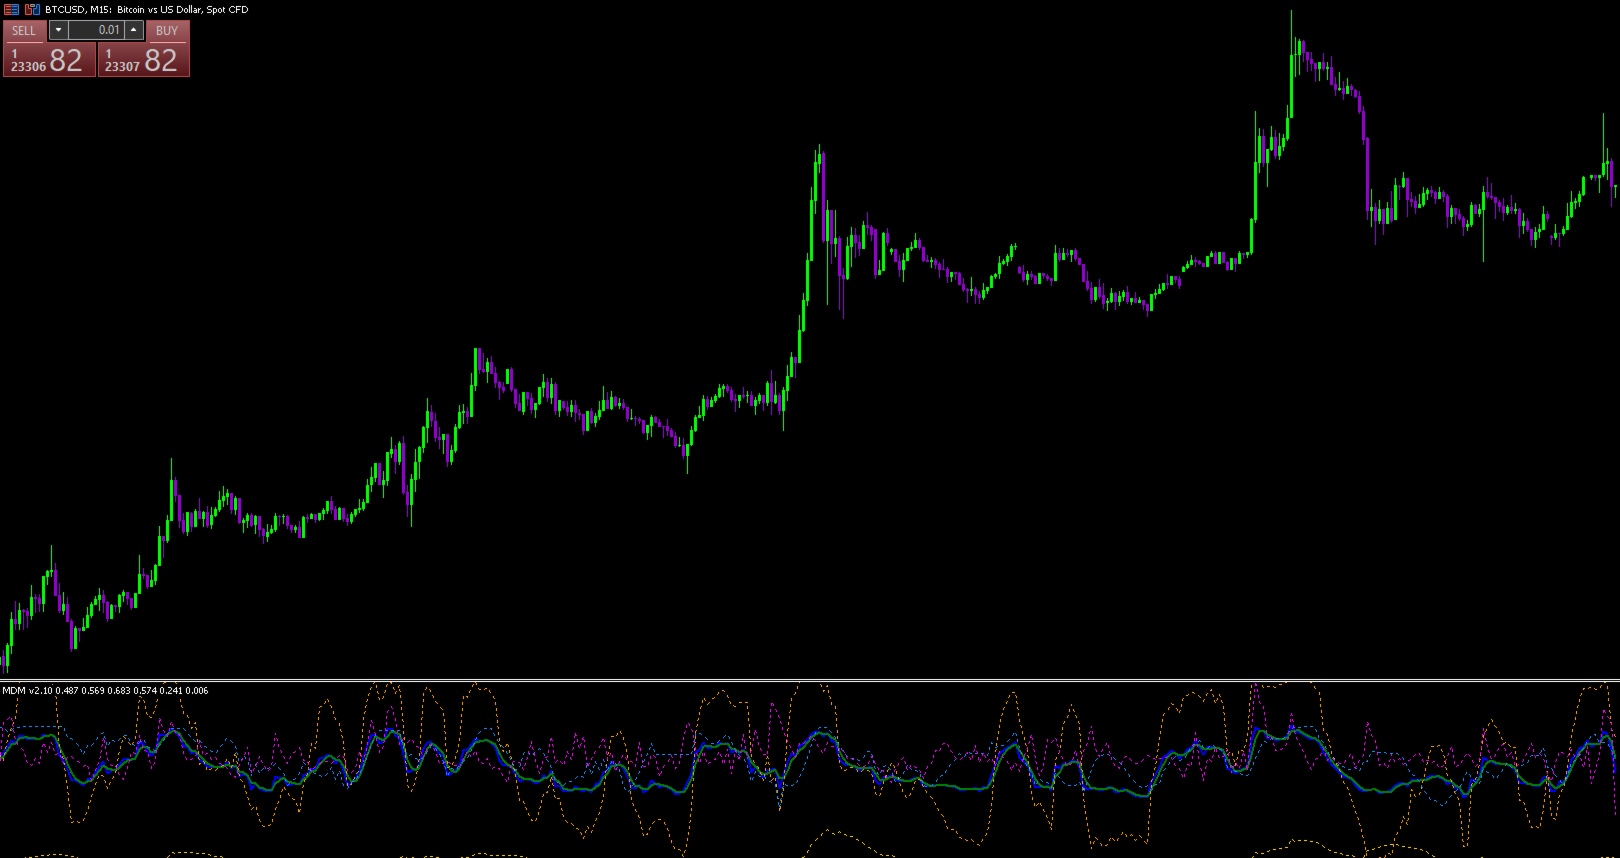
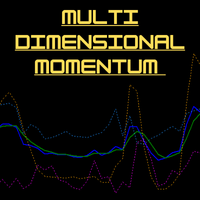
MDM indicator is the IMM (Integrated Market Momentum) line, which oscillates between 0 and 1. Here's how to interpret it:
-
General Interpretation of the IMM Line: The indicator calculates this final value by combining momentum, trend, volume, aggressiveness, and price strength scores
. Generally, readings above 0.50 suggest a strong bullish zone, while readings below 0.50 suggest a strong bearish zone. The area between 0.45 and 0.55 is often considered neutral or consolidating.
Generating Trading Signals: You can use the interaction between the two main lines to find potential entry and exit points.
-
A buy signal may be considered when the Smoothed IMM (green line) is above 0.50 and shows a strong, sustained rise, especially if confirmed by strong momentum and trend components.
-
A sell signal may be considered when the Smoothed IMM (green line) is below 0.50 and shows a strong, sustained decline.
-
Look for situations where the main blue line crosses above the green smoothed line as a confirmation of strengthening momentum, and vice versa.
Using the Components for Confirmation: For a higher-probability signal, check if the individual component dots align
:
-
A strong buy signal is more convincing if the Momentum (orange), Trend (blue), and Volume (magenta) dots are also at high levels.
-
A strong sell signal is more reliable if these same components are at low levels.
-
High Aggressiveness (gold) can indicate that a strong price move is underway, but it can also precede a period of volatility or a reversal.