MultiDimensional Momentum
- Indicatori
-
Vincent Jose Proenca
 Faccio il trader da oltre dieci anni, specializzato principalmente nei CFD. Ciò che amo del trading è la logica, la disciplina e la creazione di strumenti che semplificano il processo decisionale. Non trovando indicatori adatti al mio approccio, ho iniziato a programmarli io stesso — prima per
 - Versione: 2.10
- Attivazioni: 5
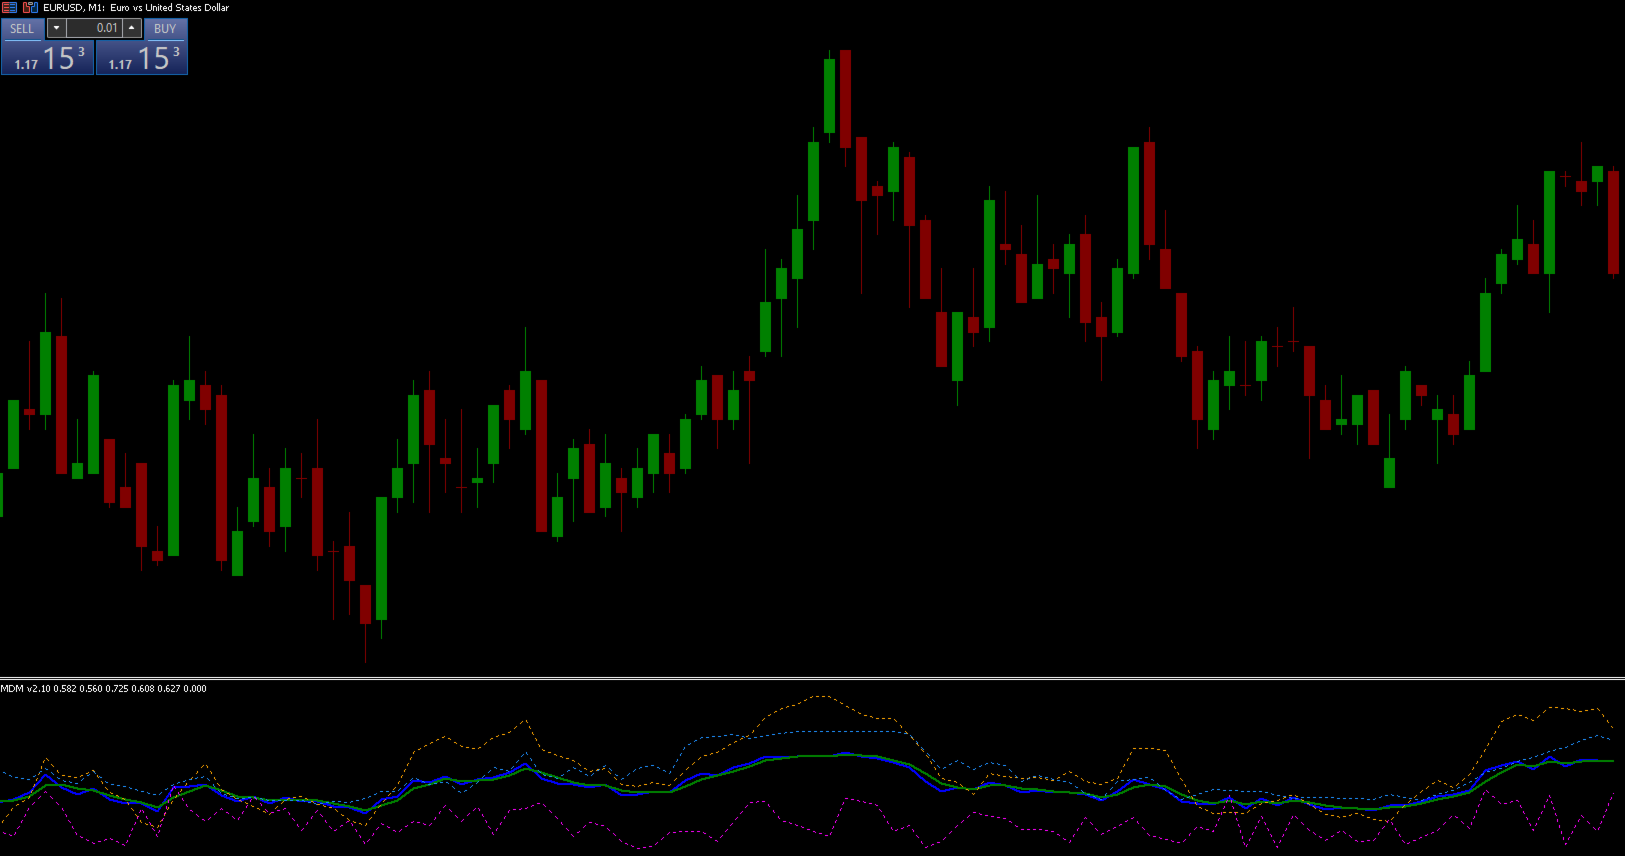
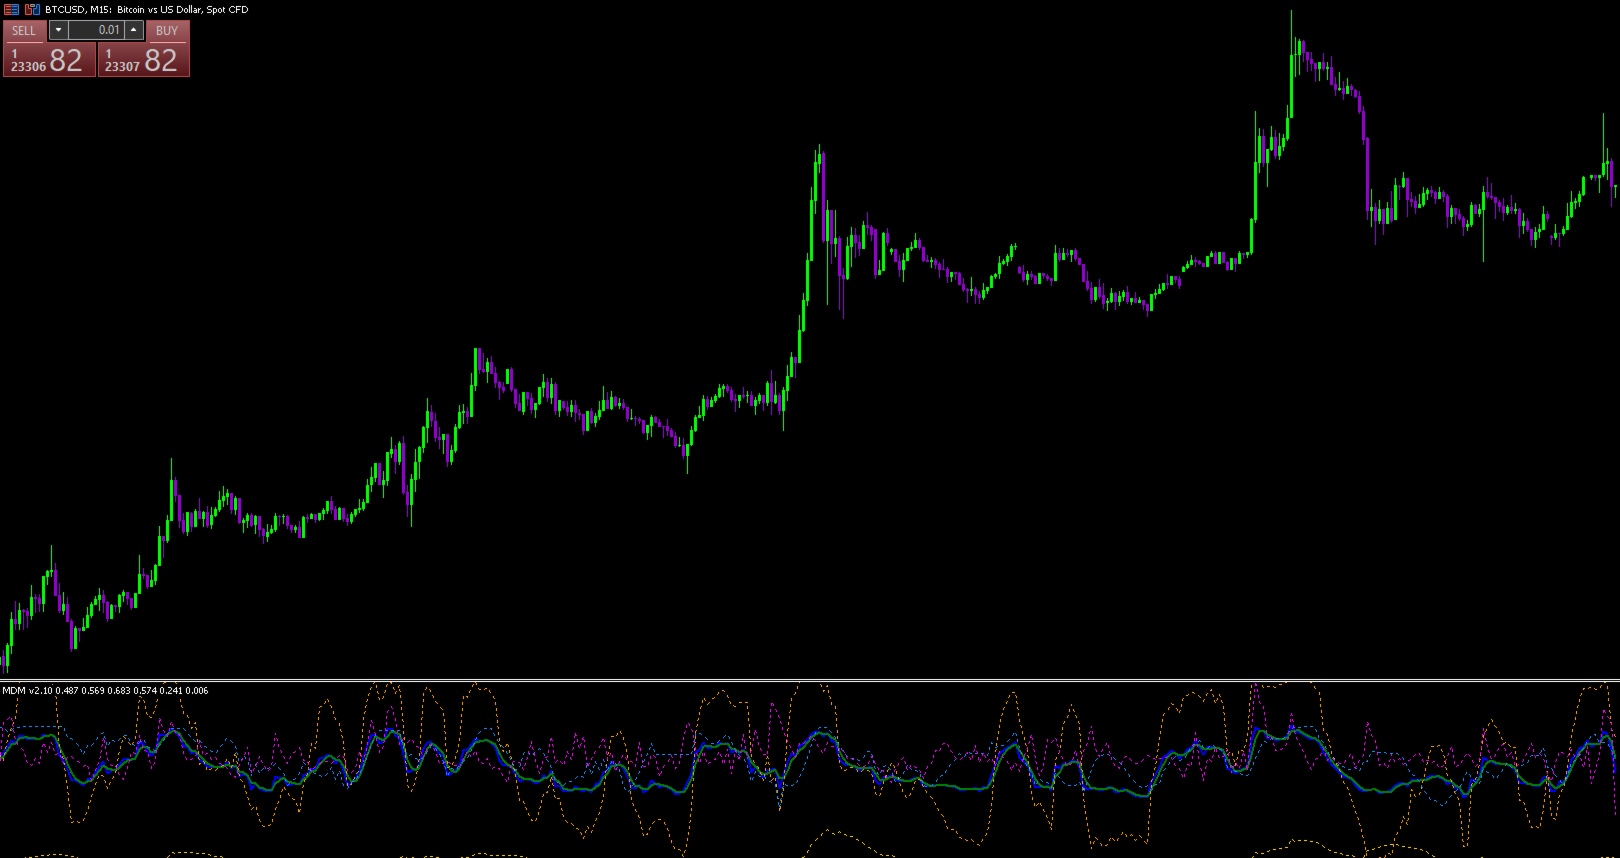
MDM indicator is the IMM (Integrated Market Momentum) line, which oscillates between 0 and 1. Here's how to interpret it:
-
General Interpretation of the IMM Line: The indicator calculates this final value by combining momentum, trend, volume, aggressiveness, and price strength scores
. Generally, readings above 0.50 suggest a strong bullish zone, while readings below 0.50 suggest a strong bearish zone. The area between 0.45 and 0.55 is often considered neutral or consolidating.
Generating Trading Signals: You can use the interaction between the two main lines to find potential entry and exit points.
-
A buy signal may be considered when the Smoothed IMM (green line) is above 0.50 and shows a strong, sustained rise, especially if confirmed by strong momentum and trend components.
-
A sell signal may be considered when the Smoothed IMM (green line) is below 0.50 and shows a strong, sustained decline.
-
Look for situations where the main blue line crosses above the green smoothed line as a confirmation of strengthening momentum, and vice versa.
Using the Components for Confirmation: For a higher-probability signal, check if the individual component dots align
:
-
A strong buy signal is more convincing if the Momentum (orange), Trend (blue), and Volume (magenta) dots are also at high levels.
-
A strong sell signal is more reliable if these same components are at low levels.
-
High Aggressiveness (gold) can indicate that a strong price move is underway, but it can also precede a period of volatility or a reversal.