MTF Candles Drawing
- Indicateurs
- Version: 1.0

The MTF (Multi-Timeframe) Candles indicator is a powerful tool that allows you to display candles from a higher timeframe (e.g., H1, H4, D1) directly on a lower timeframe chart (e.g., M5, M15, M30).
The Problem It Solves: Instead of constantly switching back and forth between charts to analyze the main trend and detailed price action, this indicator merges both perspectives into one. You can instantly see the "big picture" while staying focused on trading signals on your current timeframe.
Core Concept
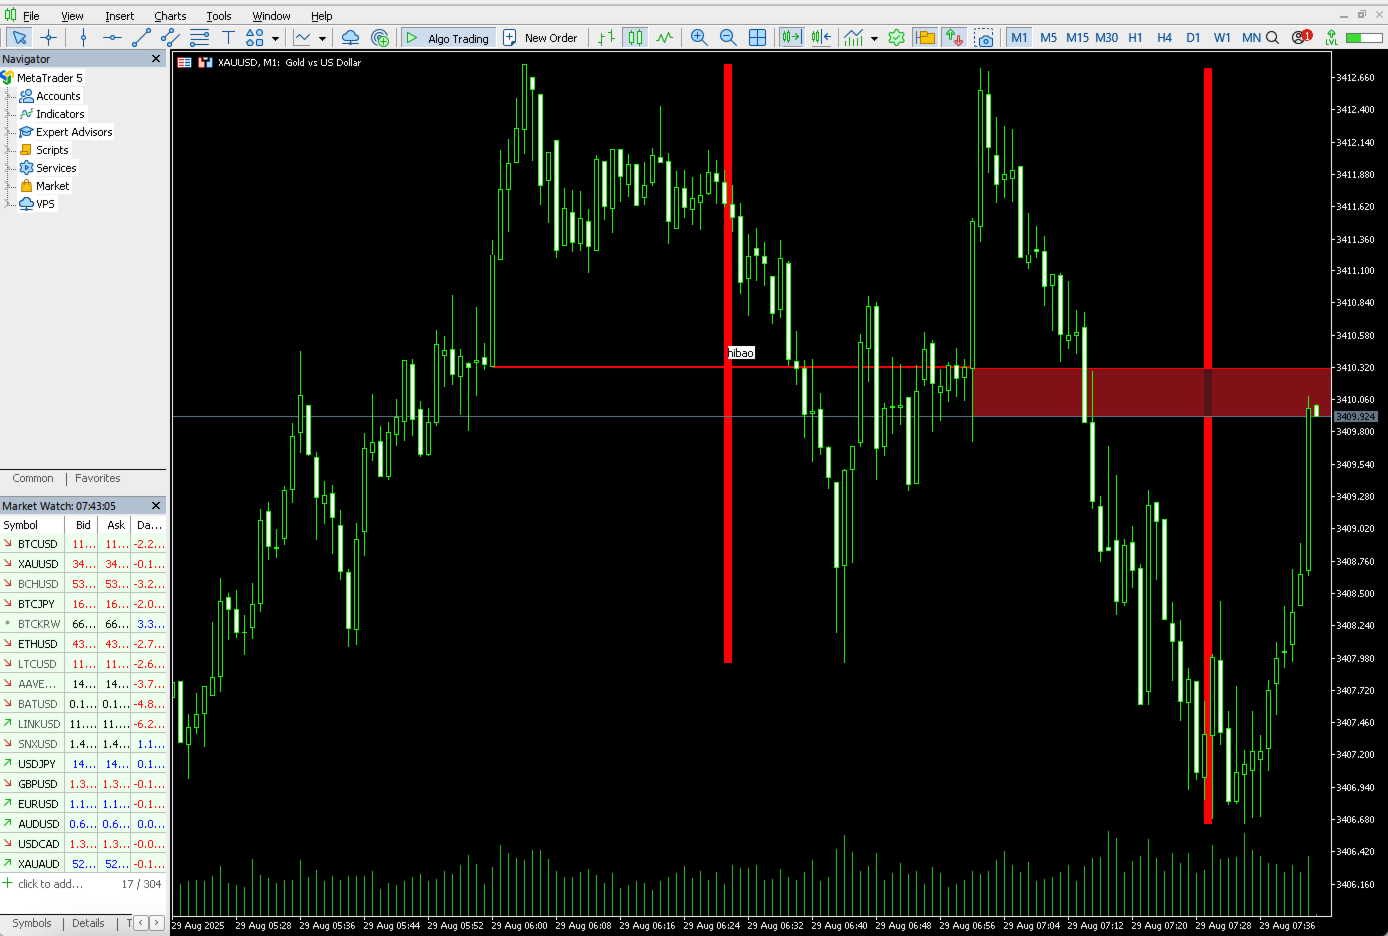
The indicator will draw the candles of your selected higher timeframe (HTF) as large, semi-transparent rectangular blocks. The candles of the current chart will be contained within these HTF candle blocks.
For example: When you apply the indicator to view H1 candles on an M15 chart, each large candle block you see represents the entire Open, High, Low, and Close price for a 1-hour period. Inside that H1 block, you will see the 4 M15 candles that form it.
Installation and Setup
- Copy File: Copy the MTFcandles.mq5 file into your MetaTrader 5's MQL5/Indicators directory.
- Compile: Open MetaEditor (press F4 in MT5), find the file in the Navigator, open it, and press F7 to compile.
- Apply to Chart: Return to MT5, find the "MTFcandles" indicator in the Navigator window (usually at the bottom), and drag it onto your desired chart.
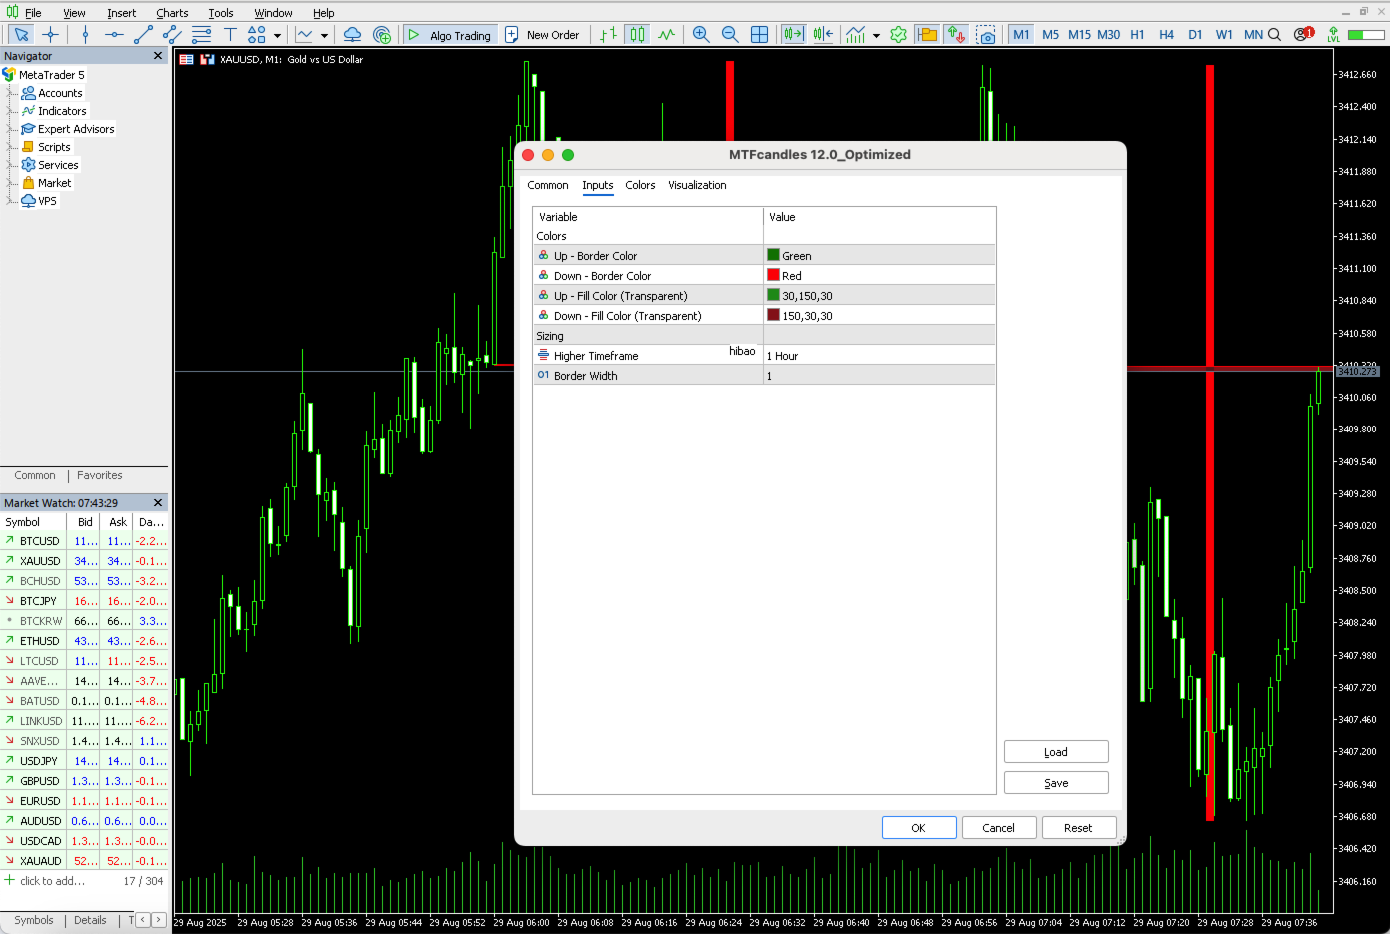
Configuration Parameters Explained (Inputs)
When you drag the indicator onto a chart, a window will appear with the following options:
-
Colors Group:
- Up - Border Color : The color of the border for a bullish HTF candle.
- Down - Border Color : The color of the border for a bearish HTF candle.
- Up - Fill Color : The fill color for a bullish HTF candle (a light, transparent color is recommended).
- Down - Fill Color : The fill color for a bearish HTF candle.
-
Sizing Group:
- Higher Timeframe : This is the most important parameter. Select the higher timeframe you want to display. NOTE: This timeframe must be greater than the current chart's timeframe (e.g., select PERIOD_H1 for an M15 chart; do not select PERIOD_M5 ).
- Border Width : The thickness of the HTF candle's border.
How to Read the Indicator on the Chart
- The Large Candle Blocks: These are the candles from the higher timeframe (HTF) you selected. Their color tells you the primary trend for that period (e.g., a green H4 block shows that buyers were in control for those 4 hours).
- HTF Body and Wicks:
- The top and bottom edges of the HTF candle body are the Open and Close prices for that timeframe.
- The highest and lowest points of the HTF wicks are the High and Low prices for that timeframe.
Trading Applications: Effective Strategies
This is the most crucial part for turning the indicator into a trading advantage.
-
Strategy 1: Trading with the Main Trend (Trend Confirmation)
- Concept: Only enter trades that align with the higher timeframe's trend to increase the probability of success.
- Application: Open an M15 chart and apply the indicator with the H4 timeframe. If you see that the recent H4 candle blocks are predominantly green (uptrend), then focus only on looking for BUY signals on the M15 chart (e.g., breakouts, bullish patterns, MA crossovers). Ignore sell signals as they are counter-trend and high-risk.
-
Strategy 2: Using HTF High/Low as Dynamic Support/Resistance
- Concept: The high and low of the previous HTF candle are extremely significant levels for the current HTF candle.
- Application: On an M5 chart, apply the H1 indicator. Assume the previous hour's H1 candle has closed. Mark its High and Low. During the current hour, as the price on the M5 chart approaches these levels, they will act as strong support/resistance zones. A decisive breakout above the previous H1 high is a strong buy signal.
-
Strategy 3: Identifying Powerful HTF Candle Patterns
- Concept: Candle patterns like Engulfing or Pin Bars on a higher timeframe are highly reliable.
- Application: On an M30 chart, apply the D1 indicator. If you spot a giant red D1 candle block that completely "engulfs" the previous day's green block (Bearish Engulfing), this is a very strong sell signal for the entire day. Your job is to then move down to the M30 or H1 chart to find an optimal SELL entry point.
-
Strategy 4: Breakout Confirmation
- Concept: A breakout on a lower timeframe is much more reliable if it's confirmed by the higher timeframe.
- Application: The price on an H1 chart is approaching a key weekly resistance level. Instead of entering as soon as the H1 candle breaks out, wait patiently for the D1 candle block to also close above that resistance level. This confirmation shows that buyers are truly in control and minimizes the risk of a "false breakout."
-
Advanced Tip: Combine Multiple MTF Layers You can drag the indicator onto the chart multiple times. For example, on an M15 chart, you could apply:
- One MTF indicator with the H1 timeframe.
- A second MTF indicator with the H4 timeframe. This gives you a multi-layered view of the market structure, from the short-term trend (H1) to the medium-term trend (H4).
Conclusion
The MTF Candles indicator is not a "holy grail," but it is an extremely effective analysis tool that helps you:
- Filter out lower-timeframe noise.
- Always trade in the direction of the main trend.
- Identify significant support/resistance zones.
- Increase the reliability of your trading signals.
Happy trading!
Хороший индикатор