RSI Bollinger Double Confirm
- Indicateurs
- Version: 1.41

This indicator is a trading strategy designed to find high-probability entry points by combining two very popular indicators: Bollinger Bands (BB) and the Relative Strength Index (RSI).
The core idea is "dual confirmation": a trade signal is only considered valid when both indicators agree. This helps filter out many of the false signals that occur when using just a single indicator, thereby increasing the reliability of each entry.
- Bollinger Bands are used to identify relative price value zones (overbought/oversold).
- RSI is used to confirm the momentum behind that price movement.
Indicator Components
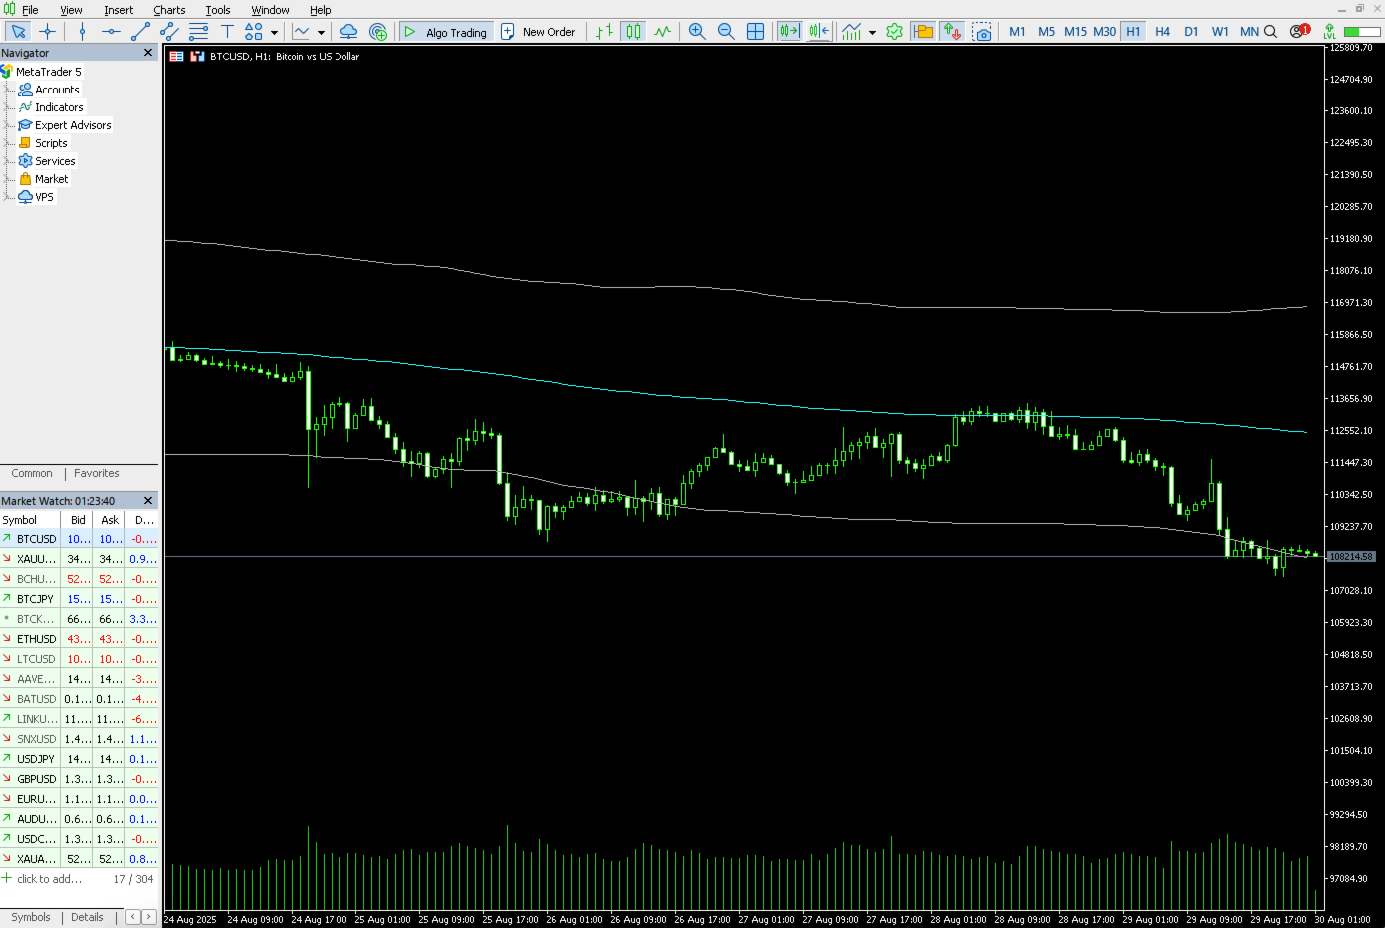
Bollinger Bands (BB)
This indicator draws a dynamic price channel around a moving average.
- Upper Band: Acts as a dynamic resistance level. Prices near this band are considered high.
- Middle Band: A Simple Moving Average (SMA), typically SMA20. It represents the medium-term price trend.
- Lower Band: Acts as a dynamic support level. Prices near this band are considered low.
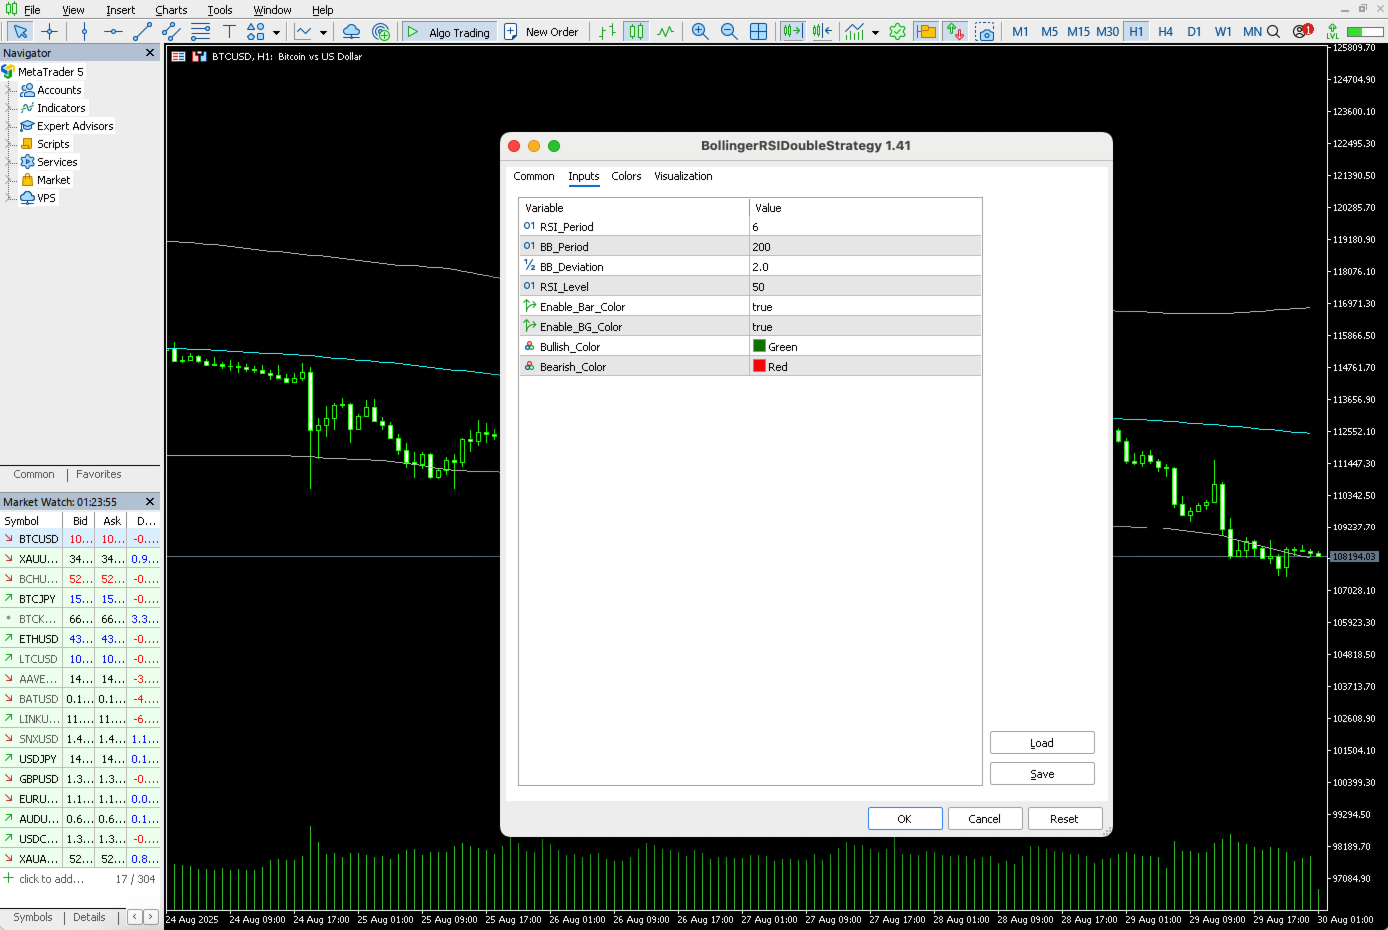
In this indicator, the default period for the BB is 200, indicating a focus on identifying the price channel within a very long-term trend.
Relative Strength Index (RSI)
This is a momentum oscillator that measures the speed and change of price movements.
- Special Use in This Indicator: Instead of the traditional 70/30 levels, this strategy uses the 50 level as the primary point for momentum confirmation.
- RSI > 50: Suggests that buyers are in control and momentum is shifting towards an uptrend.
- RSI < 50: Suggests that sellers are in control and momentum is shifting towards a downtrend.
The default RSI period is 6, which is very sensitive to recent price changes, helping to catch reversals quickly.
Detailed Trading Rules
A signal is only executed when BOTH the BB and RSI conditions are met SIMULTANEOUSLY.
BUY Signal (Long Entry)
You are looking for a buying opportunity when the market shows signs of reversing from a downtrend to an uptrend.
- ✅ Bollinger Bands Condition: The price must cross from outside to inside the BB channel. Specifically, the previous candle was below the lower band, and the current candle crosses above the lower Bollinger Band.
- ✅ RSI Condition: The momentum must confirm the return of buyers. Specifically, the RSI line crosses above the 50 level.
Interpretation: This signal indicates that after the price was pushed into the "oversold" zone (according to the BB), a buying force has emerged that is strong enough not only to push the price back inside the channel but also to drive market momentum past the midline. This is a highly reliable dual confirmation signal for a bullish reversal.
SELL Signal (Short Entry)
You are looking for a selling opportunity when the market shows signs of reversing from an uptrend to a downtrend.
- ✅ Bollinger Bands Condition: The price must cross from outside to inside the BB channel. Specifically, the previous candle was above the upper band, and the current candle crosses below the upper Bollinger Band.
- ✅ RSI Condition: The momentum must confirm the entry of sellers. Specifically, the RSI line crosses below the 50 level.
Interpretation: Conversely, this signal indicates that after the price was pushed into the "overbought" zone, a selling force has emerged that is strong enough to force the price back into the channel while simultaneously dragging market momentum below the midline. This is a dual confirmation signal for a bearish reversal.
Practical Application & Risk Management
Timeframes
- Most Effective: Due to the long BB period (200), this indicator works best on higher timeframes like H1, H4, and D1 to catch major waves and significant trend turning points.
- Lower Timeframes: It can be used on M15, M30, but may require parameter adjustments (e.g., reducing the BB period) to be more suitable, and caution is needed regarding noisy signals.
Risk Management
- Stop Loss:
- Safe: Place the stop loss just above the nearest swing high (for a Sell order) or just below the nearest swing low (for a Buy order).
- Dynamic: Place the stop loss directly at the corresponding Bollinger Band (the upper band for a Sell, the lower band for a Buy).
- Take Profit:
- Target 1 (Conservative): Take profit when the price reaches the middle SMA line (the middle Bollinger Band).
- Target 2 (Maximize Profit): Hold the position and take profit when the price reaches the opposite Bollinger Band.
Combining with Other Analysis
No indicator is a holy grail. To increase the probability of success, combine signals from this indicator with:
- Price Action: Look for reversal candlestick patterns (Pin Bars, Engulfing, etc.) at the point where the signal appears.
- Support & Resistance: A signal becomes much more reliable if it occurs at a strong support or resistance zone on the chart.
- Major Trend Analysis: Prioritize BUY signals when the overall trend is up, and prioritize SELL signals when the overall trend is down.
Customizing Parameters
You can go into the indicator's settings to change the parameters to suit your trading style.
- RSI_Period : Increase to make the RSI smoother and generate fewer noisy signals. Decrease to make the RSI more sensitive.
- BB_Period : Decrease (e.g., to 20, 50) if you want to trade shorter-term waves.
- BB_Deviation : Increase to widen the price channel (fewer signals), decrease to narrow the channel (more signals).
Important Disclaimer: Financial trading always involves risk. This indicator is an analysis tool and does not guarantee profit. Always backtest a strategy on a demo account before applying it to live trading.