Market Structure Break Order Block

Indicator Guide: Key Price Levels & Structure Shifts

1. Description

The indicator is a technical analysis tool for the MetaTrader 5 platform. It is designed to automatically identify specific price movements and to highlight corresponding price zones based on preceding price action. This provides a visualization of key price areas according to the indicator's internal logic.

2. Visual Elements & Their Identification

The indicator identifies and draws several types of visual elements on the chart:

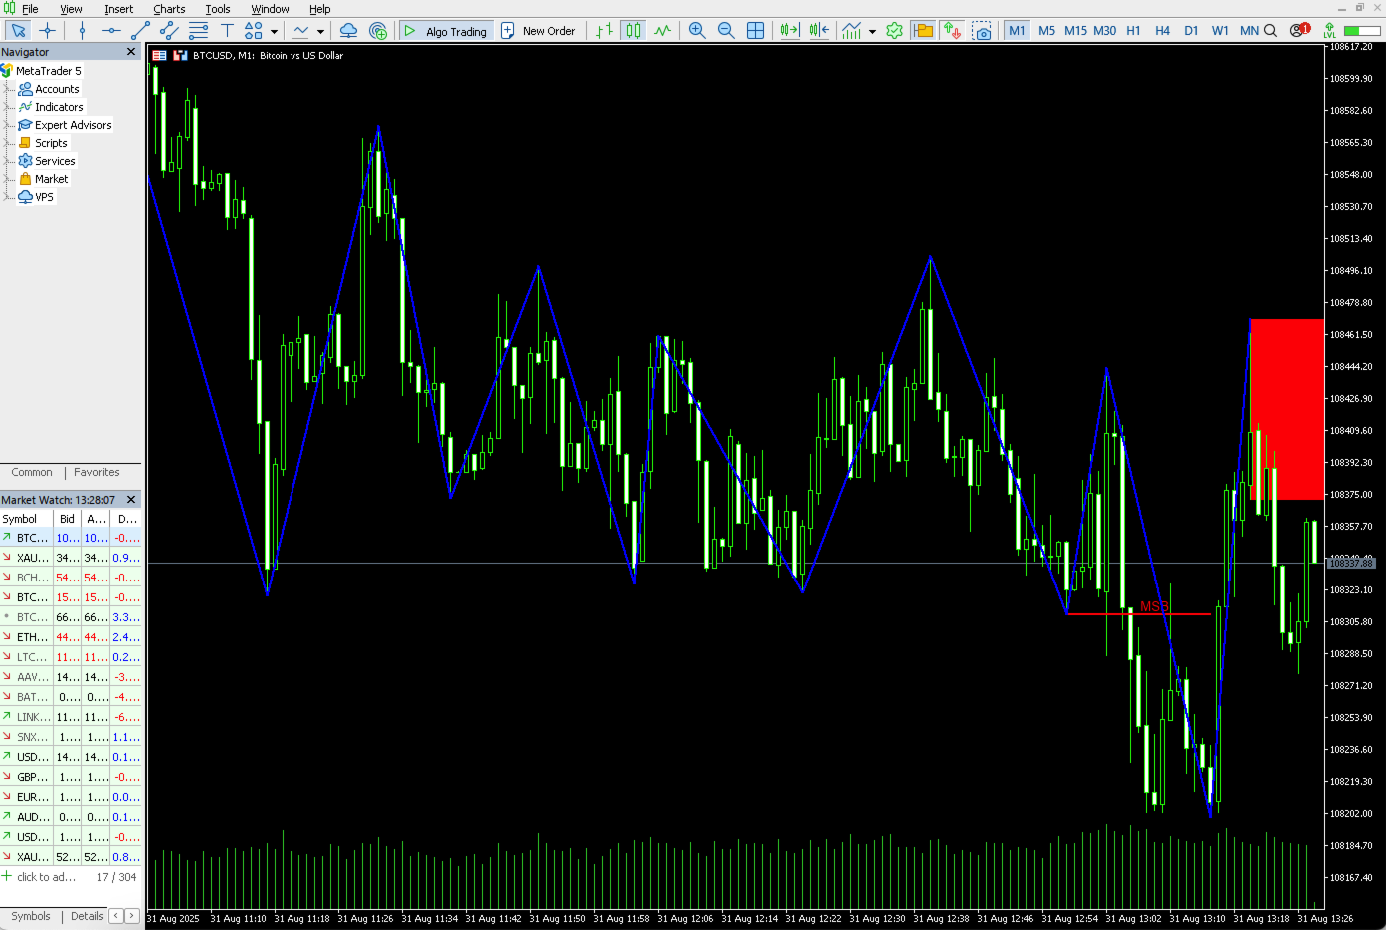
a. Structure Shift Line

This is a key event the indicator is programmed to detect.

  • Upward Shift Line (Blue): When the price closes above a recent high point identified by the indicator's algorithm.
  • Downward Shift Line (Red): When the price closes below a recent low point identified by the indicator's algorithm.

On the chart, the indicator will draw a horizontal line (blue for upward, red for downward) with a label to mark this event.

b. Highlighted Price Zones

These are specific price zones identified by the indicator's algorithm following a Structure Shift Line event.

  • Green Box: Identified as the last bearish candle before an upward price movement that resulted in an Upward Shift Line. The indicator draws this as a green box with a label.
  • Red Box: Identified as the last bullish candle before a downward price movement that resulted in a Downward Shift Line. The indicator draws this as a red box with a label.

c. Other Highlighted Zones

These are variations of the Highlighted Price Zones that the indicator also identifies under specific conditions. The indicator will draw additional labeled boxes (e.g., "Other Green Box" or "Other Red Box") based on its internal calculations.

3. How the Indicator Functions

The indicator first identifies specific price movements (Structure Shift Lines). Following these movements, it then automatically draws the corresponding visual elements (Highlighted Price Zones and Other Highlighted Zones) on the chart.

  • After an Upward Shift Line, the indicator will draw corresponding green boxes.
  • After a Downward Shift Line, the indicator will draw corresponding red boxes.

These visual elements are intended to assist traders in their own analysis of market behavior. It is up to the individual trader to interpret these signals and decide how to use them in their personal trading strategy.

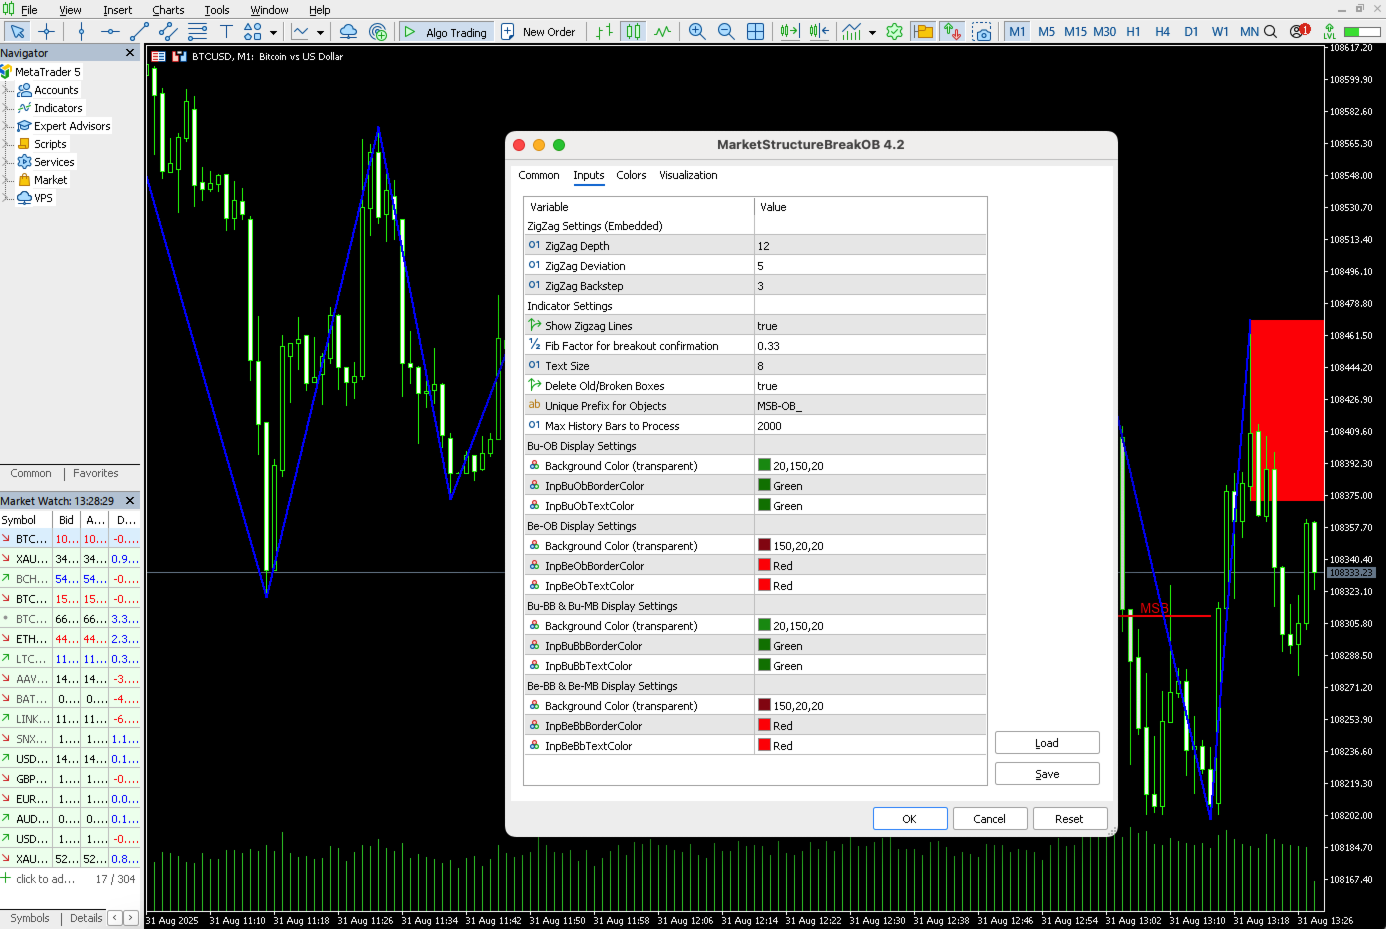
4. Input Parameters Explained

  • Pivot Identification Settings:
    • InpZigZagDepth , InpZigZagDeviation , InpZigZagBackstep : Technical parameters for the algorithm used to identify pivot points. Modifying these will change the sensitivity of the pivot point identification. It is recommended to use the default values unless you are familiar with the algorithm's mechanics.
  • Indicator Settings:
    • InpShowZigzag : true to display the ZigZag lines on the chart, false to hide them.
    • InpFibFactor : A factor used in the calculation to confirm a specific price movement. A smaller number makes the condition less strict, while a larger number makes it more strict. The default is 0.33 .
    • InpDeleteBoxes : true to automatically delete boxes that have been invalidated by subsequent price action, false to keep them on the chart for historical analysis.
  • Display Settings (Green Boxes, Red Boxes, Other Boxes):
    • These parameters allow for the customization of the border color, background color, and text color for all types of boxes drawn by the indicator.

Disclaimer: Trading on financial markets involves significant risk. Technical indicators are analytical tools and should not be considered as a trading signal or a guarantee of profit. Past performance is not indicative of future results. Always use risk management and make your own informed decisions.

Produtos recomendados
Valable ZigZag MT5
Sergey Ermolov
4.61 (18)
Versão MT4  | Indicador Trend Monitor VZ  |   Indicador Owl Smart Levels   |  Estratégia  Owl Smart Levels  |   FAQ A teoria das ondas de Elliott é uma interpretação dos processos nos mercados financeiros que se baseia em um modelo visual de ondas em gráficos de preços. O indicador Valable ZigZag exibe a estrutura de onda do mercado, na qual você pode confiar para tomar decisões comerciais. O indicador Valable ZigZag é mais estável e muitas vezes não muda sua direção como o indicador ZigZag clá
FREE
Free for now, price is going to be 30 USD at Jan 1. 2025. Features: Pin Bar Detection : The indicator is designed to identify bullish and bearish pin bars based on specific criteria, including the relative size of the candle’s body and shadow, as well as the position of the candle's body in relation to the 38.2% Fibonacci level. Customizable Labels : Custom text is displayed above each identified bullish or bearish pin bar, such as "[38.2]" for bullish and "[-38.2]" for bearish, helping traders
FREE
FVG Concept and Market Structure (MS) Indicator – Comprehensive Analysis with Interactive Control This is not just an indicator. It is a useful tool for market analysis. This indicator combines several analytical functions, making it one of the more complete solutions in its field. This tool represents a comprehensive solution for analyzing market behavior with the goal of forecasting the direction of price movement. The indicator is designed to assist the trader and not distract them with unnec
FREE
KT Renko Patterns MT5
KEENBASE SOFTWARE SOLUTIONS
O KT Renko Patterns analisa o gráfico Renko tijolo por tijolo para identificar padrões gráficos conhecidos que são amplamente utilizados por traders em diversos mercados financeiros. Em comparação com gráficos baseados em tempo, os gráficos Renko tornam a identificação de padrões muito mais fácil e visualmente clara, graças à sua aparência limpa e objetiva. O KT Renko Patterns possui vários padrões Renko, muitos dos quais são explicados com profundidade no livro "Profitable Trading with Renko
Only the first 5 copies will cost 50$ and then it will be converted to its original price.  Deposit 500$ Profit 2500$+ in 1 Month Gold Trading.   This robot works very well on gold. Gives good profit.  Key Features:  Very easy to use   Working symbols:  XAUUSD(GOLD) Working Timeframe: M1, M5, M30 All timeframe The minimum deposit $100, $500 Here you can adjust Lot Size, Auto lot, SL, TP, Trading Time, Profit pips, Percentage Equity, fixed ratio delta volume for lot size increasing with equity, 
XAU Steady Gain Pro
Sivakumar Subbaiya
XAU Steady Gain Pro: Institutional-Grade Neural Trading for XAU/USD Complete Trading Suite: Gain full market transparency. When you buy this EA, you’ll also receive two professional-grade Signal Generation Indicators to help you confirm every entry with institutional precision. MT4 Indicator Nebula Pullback System – Worth $50  : See the Indicator     https://www.mql5.com/en/market/product/162844 MT5 Indicator Quantum Cross Indicator – Worth $50 : See the Indicator     https://www.mql5.com/en/m
A nova versão torna este indicador uma ferramenta completa para estudo, análise e operação de padrões probabilísticos. Suas funções incluem: Monitor de porcentagem de múltiplos ativos no gráfico. Martingales configuráveis. Vinte e um padrões pré-configurados, incluindo padrões Mhi e C3. Um editor de padrões avançado para armazenar até 5 padrões personalizados. Modo Backtest para testar resultados com relatório de perdas. Filtro de tendência. Filtro de hits. Opção de Ciclos de Martingale. Vários
O   Indicador Supertrend para MT5   é uma ferramenta poderosa de acompanhamento de tendências projetada para ajudar os traders a identificar a direção do mercado com precisão. Baseado no   Average True Range (ATR) , ele se ajusta dinamicamente aos movimentos do preço, tornando-se adequado para diversos estilos de trading, como scalping, day trading e swing trading. Principais características: •   Detecção precisa de tendências   – Identifica claramente tendências de alta e baixa com uma linha
FREE
This indicator is, without a doubt, the best variation of the Gann Angles among others. It allows traders using Gann methods to automatically calculate the Gann angles for the traded instrument. The scale is automatically calculated when the indicator is attached to the chart. When switching timeframes, the indicator recalculates the scale for the current timeframe. Additionally, you can enter your own scales for the Gann angles. You can enter your own scales either for both vectors or for each
>>> CHRISTMAS SALE: -60% OFF!  - Promo price: $68 / Regular price $169 <<< - The promotion will end soon! Forex Pulse Detector – The 3-in-1 Trading Powerhouse Forex Pulse Detector is a one-of-a-kind expert advisor (EA) that combines three powerful trading functionalities in a single system: 1. Fully Automated Trading 2. Manual Trading Capability 3. AI-Driven Signal Execution That’s why we proudly call it a “3-in-1 Trading System.” Developed to capitalize on market impulses, Forex Pulse De
Historical Memory
Marat Sultanov
3.33 (3)
Indicator-forecaster. Muito útil como assistente, atua como um ponto-chave para prever o movimento do preço futuro. A previsão é feito usando o método de busca a parte mais semelhante no histórico (padrão). O indicador é desenhada como uma linha que mostra o resultado da alteração do preço de fechamento das barras. A profundidade do histórico, o número de barras na previsão, o tamanho e a qualidade alinhador de busca pode ser ajustado através das definições do indicador. Configurações: PATTERN_
FREE
Quantum Force
Mohamed Samsudeen
Quantum Force EA – Disciplined Automated Gold Trading System (No Martingale / No Grid Trading) Short Description Designed Around a 1:3 Risk-reward Structure on MQL5 MetaTrader 5 A disciplined and fully automated trading system for XAUUSD (Gold). Quantum Force EA combines adaptive logic gold scalping, volatility filters, trend following and capital protection techniques to rule-based trade execution without using martingale or grid strategies. Fully customise Full Description Quantum Force EA i
Smart Bitcoin Robot
Ralph Jordan Lipata De Jesus
SMART BITCOIN ROBOT -  Built by a 7-Figure Funded Trader Developed by an experienced funded trader with multiple  verified prop firm certificates (Check Profile) After many years of manual trading and achieving seven-figure funded accounts, I've automated my exact trading strategy into this powerful EA and  optimized for Bitcoin . But here's what makes it special: When the market moves against our position (because no strategy is 100% perfect), the SMART RECOVERY SYSTEM kicks in - protecting y
O indicador SMC Venom Model BPR é uma ferramenta profissional para os traders que trabalham com o conceito Smart Money (SMC). Identifica automaticamente dois padrões principais no gráfico de preços: FVG   (Fair Value Gap) é uma combinação de três velas, em que existe um gap entre a primeira e a terceira velas. Forma uma zona entre níveis onde não há suporte de volume, o que geralmente leva a uma correção de preço. BPR   (Balanced Price Range) é uma combinação de dois padrões FVG que formam uma
Volatix Ai
Michael Prescott Burney
5 (1)
Volatix AI: Descrição do Produto Aproveite o poder explosivo da volatilidade do ouro com o Volatix AI, a solução definitiva de scalping projetada para o gráfico XAUUSD M5. Você está cansado de EAs que falham durante oscilações rápidas de preço e eventos de alta volatilidade? Nosso sistema revolucionário foi construído para prosperar no caos, usando uma sofisticada rede neural para transformar a volatilidade do mercado em sua maior vantagem. No coração do Volatix AI está sua avançada rede neural,
Prizmal Logic
Vladimir Lekhovitser
5 (1)
Sinal de negociação ao vivo Monitoramento público em tempo real da atividade de negociação: https://www.mql5.com/pt/signals/2353471 Informações oficiais Perfil do vendedor Canal oficial Manual do usuário Instruções de configuração e uso: Ver manual do usuário Este Expert Advisor é baseado em uma estratégia de negociação orientada por regras. A estratégia tem como objetivo identificar condições específicas de mercado, em vez de manter exposição contínua. O sistema analisa o comportamen
Aurus Pivot XAU
Dmitriq Evgenoeviz Ko
AURUS PIVOT XAU PRO is a professional trading advisor for XAUUSD, based on working with key market zones and confirmed price behavior. The robot analyzes the market structure, evaluates the strength of levels, and opens trades only when several factors coincide. The advisor does not strive to be constantly in the market and avoids trading in unfavorable conditions, focusing on precise entries and risk control. Key Features Trading key support and resistance zones Filtering signals based on Price
Sonic R Pro Enhanced EA - Versão 2025 249$ Apenas para os primeiros 5 compradores! Sinal ao Vivo Verifique o desempenho ao vivo do Sonic R Pro Enhanced: Estratégia de Trading Sonic R Pro Enhanced é uma versão aprimorada da estratégia Sonic R, automatizando operações com base na Dragon Band (EMA 34 e EMA 89) e incorporando algoritmos avançados para maximizar o desempenho. Timeframes: M15, M30 Pares suportados: XAUUSD, BTCUSD, AUDJPY, USDJPY Estilo de Trading: Swing Trading - Retrações e
Triangle Pattern Gann v3.1 - Complete Feature Documentation Core Functionality OverviewTriangle Pattern Gann v3.1 is a sophisticated MetaTrader 5 indicator that combines W.D. Gann's geometric trading principles with advanced triangle pattern recognition to deliver actionable trading signals. Primary Features1. Triangle Pattern Detection SystemAscending Triangle Recognition Function: Automatically identifies bullish continuation patterns Detection Criteria: Flat horizontal resistance line
Wizard Poverty Sanitizer
Bonginkosi Innocent Khumalo
5 (1)
Wizard Poverty Sanitizer is a moving average based indicator, using three EMA'S being 2OO EMA which is the slow EMA, the 21 EMA which is the median and the 10 EMA which is the fast. When the median and the fast EMA cross a signal is given, when the fast EMA goes above the Median EMA a buying signal is given and when the fast cross below the median a selling is given. Note that you can change the moving averages to you own choices of moving averages, allowing you to set your own MA strategy.  an
FREE
SmartSetup Bot Is an advanced trading tool that combines the flexibility of manual configurations with the power of semi-automated features. It automatically generates graphical objects, displaying critical zones such as support and resistance levels, stop loss and take profit areas, and other essential indicators. SmartSetup Bot provides clear and precise visualization of your trading parameters, facilitating informed decision-making. This bot is designed for traders who value manual control bu
FREE
Mine Farm
Maryna Kauzova
Mine Farm is one of the most classic and time-tested scalping strategies based on the breakdown of strong price levels. Mine Farm is the author's modification of the system for determining entry and exit points into the market... Mine Farm - is the combination of great potential with reliability and safety. Why Mine Farm?! - each order has a short dynamic Stop Loss - the advisor does not use any risky methods (averaging, martingale, grid, locking, etc.) - the advisor tries to get the most
Tick Imbalance Bars
Henrique Helmuth Kreutz Pfeifer
Tick imbalance bars (TIB), descrito no livro Advances in Financial Machine Learning (2018) de Marcos López de Prado. Indicador que forma barras (candlesticks) com uma amostragem diferente da fixa por tempo. Utiliza dados em tempo real e pode ser usado como substituto do gráfico padrão. Cada barra é formada quando um certo equilíbrio é ultrapassado, devolvendo ao usuário os valores OHLC do agrupamento. O parâmetro de entrada  tick_threshold é o balanço esperado de uma barra. Quando excedido, um
FREE
Spike Phantom
Niccyril Chirindo
1 (1)
Spike Phantom   is a specialized indicator for PainX and GainX synthetic indices that generates trading signals with automatic alert notifications. Features The indicator analyzes market conditions using proprietary algorithms and displays buy/sell arrows directly on the chart. It works specifically with PainX and GainX indices on M5 timeframe. Signal generation combines multiple technical analysis methods to identify potential trading opportunities. The system provides two TP levels and SL cal
During volatile market conditions brokers tend to increase spread. int OnCalculate ( const int rates_total,                  const int prev_calculated,                  const datetime &time[],                  const double &open[],                  const double &high[],                  const double &low[],                  const double &close[],                  const long &tick_volume[],                  const long &volume[],                  const int &spread[])   {    int spread_array[];   
FREE
NOVIDADE!!! STOPS FIXOS , dando mais estabilidade ao robô e do jeito que você gosta! CANGACEIRO B3 TRADER é um robô especializado para negociação na Bolsa Brasileira B3 , em minicontratos de miniíndice ( WIN ) e minidólar ( WDO ). O robô tem como característica a entrada em operações na tendência do mercado (alta ou baixa), de acordo com pontos de entrada (trigger) consistentes e que podem ser configurados para cada ativo e gerenciamento de riscos. O robô Cangaceiro B3 Trader utiliza o indicad
- Displays horizontal lines for Previous Day High (PDH) and Previous Day Low (PDL) on the chart. - Customizable line colors via input parameters. - Sends sound alerts, pop-up notifications, and mobile push notifications upon the initial crossover of PDH or PDL. - Alerts are triggered only once per crossover event; they re-trigger only if the price moves away and re-crosses after a specified minimum interval. - Automatically updates the PDH/PDL levels at the start of each new day. - All indicator
FREE
Gold Smart Trend EA PRO Visão geral O Gold Smart Trend EA PRO é um Expert Advisor (EA) desenvolvido exclusivamente para o par XAUUSD (Ouro) . O sistema combina a lógica de tendência baseada na SMA200 , o filtro de RSI e o controle de volatilidade baseado no ATR para identificar movimentos de impulso na direção predominante do mercado, aplicando uma gestão de risco dinâmica. Não é necessária otimização — basta anexar ao gráfico e iniciar a negociação. Principais características Desenvolvido espec
GER40 Nova AI
Yusuke Matsuya
GER40 NovaAI — The Trading AI Beyond Human Emotion "Doubt", "Fear", and "Greed" are eliminated. A new era ruled by pure logic and precision begins. GER40 NovaAI is a fully autonomous trading AI built exclusively for the DAX40 (GER40). After thousands of hours of optimization, it filters out market noise and targets only the core of profitability. Let AI make the decisions and grow your capital with reason, not emotion. Why NovaAI Outperforms Other EAs Autonomous Decision-Making × Adaptive
Volatility 75 Machine
Ignacio Agustin Mene Franco
Volatility 75 Machine EA - Description General Information Name: Volatility 75 Machine v2.0 Developer: World Investor Platform: MetaTrader 5 (MQL5) Copyright: 2025 Trading Specifications Capital and Lot Size Settings Minimum Capital Required: $1,000 USD Standard Lot Size: 0.10 lots per $1,000 USD of capital Risk Management: Proportional to account size Recommended Timeframe Timeframe: M5 (5 minutes) Instrument: Volatility 75 Index Technical System Parameters Moving Average Indicators The EA im
Os compradores deste produto também adquirem
ARIPoint
Temirlan Kdyrkhan
1 (1)
ARIPoint is a powerful trading companion designed to generate high-probability entry signals with dynamic TP/SL/DP levels based on volatility. Built-in performance tracking shows win/loss stats, PP1/PP2 hits, and success rates all updated live. Key Features: Buy/Sell signals with adaptive volatility bands Real-time TP/SL/DP levels based on ATR Built-in MA Filter with optional ATR/StdDev volatility Performance stats panel (Success, Profit/Loss, PP1/PP2) Alerts via popup, sound, push, or email Cu
Se você comprar este indicador, receberá meu Gerenciador de Operações Profissional + EA  GRATUITAMENTE. Primeiramente, vale ressaltar que este Sistema de Trading é um Indicador Não Repintado, Não Redesenho e Não Atrasado, o que o torna ideal tanto para o trading manual quanto para o automatizado. Curso online, manual e download de predefinições. O "Sistema de Trading Inteligente MT5" é uma solução completa de trading projetada para traders novos e experientes. Ele combina mais de 10 indicadores
Power Candles MT5
Daniel Stein
5 (5)
Power Candles – Sinais de entrada baseados em força para qualquer mercado Power Candles leva a análise de força comprovada da Stein Investments diretamente para o seu gráfico de preços. Em vez de reagir apenas ao preço, cada candle é colorido com base na força real do mercado, permitindo identificar instantaneamente a construção de momentum, aceleração de força e transições limpas de tendência. Uma única lógica para todos os mercados Power Candles funciona automaticamente em todos os símbolos de
Divergence Bomber
Ihor Otkydach
4.9 (81)
Cada comprador deste indicador recebe adicionalmente, e de forma gratuita: A ferramenta exclusiva "Bomber Utility", que acompanha automaticamente cada operação, define os níveis de Stop Loss e Take Profit e fecha operações de acordo com as regras da estratégia; Arquivos de configuração (set files) para ajustar o indicador em diferentes ativos; Set files para configurar o Bomber Utility nos modos: "Risco Mínimo", "Risco Balanceado" e "Estratégia de Espera"; Um vídeo tutorial passo a passo que aju
***Entry In The Zone and SMC Multi Timeframe é uma ferramenta de análise de mercado em tempo real desenvolvida com base nos Smart Money Concepts (SMC). Ela foi projetada para ajudar os traders a analisarem a estrutura do mercado de forma sistemática e obterem uma visão mais clara da direção geral do mercado. O sistema analisa automaticamente Pontos de Reversão, Zonas-Chave e a Estrutura de Mercado em múltiplos timeframes, enquanto exibe Points of Interest (POI), sinais sem repaint e níveis autom
SuperScalp Pro
Van Minh Nguyen
5 (1)
SuperScalp Pro – Sistema avançado de indicador de scalping com múltiplos filtros SuperScalp Pro é um sistema avançado de indicador de scalping que combina o clássico Supertrend com múltiplos filtros inteligentes de confirmação. O indicador opera de forma eficiente em todos os timeframes de M1 a H4 e é especialmente adequado para XAUUSD, BTCUSD e principais pares Forex. Pode ser usado como sistema independente ou integrado de forma flexível a estratégias de trading existentes. O indicador integra
Azimuth Pro
Ottaviano De Cicco
5 (1)
PROMOÇÃO DE LANÇAMENTO O preço do Azimuth Pro está inicialmente definido em 299$ para os primeiros 100compradores. O preço final será de 499$ . A DIFERENÇA ENTRE ENTRADAS RETAIL E INSTITUCIONAIS NÃO É O INDICADOR — É A LOCALIZAÇÃO. A maioria dos traders entra em níveis de preço arbitrários, perseguindo momentum ou reagindo a sinais atrasados. As instituições esperam o preço atingir níveis estruturados onde oferta e demanda realmente mudam. Azimuth Pro mapeia esses níveis automaticamente: VWA
Obtenha o AUX GRATUITO e suporte EA  Download direto — Clique aqui [ D.I.C.E ] O DICE Indicator Divergence in Chaos Environment é uma ferramenta MT5 especializada criada para traders que aplicam a Teoria das Ondas de Elliott dentro das técnicas de Trading Chaos. Identifica divergências ocultas e regulares na ação do preço, sincronizadas com o ambiente de mercado caótico descrito por Bill Williams. Principais recursos Divergência alinhada com Ondas de Elliott: detecta divergências altistas e bai
O Game Changer é um indicador de tendências revolucionário, concebido para ser utilizado em qualquer instrumento financeiro, transformando o seu metatrader num poderoso analisador de tendências. O indicador não se retraça nem apresenta atrasos. Funciona em qualquer período de tempo e auxilia na identificação de tendências, sinaliza potenciais reversões, atua como um mecanismo de trailing stop e fornece alertas em tempo real para respostas rápidas do mercado. Quer seja um profissional experiente
Atomic Analyst MT5
Issam Kassas
4.07 (28)
Primeiramente, vale ressaltar que este Indicador de Negociação não repinta, não redesenha e não apresenta atrasos, tornando-o ideal tanto para negociação manual quanto automatizada. Manual do utilizador: configurações, entradas e estratégia. O Analista Atômico é um Indicador de Ação de Preço PA que utiliza a força e o momentum do preço para encontrar uma vantagem melhor no mercado. Equipado com filtros avançados que ajudam a remover ruídos e sinais falsos, e aumentam o potencial de negociação.
Smart Stop Indicator – Precisão inteligente de stop-loss diretamente no seu gráfico Visão geral O Smart Stop Indicator é a solução ideal para traders que desejam definir seu stop-loss de forma clara e metódica, sem adivinhações ou decisões baseadas apenas na intuição. A ferramenta combina lógica clássica de price action (topos mais altos, fundos mais baixos) com um sistema moderno de detecção de rompimentos para identificar onde realmente deve estar o próximo nível lógico de stop. Seja em tend
FX Power MT5 NG
Daniel Stein
5 (30)
FX Power: Analise a Força das Moedas para Decisões de Negociação Mais Inteligentes Visão Geral FX Power é a sua ferramenta essencial para compreender a força real das principais moedas e do ouro em quaisquer condições de mercado. Identificando moedas fortes para comprar e fracas para vender, FX Power simplifica as decisões de negociação e revela oportunidades de alta probabilidade. Quer você prefira seguir tendências ou antecipar reversões usando valores extremos de Delta, esta ferramenta adap
Trend Screener Pro MT5
STE S.S.COMPANY
4.84 (100)
Desbloqueie o poder da negociação de tendências com o indicador Trend Screener: sua solução definitiva de negociação de tendências, alimentada por lógica difusa e sistema de múltiplas moedas! Eleve sua negociação de tendências com o Trend Screener, o revolucionário indicador de tendências alimentado por lógica difusa. É um poderoso indicador de acompanhamento de tendências que combina mais de 13 ferramentas e recursos premium e 3 estratégias de negociação, tornando-o uma escolha versátil para to
Este é um indicador para MT5 que fornece sinais precisos para entrar em uma negociação sem redesenhar. Ele pode ser aplicado a qualquer ativo financeiro: forex, criptomoedas, metais, ações, índices. Ele fornecerá estimativas bastante precisas e informará quando é melhor abrir e fechar um negócio. Assista o vídeo (6:22) com um exemplo de processamento de apenas um sinal que compensou o indicador! A maioria dos traders melhora seus resultados de negociação durante a primeira semana de negociação c
Super Signal – Skyblade Edition Sistema profissional de sinais de tendência sem repintar / sem atraso com taxa de acerto excepcional | Para MT4 / MT5 Funciona melhor em timeframes mais curtos, como 1 minuto, 5 minutos e 15 minutos. Principais características: Super Signal – Skyblade Edition é um sistema inteligente de sinais desenvolvido especificamente para operações com tendência. Utiliza uma lógica de filtragem em múltiplas camadas para detectar apenas movimentos direcionais fortes sustenta
O indicador destaca as zonas onde há declaração de interesse no mercado e, em seguida, mostra a zona de acumulação de ordens . Ele funciona como um livro de ofertas em escala ampliada . Este é o indicador para o dinheiro grande . Seu desempenho é excepcional. Qualquer interesse que existir no mercado, você verá com clareza . (Esta é uma versão totalmente reescrita e automatizada — não é mais necessário fazer análise manual .) A Velocidade de Transação é um indicador de conceito novo que mostra o
FX Levels MT5
Daniel Stein
5 (12)
FX Levels: Suporte e Resistência com Precisão Excepcional para Todos os Mercados Visão Geral Rápida Procurando um meio confiável de identificar níveis de suporte e resistência em qualquer mercado—incluindo pares de moedas, índices, ações ou commodities? FX Levels combina o método “Lighthouse” tradicional com uma abordagem dinâmica de vanguarda, fornecendo uma precisão quase universal. Baseado em nossa experiência real com corretores e em atualizações automáticas diárias mais as de tempo real,
Antes de tudo, vale ressaltar que esta Ferramenta de Negociação é um Indicador Não Repintante, Não Redesenhante e Não Atrasado, o que a torna ideal para negociação profissional. Curso online, manual do utilizador e demonstração. O Indicador de Conceitos de Ação de Preço Inteligente é uma ferramenta muito poderosa tanto para traders novos quanto experientes. Ele combina mais de 20 indicadores úteis em um único, combinando ideias avançadas de negociação como Análise do Trader do Círculo Interno
Grabber System MT5
Ihor Otkydach
4.82 (22)
Apresento a você um excelente indicador técnico: Grabber, que funciona como uma estratégia de trading “tudo incluído”, pronta para usar. Em um único código estão integradas ferramentas poderosas de análise técnica de mercado, sinais de entrada (setas), funções de alertas e notificações push. Cada comprador deste indicador também recebe gratuitamente: Utilitário Grabber: ferramenta para gerenciamento automático de ordens abertas Vídeo tutorial passo a passo: como instalar, configurar e operar com
Shock Pullback
Suleiman Alhawamdah
5 (1)
De forma simples, você pode começar a operar quando o movimento dos números brancos — conhecidos como "pips" — começar a aparecer ao lado do candle atual. Os "pips" brancos indicam que uma operação de compra ou venda está ativa e se movendo na direção correta, conforme indicado pela cor branca. Quando o movimento dos pips brancos para e se transforma em uma cor verde estática, isso sinaliza o fim do momento atual. A cor verde dos números representa o lucro total obtido em "pips", independenteme
Market Structure Patterns
Samuel Manoel De Souza
4.47 (19)
Disponível para   MT4   e   MT5 . Junte-se ao canal Market Structure Patterns para baixar os materiais disponíveis para estudos e informações adicionais. Postagens relacionadas: Market Structure Patterns - Introduction Garanta agora com 50% de desconto | Preço anterior US$ 90 | Oferta válida até 31 de dezembro | Uma grande atualização está chegando em breve, e o preço original será ajustado. Market Structure Patterns   é um indicador baseado em   smart money concepts   que apresenta elementos
Quantum TrendPulse
Bogdan Ion Puscasu
5 (20)
Apresentando   Quantum TrendPulse   , a ferramenta de negociação definitiva que combina o poder do   SuperTrend   ,   RSI   e   Stochastic   em um indicador abrangente para maximizar seu potencial de negociação. Projetado para traders que buscam precisão e eficiência, este indicador ajuda você a identificar tendências de mercado, mudanças de momentum e pontos de entrada e saída ideais com confiança. Principais características: Integração SuperTrend:   siga facilmente a tendência predominante do
IX Power MT5
Daniel Stein
4.92 (12)
IX Power: Descubra informações de mercado para índices, commodities, criptomoedas e forex Visão Geral IX Power é uma ferramenta versátil projetada para analisar a força de índices, commodities, criptomoedas e símbolos de forex. Enquanto o FX Power oferece a máxima precisão para pares de moedas ao utilizar dados de todos os pares disponíveis, o IX Power foca exclusivamente nos dados do mercado do símbolo subjacente. Isso torna o IX Power uma excelente escolha para mercados fora do forex e uma o
ARIScalping
Temirlan Kdyrkhan
ARIScalp is a powerful trading companion designed to generate high-probability entry signals with dynamic TP/SL/DP levels based on volatility. Built-in performance tracking shows win/loss stats, PP1/PP2 hits, and success rates all updated live. Key Features: Buy/Sell signals with adaptive volatility bands Real-time TP/SL/DP levels based on ATR Built-in MA Filter with optional ATR/StdDev volatility Performance stats panel (Success, Profit/Loss, PP1/PP2) Alerts via popup, sound, push, or email Cus
ARICoins
Temirlan Kdyrkhan
ARICoin is a powerful trading companion designed to generate high-probability entry signals with dynamic TP/SL/DP levels based on volatility. Built-in performance tracking shows win/loss stats, PP1/PP2 hits, and success rates all updated live. Key Features: Buy/Sell signals with adaptive volatility bands Real-time TP/SL/DP levels based on ATR Built-in MA Filter with optional ATR/StdDev volatility Performance stats panel (Success, Profit/Loss, PP1/PP2) Alerts via popup, sound, push, or email Cust
Gold Sniper Scalper Pro
Ich Khiem Nguyen
3.5 (8)
Gold Sniper Scalper Pro é um indicator profissional para MetaTrader 5, projetado para auxiliar traders a identificar pontos de entrada e gerenciar risco de forma eficaz. O indicator fornece um conjunto completo de ferramentas de análise incluindo sistema de detecção de sinais, gestão automática de Entry/SL/TP, análise de volume e estatísticas de desempenho em tempo real. Guia do usuário para entender o sistema   |   Guia do usuário para outros idiomas RECURSOS PRINCIPAIS Sistema de detecção
FX Dynamic MT5
Daniel Stein
5 (5)
FX Dynamic: Acompanhe a Volatilidade e as Tendências com Análise ATR Personalizável Visão Geral FX Dynamic é uma ferramenta poderosa que utiliza cálculos de Average True Range (ATR) para fornecer aos traders insights incomparáveis sobre a volatilidade diária e intradiária. Ao configurar limites de volatilidade claros —por exemplo, 80%, 100% e 130%—, você pode identificar rapidamente oportunidades de lucro ou receber alertas quando o mercado ultrapassar faixas normais. FX Dynamic se adapta ao f
PZ Swing Trading MT5
PZ TRADING SLU
5 (5)
Swing Trading é o primeiro indicador projetado para detectar oscilações na direção da tendência e possíveis oscilações de reversão. Ele usa a abordagem de negociação de linha de base, amplamente descrita na literatura de negociação. O indicador estuda vários vetores de preço e tempo para rastrear a direção da tendência agregada e detecta situações nas quais o mercado está sobrevendido ou sobrecomprado em excesso e pronto para corrigir. [ Guia de instalação | Guia de atualização | Solução de prob
Introduction to X3 Chart Pattern Scanner X3 Cherart Pattern Scanner is the non-repainting and non-lagging indicator detecting X3 chart patterns including Harmonic pattern, Elliott Wave pattern, X3 patterns, and Japanese Candlestick patterns. Historical patterns match with signal patterns. Hence, you can readily develop the solid trading strategy in your chart. More importantly, this superb pattern scanner can detect the optimal pattern of its kind. In addition, you can switch on and off individu
Trend Forecaster
Alexey Minkov
5 (7)
The Trend Forecaster indicator utilizes a unique proprietary algorithm to determine entry points for a breakout trading strategy. The indicator identifies price clusters, analyzes price movement near levels, and provides a signal when the price breaks through a level. The Trend Forecaster indicator is suitable for all financial assets, including currencies (Forex), metals, stocks, indices, and cryptocurrencies. You can also adjust the indicator to work on any time frames, although it is recommen
Mais do autor
Trend Lines v2 MT5
Quang Huy Quach
5 (1)
Trend Lines v2 MT5 is an intelligent auto trendline indicator that instantly detects key dynamic support and resistance zones. Built on pivot high/low structure, it delivers a clear and accurate view of market trends across all timeframes. Features Fully automatic trendline drawing based on precise pivot points. Filters out noise – only clean and reliable trendlines are shown. Control the number of lines to keep your chart neat and easy to read. Flexible customization: colors, line thickness, ra
FREE
Breakout Finder MT5
Quang Huy Quach
5 (1)
The "Breakout Finder" is a technical indicator designed to automatically identify potential price breakouts and breakdowns on a chart. The highlight of this indicator is its robust signal filtering system, which helps traders avoid false signals (fakeouts) and focus on higher-probability trading opportunities. Key Features Automatic Pivot Point Detection: The indicator automatically identifies significant pivot highs and lows on the chart to establish potential support and resistance levels. Bre
FREE
The "Support Resistance Dynamic" indicator is a powerful technical analysis tool for the MetaTrader 5 platform, designed to automatically identify and plot dynamic Support and Resistance zones on price charts. This indicator helps traders easily recognize important price levels, potential reversal points, or breakout areas, thereby enabling more informed trading decisions. 2. Key Features Dynamic S/R Identification : Automatically identifies support and resistance zones based on an advanced Pivo
FREE
The Linear Regression Channel is a powerful technical analysis tool that helps visually identify the prevailing trend and potential price zones. Essentially, the indicator performs two main functions: It draws a trendline through the center of price action over a specified period. This line is calculated using the linear regression method, which results in the best possible "line of best fit" for the price data. From this center line, the indicator plots two parallel lines above and below, creat
FREE
The Supertrend indicator is a trend-following technical analysis tool designed to help traders identify the direction of market trends and potential entry/exit points. It operates based on price data and Average True Range (ATR) to create a dynamic signal line that changes color depending on the current trend. Green color: Indicates an uptrend. Red color: Indicates a downtrend. Supertrend is a useful indicator for both short-term and long-term trading, helping to filter out market noise and focu
FREE
1. Overview The Scalping PullBack Signal indicator is a powerful technical analysis tool designed to help traders identify scalping opportunities based on potential pullback and reversal signals. This tool is particularly useful on lower timeframes (below 15 minutes) but can also be applied on higher timeframes for longer-term trades. This indicator integrates several key analytical components, providing a comprehensive view of trends and potential entry/exit points, helping you make quick and e
FREE
The Pivot Point Supertrend indicator is a technical analysis tool designed for the MetaTrader 5 (MT5) platform. It combines two popular analytical methods: Pivot Points: Uses significant historical price highs and lows to identify potential support and resistance zones. These points are objective and stable. Supertrend: A well-known trend-following indicator that helps identify the current market trend and provides dynamic stop-loss levels. Indicator's Goal: By using the stability of Pivot Point
FREE
The MultiFrameRSIIndicator is a powerful MetaTrader 5 (MT5) indicator that leverages the Relative Strength Index (RSI) to analyze trends across multiple timeframes. This indicator synchronizes RSI-based trend signals from up to nine timeframes (M1, M5, M15, M30, H1, H4, D1, W1, MN1) and presents them with clear visual feedback, including a colored RSI line, signal arrows, and a customizable dashboard. Ideal for traders seeking momentum-based trend confirmation. Features Multi-Timeframe Analysis
FREE
The MultiFrameTrendAnalyzer is a versatile MetaTrader 5 (MT5) indicator designed to provide multi-timeframe trend analysis using Moving Average (MA) crossovers. This indicator synchronizes trend signals across multiple timeframes (M1, M5, M15, M30, H1, H4, D1, W1, MN1) and displays them with intuitive visual cues, including a colored trend line, signal arrows, and a customizable dashboard. Features Multi-Timeframe Analysis : Evaluates trends across up to nine timeframes, allowing traders to conf
FREE
TMA Overlay
Quang Huy Quach
TMA Overlay Indicator for MT5 - User Guide 1. Introduction TMA Overlay is a versatile technical analysis indicator for the MetaTrader 5 platform. The indicator's goal is to provide traders with a comprehensive overview of the trend, potential entry signals, and key trading sessions, all integrated into a single chart. This is not a trading system, but a comprehensive analysis tool designed to help you make more informed decisions. 2. Core Indicator Components The indicator consists of multiple c
FREE
Welcome to Ultimate MA MTF , a multi-functional Moving Average (MA) indicator converted from the original TradingView version by ChrisMoody and upgraded with many powerful features. This is not just a typical MA line. It is a comprehensive technical analysis tool designed to provide traders with deep insights into trends, volatility, and potential trading signals, all within a single indicator. Key Features 8 Moving Average Types: Full support for the most popular MA types (SMA, EMA, WMA, HullMA
FREE
The MTF (Multi-Timeframe) Candles indicator is a powerful tool that allows you to display candles from a higher timeframe (e.g., H1, H4, D1) directly on a lower timeframe chart (e.g., M5, M15, M30). The Problem It Solves: Instead of constantly switching back and forth between charts to analyze the main trend and detailed price action, this indicator merges both perspectives into one. You can instantly see the "big picture" while staying focused on trading signals on your current timeframe. Core
FREE
1. Introduction Smart Volume S/R Pro is a powerful technical analysis tool designed for the MetaTrader 5 platform. Unlike traditional Support & Resistance (S/R) indicators that rely on price peaks and troughs, this indicator automatically identifies critical S/R zones based on a core factor: Trading Volume . Core Principle: Price levels that witnessed exceptionally high trading volume in the past will often become significant psychological zones, where the price is likely to react strongly (eith
FREE
Ichimoku V2
Quang Huy Quach
1. Overview The Ichimoku Kinko Hyo (or Ichimoku Cloud) is a comprehensive, all-in-one technical analysis indicator designed to provide a deep understanding of market trends, momentum, and dynamic support and resistance levels. This indicator provides a clean, standard implementation of the five core Ichimoku lines. Its key feature is a non-intrusive Status Dashboard that gives you an at-a-glance summary of the current market situation according to the Ichimoku system, allowing for quick and effi
FREE
The "Volume Range Profile with Fair Value" (VRPFV) indicator is a powerful volume analysis tool designed to help traders better understand market structure and identify key price areas where significant institutional activity occurs. Instead of just looking at volume on individual candlesticks, VRPFV analyzes the distribution of volume by price level within a specific time range, providing deep insights into the "footprint" of smart money. VRPFV consists of the following core components: Upper &
FREE
The Multi-Frame MACD Indicator is a robust MetaTrader 5 (MT5) indicator that utilizes the Moving Average Convergence Divergence (MACD) to analyze trends across multiple timeframes. This indicator synchronizes MACD-based trend signals from up to nine timeframes (M1, M5, M15, M30, H1, H4, D1, W1, MN1) and presents them with clear visual cues, including a colored MACD line, signal arrows, and a customizable dashboard. Perfect for traders seeking momentum and trend reversal insights. Features Multi-
FREE
Ultimate EMA
Quang Huy Quach
Multi-Period EMA is a convenient indicator that displays multiple Exponential Moving Averages (EMAs) on a single chart. It is designed to help traders easily identify market trends and key crossover points without the need to add multiple individual EMA indicators. Key Features: Multiple EMAs in one: Simplifies chart analysis by combining several EMA lines into one indicator. Fully customizable: Easily change the period (default 20, 50, 100, 200), color, and thickness of each EMA line. Clean in
FREE
MultiFrame Pivot MT5
Quang Huy Quach
5 (1)
MultiFrame Pivot: A Multi-Timeframe Analysis Tool MultiFrame Pivot is an analysis indicator designed to provide an overview of the market based on Pivot Points across multiple timeframes. The indicator synthesizes information from different timeframes to give you a more comprehensive view of important price levels. KEY FEATURES: Multi-Timeframe Analysis: MultiFrame Pivot allows you to simultaneously monitor the price's status relative to Pivot Points (PP), Support 1 (S1), and Resistance 1 (R1)
FREE
1. Introduction The Market Squeeze Momentum Indicator (SQZMOM_LB) is a powerful technical analysis tool designed to help traders identify periods of low market volatility (the "squeeze" phase) and predict the direction and strength of price momentum after the squeeze ends. This indicator combines the principles of Bollinger Bands and Keltner Channels to detect changes in market volatility, along with a momentum oscillator to measure buying/selling pressure. 2. Key Components of the Indicator The
FREE
The WaveTrend Oscillator indicator is an enhanced version of the classic WaveTrend Oscillator, a momentum indicator. It is designed to identify overbought/oversold conditions and provide potential trend reversal signals. The core difference in this version is the application of a data "normalization" algorithm. This ensures the indicator's oscillation lines remain balanced around the zero line, causing the indicator window to always stay naturally centered. This is especially useful when trading
FREE
RSI Ultimate MTF
Quang Huy Quach
5 (1)
1. Introduction The CM_Ultimate_RSI_MTF is a powerful and versatile custom indicator for MetaTrader 5, designed to enhance your Relative Strength Index (RSI) analysis. It provides multi-timeframe (MTF) capabilities, visual signals, and customizable alerts, making it an invaluable tool for traders seeking to identify overbought/oversold conditions, trend strength, and potential entry/exit points across various timeframes. 2. Key Features Multi-Timeframe (MTF) Analysis: Allows you to view RSI from
FREE
The Vix_Fix indicator, or "Vix Fix," is a tool designed to identify potential market bottoms. It operates on the principle of measuring extreme fear or pessimism among the crowd, which are moments when the market often has a high probability of reversing to the upside. Main Purpose: To help traders find high-probability BUY (Long) entry points by identifying when the market is "oversold." How it Works In simple terms, the Vix Fix measures the distance between the current bar's Low and the Highes
FREE
Fibonacci Bollinger Bands (FBB) Indicator - User Manual 1. Introduction Fibonacci Bollinger Bands (FBB) is a technical analysis indicator that combines three tools: Bollinger Bands , Fibonacci Ratios , and the Volume-Weighted Moving Average (VWMA) . The purpose of this indicator is to provide a multi-dimensional view of the market by helping to identify: Dynamic support and resistance zones. The general market trend. Volatility levels and potential accumulation phases (squeezes). Price breakouts
FREE
MultiFrame MA
Quang Huy Quach
5 (1)
MultiFrame MA: A Multi-Timeframe Trend Indicator MultiFrame MA is a trend analysis indicator designed to provide a comprehensive market overview across various timeframes. Instead of relying on a single timeframe, this tool synthesizes information from multiple charts, giving users a holistic and reliable perspective. KEY FEATURES: Multi-Timeframe Analysis: The indicator analyzes data from various timeframes, from M1 up to Monthly, to help users identify trend confluence at different levels. MA
FREE
Volume Flow Indicator (VFI) - User Manual 1. General Introduction The Volume Flow Indicator (VFI) is an advanced technical oscillator designed to measure the strength and sustainability of a price trend by incorporating both price and volume data. Developed based on the concepts of On-Balance Volume (OBV) but with significant improvements, the VFI provides deeper insight into money flow and the conviction behind price movements. This indicator is not an automated trading system but a powerful an
FREE
MultiFrame Volume Trend (MFVI) is a powerful VWAP-based indicator that displays volume trends across multiple timeframes in a clean, easy-to-read dashboard directly on your chart. Instantly capture the overall market direction in just seconds. Features Multi-timeframe VWAP analysis from M1 to MN1. Dashboard panel shows the trend state of each timeframe at a glance. Plots VWAP line and buy/sell arrows directly on the chart. Fully customizable: colors, line width, panel position, arrow symbols. Bu
FREE
The Smart Trend Tracker (OTT) is a technical analysis tool designed to help traders identify the direction and strength of a market trend. This indicator functions as an optimized moving average that adapts to market volatility, thereby providing dynamic support and resistance levels. The primary goal of the OTT is to smooth out price action and offer visual cues about potential changes in the trend. Core Components of the Indicator When you add the indicator to your chart, you will see two main
FREE
1. Overview The ATR Dynamic Stop (CE) is a powerful technical indicator designed to help traders identify and follow market trends. Its core function is to provide a dynamic trailing stop-loss based on price volatility, as measured by the Average True Range (ATR) indicator. The main objectives of the ATR Dynamic Stop are: Profit Optimization: It helps you ride a strong trend by setting a reasonable stop-loss, preventing premature exits due to minor market noise and fluctuations. Risk Management:
FREE
This indicator is a trading strategy designed to find high-probability entry points by combining two very popular indicators: Bollinger Bands (BB) and the Relative Strength Index (RSI) . The core idea is "dual confirmation" : a trade signal is only considered valid when both indicators agree. This helps filter out many of the false signals that occur when using just a single indicator, thereby increasing the reliability of each entry. Bollinger Bands are used to identify relative price value zon
FREE
The EMA Navigator Pro is an advanced version of the popular EMA indicator, designed to provide superior flexibility and multi-timeframe analysis capabilities. This indicator not only displays EMA lines but also offers a powerful alert system to ensure you never miss a crucial signal. Key Features: Multi-Timeframe Support: You can assign a separate timeframe to each individual EMA line, allowing you to analyze long-term (e.g., D1) and short-term (e.g., H1) trends on the same chart. Automatic Cro
FREE
Filtro:
Sem comentários
Responder ao comentário