Volume Delta Panel

4.8

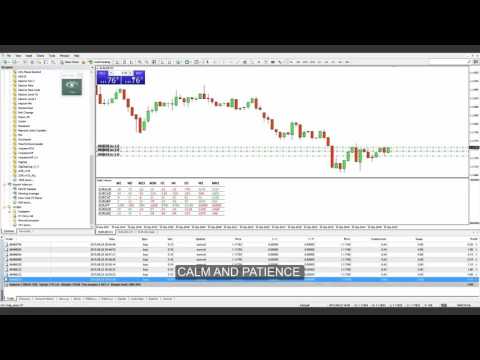
Volume DeltaPanel is a very powerful indicator that read the supply on Market.

It calculates the Delta from movement of the price and the difference of BUY volumes and SELL volumes.

The Volumes are added to price and normalized to symbol points.

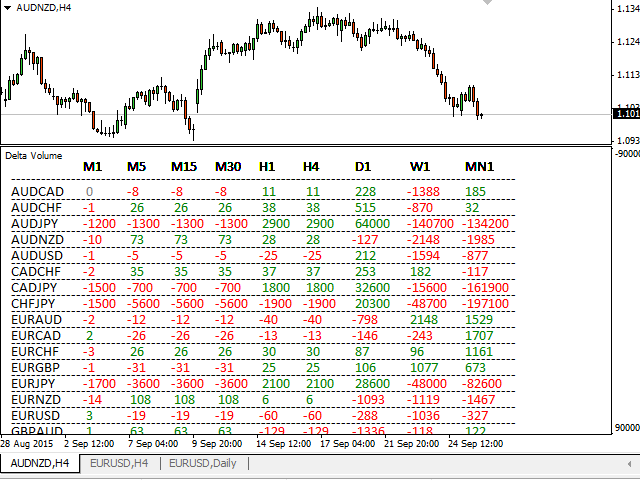
Its special structure allows you to get all Time Frames values available on the platform MT4.

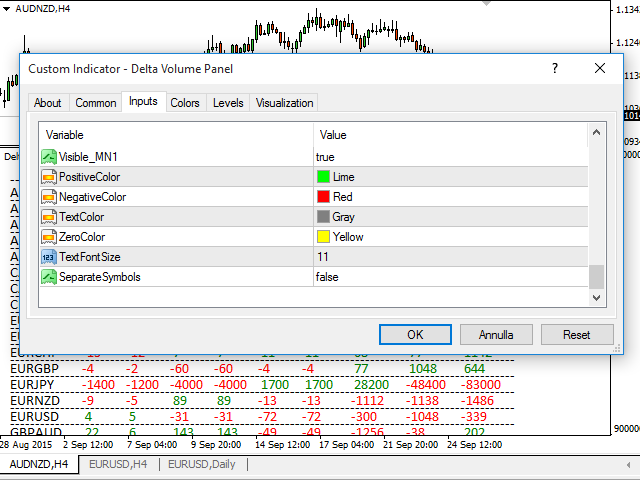
Panel can show 28 instruments simultaneously all customizable according to the offer of the Broker.

A good observation of this instrument can suggest great entry points and possible reversal.

We are confident that this tool will help you to improve your trading timing.

Note: to see the total Forex market, download the Delta Volume profile for MT4 here https://goo.gl/pmvXyg

Input values:

  • 28 Symbols - to delete one, leave NULL
  • Visible_ .. - enable/disable Time Frames M5, M15, M30, H1, H4, D1, W1, MN1
  • Colors - for Positive Values, Negative Values, Zero Value for neutral, General Text
  • TextFontSize
  • Spacing Between Elements in Pixels
  • SeparateSymbols - true/false to introduce a separator every symbol


Avis 19
Kandasamy Senthil Kumar
338
Kandasamy Senthil Kumar 2020.06.22 10:53 
 

great indicator

katototo
1066
katototo 2019.06.19 12:35 
 

Works well . Thanks.

Aravind Kolanupaka
9749
Aravind Kolanupaka 2017.01.20 02:10 
 

Ultimate reliable indicator

Produits recommandés
Market Profile with Dashboard Indicator - Complete User Guide indicator Overview The Market Profile with Dashboard is a comprehensive trading analysis tool for MetaTrader 4 that displays market profile data, volume analysis, and key market structure information directly on your chart. This indicator helps traders identify significant price levels, market balance areas, and potential trading opportunities based on market profile theory. Core Components and Features Market Profile Display - Sh
GT_Volume - это универсальный индикатор подходящий для всех валютных пар. Показывает текущий объем на горизонтальных уровнях. Объемы рисуются по мере движения цены. Все просто и нет ни чего лишнего. Индикатор очень помогает быстро определить сильные уровни сопротивления и поддержки, работает шустро! Есть возможность поменять цвет и выбрать день на котором отображать объемы.
Market Marker MT4
Evgeny Shevtsov
5 (8)
The indicator displays peak levels of activity formed by the maximum volume, tracks the correlation of the candles on all timeframes (from the highest to the lowest one). Each volume level is a kind of key trading activity. The most important cluster is inside a month, week, day, hour, etc. Indicator operation features A volume level receives Demand status if the nearest volume level located to the left and above has been broken upwards. A volume level receives Supply status if the nearest volu
VWAP Indicator MT4
Kyra Nickaline Watson-gordon
5 (1)
Description : VWAP (Volume-Weighted Average Price) is the ratio of the value traded to total volume traded over a particular time horizon. It is a measure of the average price at which pair is traded over the trading horizon. Read More. All Symbols and All Timeframes are supported. Indicator Inputs :     VWAP Mode : Mode of VWAP Calculation. Options can be selected : Single,Session,Daily,Weekly,Monthly     Volumes : Real Volumes,Tick Volumes     Price Type : Used price for calculating.
Market Profile Heat indicator  — is a classic Market Profile implementation that can show the price density over time, outlining the most important price levels, value area, and control value of a given trading session. This indicator can be attached to timeframes between M1 and D1 and will show the Market Profile for daily, weekly, monthly, or even intraday sessions. Lower timeframes offer higher precision. Higher timeframes are recommended for better visibility. It is also possible to use a fr
Blahtech Market Profile
Blahtech Limited
4.53 (15)
Was: $249  Now: $99   Market Profile defines a number of day types that can help the trader to determine market behaviour. A key feature is the Value Area, representing the range of price action where 70% of trading took place. Understanding the Value Area can give traders valuable insight into market direction and establish the higher odds trade. It is an excellent addition to any system you may be using. Blahtech Limited presents their Market Profile indicator for the MetaTrader community. Ins
BoxProfile MT4
Evgeny Shevtsov
4.92 (12)
The indicator displays volume profiles based on the nesting principle. Profiles periods are pre-set so that each subsequent profile has a length twice as long as the length of the previous profile. In addition to profiles, the indicator displays volume clusters sorted by color, depending on the volume they contain. Indicator operation features The indicator works on typical timeframes from M5 to MN, but for calculations uses historical data from smaller timeframes: M1 - for timeframes from M5
FREE
Blahtech Supply Demand
Blahtech Limited
4.58 (36)
Was: $299  Now: $99   Supply Demand uses previous price action to identify potential imbalances between buyers and sellers. The key is to identify the better odds zones, not just the untouched ones. Blahtech Supply Demand indicator delivers functionality previously unavailable on any trading platform. This 4-in-1 indicator not only highlights the higher probability zones using a multi-criteria strength engine, but also combines it with multi-timeframe trend analysis, previously confirmed swings
Cet indicateur est basé sur la transformée de Hartley discrète. L'utilisation de cette transformation vous permet d'appliquer différentes approches lors du traitement des séries chronologiques financières. Une caractéristique distinctive de cet indicateur est que ses lectures ne se réfèrent pas à un point sur le graphique, mais à tous les points de la période de l'indicateur. Lors du traitement d'une série temporelle, l'indicateur permet de sélectionner différents éléments de la série temporell
This is a volume profile where you can customize the time period you want. You can do this with a line or choose automatic functions such as showing the volume from the last time period. The indicator also shows the maximum volume value (VPOC - VOLUME POINT OF CONTROL) and the average value, colors and settings you can adjust as you like, there are many possibilities. If you need an indicator that shows the constant volume time frames there is  ...HERE... Volume Profile  is an advanced charting
In the age of speed, everyone wants to gets what he/she wants quickly. Trading is all about gaining money, and scalping is a way of doing it in a short time. The "Scorpion Scalper Pro" has been named on the scorpion because of its speed. The indicator serves to provide signals for the M15 timeframe. It also sends Alerts (window alert, email alert, push notification alert) whenever a buy/sell signal occurs, and the alerts are customizable (they can be turned ON or OFF). Indicator inputs : - Buy
Market Profile 3
Hussien Abdeltwab Hussien Ryad
3 (2)
Market Profile 3 MetaTrader 4 indicator  — is a classic Market Profile implementation that can show the price density over time, outlining the most important price levels, value area, and control value of a given trading session. This indicator can be attached to timeframes between M1 and D1 and will show the Market Profile for daily, weekly, monthly, or even intraday sessions. Lower timeframes offer higher precision. Higher timeframes are recommended for better visibility. It is also possible t
FREE
Un indicateur technique qui calcule ses lectures sur les volumes de transactions. Sous forme d'histogramme, il montre l'accumulation de la force de mouvement de l'instrument de trading. Il dispose de systèmes de calcul indépendants pour les directions haussières et baissières. Fonctionne sur tous les instruments de trading et délais. Peut compléter n’importe quel système commercial. L'indicateur ne redessine pas ses valeurs, les signaux apparaissent sur la bougie actuelle. Il est facile à utilis
BoxChart MT4
Evgeny Shevtsov
4.4 (5)
The market is unfair if only because 10% of participants manage 90% of funds. An ordinary trader has slim changes to stand against these "vultures". This problem can be solved. You just need to be among these 10%, learn to predict their intentions and move with them. Volume is the only preemptive factor that faultlessly works on any timeframe and symbol. First, the volume appears and is accumulated, and only then the price moves. The price moves from one volume to another. Areas of volume accumu
Basic Volume Profile
Mehran Sepah Mansoor
Découvrez la puissance de l'analyse des volumes avec notre indicateur de profil de volume pour Metatrader ! / Version MT5 Basic Volume Profile est un indicateur spécialement conçu pour les traders manuels qui cherchent à optimiser leur trading. L'indicateur Volume Profile est un outil essentiel pour tout trader sérieux cherchant à mieux comprendre le comportement du marché. Grâce à notre solution innovante, vous pouvez visualiser de manière claire et concise la manière dont le volume des trans
Indicator (includes Volume Profile + Order Blocks) - a revolutionary indicator that combines two of the most powerful concepts of modern technical analysis: volume profiles and institutional players' order blocks. This tool allows you to see what is hidden from most traders and gives you a significant advantage in the market. Key benefits of the indicator: Visualization of "smart money": Clearly shows the areas of concentration of large players, highlighting areas with maximum volume in bright
FRB Time MT4
Fernando Baratieri
FRB Time - FRB Trader Indicator that shows the server's time of operation. You can edit the font color and size of the timetable. Settings font color Font size Background color To move the Timetable, just click on it and move the mouse to where you want to leave it. After placing the Time where you want it, click again or press "ESC" and the time will stay where you left it.
FREE
Forex Volume MT4
KEENBASE SOFTWARE SOLUTIONS
KT Forex Volume affiche le volume d'achat et de vente d'une paire de devises sous forme d'histogramme coloré. Le volume est composé des transactions d'achat et de vente sur un actif. Sur le marché des changes (Forex) : Si le volume d'achat dépasse le volume de vente, le prix de la paire de devises augmente. Si le volume de vente dépasse le volume d'achat, le prix de la paire de devises diminue. Fonctionnalités Évitez les mauvaises transactions en les confirmant avec les données de volume par ti
The Market Sentiment Meter indicator calculates the saturation levels of the price chart. A signal to exit the oversold zone indicates a buying opportunity, and a signal to exit the overbought zone indicates a selling opportunity. Typically, for this indicator you need to set relative values for the overbought (Top) and oversold (Bottom) levels. Often a good trend can be seen visually on the price chart. However, an experienced trader must clearly understand the current distribution of forces
Simple QM Pattern
Suvashish Halder
4.5 (2)
Simple QM Pattern is a powerful and intuitive trading indicator designed to simplify the identification of the Quasimodo (QM) trading pattern. The QM pattern is widely recognized among traders for effectively signaling potential reversals by highlighting key market structures and price action formations. This indicator helps traders easily visualize the QM pattern directly on their charts, making it straightforward even for those who are new to pattern trading. Simple QM Pattern includes dynamic
FREE
This indicator incorporates built-in volume statistics, identifying true liquidity zones based on real-time trading volume and comparing it to the volume of the last 500 candlesticks. Based on the identified results, liquidity zones are plotted on the chart, indicating potential price swings. We typically identify key liquidity zones that have not yet been breached in larger timeframes, then look for suitable entry opportunities in smaller timeframes. When the price touches a key liquidity zone
Introducing the Delta Volume Profile Indicator - Unleash the Power of Institutional Precision!  Technical Indicator: Are you ready to trade like the pros? The Delta Volume Profile Indicator is no ordinary tool. It’s a high-precision, cutting-edge indicator that puts the power of institutional-grade trading in your hands. This unique indicator analyses delta volume distribution in real-time, revealing the market's hidden buy/sell imbalances that the biggest financial institutions rely on to antic
The indicator allows you to trade binary options. The recommended time frame is М1 and the expiration time is 1,2,3 minutes. The indicator suitable for auto and manual trading. A possible signal is specified as a arrows above/under a candle. You should wait until the candle closes! Arrows are not re-painted Trade sessions: TOKYO section (Half-end) Currency pairs: USD/JPY Working time frame: M1 Expiration time: 1,2,3 minutes. The indicator also shows good results when using the martingale strateg
FREE
Indicator is used for: defining price probability distributions. This allows for a detailed representation of the channel and its borders and forecast the probability of a price appearing at each segment of its fluctuations; defining the channel change moment.   Operation principles and features Indicator analyzes a quote history on lower timeframes and calculates a price probability distribution on higher ones. Forecast algorithms allow the indicator to calculate probability distributions and m
The   Visual Volatility Clustering   indicator clusters the market based on volatility. The indicator does not redraw and gives accurate data, does not use closing prices. Uses the opening prices or the highs or lows of the previous completed bar. Therefore, all information will be clear and unambiguous. The essence of the indicator is to divide the price market into certain areas according to a similar type of volatility. This can be done in any way. In this example, the indicator is configure
Market Profile
Artem Titarenko
5 (1)
The "Market Profile" indicator displays the profiles and volumes of periods – weekly, daily, session (8-hour), 4-hour, hour, summary. The VAH/VAL price area is automatically highlighted by a dotted line for each profile (except for the summary). The indicator includes chroma Delta, which colors the profile areas. The areas of prevailing Buys is colored in green, that of Sells - in red. The intensity histogram features blue/red respectively. In the filter mode, the indicator displays the volume a
The Rally Base Drop SND Pivots indicator uses "Rally", "Base", and "Drop" Candles to determine pivot points at which supply and demand (SND) levels are drawn. (Figure 1)   USAGE Figure 2 Rally, Base, and Drop (RBD) candles create a formula for seeing market structure through a fixed methodology. We are able to use this concept to point out pivot areas where Rallies and Drops directly meet. The RBD SND Pivots are similar to traditionally identified "fractal" pivot points, with one key differ
VolumeProfile
Robert Hess
3.8 (5)
Descption: The Volume Profile displays detailed informations of historical trading activities at certain price levels (Market Profile). So you can locate the areas with the best prices in the market and get an advantage about other market participants. Features: Customizable Volume Profile / Market Profile Shows the "fair" Value Area with 70% of all Volume Shows critical low volume zones Shows VPOC, VAL and VAH Points Works on all timeframes Also available for MT5 ( https://www.mql5.com/en/mark
Volume Analysis Trader looks at volume using a fixed average of volume. This averaging helps spot when volume is rising or declining. Also I have added volume spikes which are when volume suddenly is above the average. These help spot market reversals. This will hep a trader look for the following in their trading: Rising volume during a rally shows trend is strong. Falling volume on a rally shows trend is weakening. As a rule of thumb on daily charts if current volume is higher than yesterday's
The   Real Flow Defense Levels   indicator is a proprietary tool designed to identify and plot   significant, high-conviction price zones   directly onto your main trading chart. It uses a dynamic, volume-based analysis to determine where the market has previously demonstrated the   strongest defense or concentration of activity . These plotted lines serve as   dynamic support and resistance levels , highlighting the prices where major participants are most likely to enter or defend their positi
Les acheteurs de ce produit ont également acheté
Meravith
Ivan Stefanov
5 (1)
L'indicateur analyse le volume à partir de chaque point et calcule les niveaux d'épuisement du marché pour ce volume. Il se compose de trois lignes : Ligne d'épuisement du volume haussier Ligne d'épuisement du volume baissier Une ligne indiquant la tendance du marché. Cette ligne change de couleur pour refléter si le marché est haussier ou baissier. Vous pouvez analyser le marché à partir de n'importe quel point de départ que vous choisissez. Une fois qu'une ligne d'épuisement du volume est atte
Scalper Inside PRO
Alexey Minkov
4.74 (69)
An exclusive indicator that utilizes an innovative algorithm to swiftly and accurately determine the market trend. The indicator automatically calculates opening, closing, and profit levels, providing detailed trading statistics. With these features, you can choose the most appropriate trading instrument for the current market conditions. Additionally, you can easily integrate your own arrow indicators into Scalper Inside Pro to quickly evaluate their statistics and profitability. Scalper Inside
Actuellement 20% de réduction ! La meilleure solution pour tout débutant ou trader expert ! Ce logiciel de tableau de bord fonctionne sur 28 paires de devises. Il est basé sur 2 de nos principaux indicateurs (Advanced Currency Strength 28 et Advanced Currency Impulse). Il donne un excellent aperçu de l'ensemble du marché Forex. Il montre les valeurs de l'Advanced Currency Strength, la vitesse de mouvement des devises et les signaux pour 28 paires de devises dans tous les (9) délais. Imaginez
Currency Strength Exotics
Bernhard Schweigert
4.88 (33)
ACTUELLEMENT 20% DE RÉDUCTION ! La meilleure solution pour tout débutant ou trader expert ! Cet indicateur est spécialisé pour montrer la force de la devise pour tous les symboles comme les paires exotiques, les matières premières, les indices ou les contrats à terme. C'est le premier de son genre, n'importe quel symbole peut être ajouté à la 9ème ligne pour montrer la force réelle de la devise de l'or, l'argent, le pétrole, DAX, US30, MXN, TRY, CNH etc. Il s'agit d'un outil de trading unique
Advanced Supply Demand
Bernhard Schweigert
4.91 (296)
Year-End Trading SALE – Save 50% While It Lasts! Best Solution for any Newbie or Expert Trader! This indicator is a unique, high quality and affordable trading tool because we have incorporated a number of proprietary features and a new formula. With this update, you will be able to show double timeframe zones. You will not only be able to show a higher TF but to show both, the chart TF, PLUS the higher TF: SHOWING NESTED ZONES. All Supply Demand traders will love it. :) Important Information Re
Si vous achetez cet indicateur, vous recevrez mon Gestionnaire de Trading Professionnel   + EA  GRATUITEMENT. Tout d'abord, il convient de souligner que ce système de trading est un indicateur non repeint, non redessiné et non retardé, ce qui le rend idéal pour le trading manuel et automatisé. Cours en ligne, manuel et téléchargement de préréglages. Le "Système de Trading Smart Trend MT5" est une solution de trading complète conçue pour les traders débutants et expérimentés. Il combine plus de
Cet indicateur est un indicateur d'analyse automatique des vagues, parfait pour le trading pratique ! Cas... Remarque :   je n'ai pas l'habitude d'utiliser des noms occidentaux pour l'évaluation des vagues. En raison de l'influence de la convention de dénomination de Tang Lun (Tang Zhong Shuo Zen), j'ai nommé la vague de base comme   un stylo   et la bande d'onde secondaire comme   un segment   . en même temps, le segment a la direction de la tendance.Le   segment de tendance principal   est no
FX Power MT4 NG
Daniel Stein
4.95 (20)
FX Power : Analysez la force des devises pour des décisions de trading plus intelligentes Aperçu FX Power est l'outil essentiel pour comprendre la force réelle des principales devises et de l'or, quelles que soient les conditions du marché. En identifiant les devises fortes à acheter et les faibles à vendre, FX Power simplifie vos décisions de trading et révèle des opportunités à forte probabilité. Que vous suiviez les tendances ou anticipiez les retournements à l'aide de valeurs extrêmes de D
Looking for a powerful yet lightweight swing detector that accurately identifies market structure turning points? Want clear, reliable buy and sell signals that work across any timeframe and any instrument? Buy Sell Arrow MT Swing is built exactly for that — precision swing detection made simple and effective. This indicator identifies Higher Highs (HH) , Higher Lows (HL) , Lower Highs (LH) , and Lower Lows (LL) with remarkable clarity. It is designed to help traders easily visualize market str
Dynamic Forex28 Navigator
Bernhard Schweigert
4.43 (7)
Dynamic Forex28 Navigator - L'outil de trading Forex de nouvelle génération. ACTUELLEMENT 49 % DE RÉDUCTION. Dynamic Forex28 Navigator est l'évolution de nos indicateurs populaires de longue date, combinant la puissance de trois en un : Advanced Currency Strength28 Indicator (695 avis) + Advanced Currency IMPULSE avec ALERT (520 avis) + CS28 Combo Signals (Bonus). Détails sur l'indicateur https://www.mql5.com/en/blogs/post/758844 Qu'offre l'indicateur de force de nouvelle génération ? Tout
ACB Breakout Arrows
KEENBASE SOFTWARE SOLUTIONS
4.15 (34)
L'indicateur ACB Breakout Arrows fournit un signal d'entrée clé sur le marché en détectant un modèle de rupture spécifique. Il analyse en continu le graphique à la recherche d'une dynamique qui s'installe dans une direction et affiche un signal précis juste avant un mouvement majeur.  Obtenez le scanner multi-symboles et multi-timeframes ici : Scanner pour ACB Breakout Arrows MT4 Fonctionnalités principales Les niveaux de Stop Loss et Take Profit sont fournis automatiquement par l’indicateur. P
ACTUELLEMENT 26% DE RÉDUCTION La meilleure solution pour tout débutant ou trader expert ! Cet indicateur est un outil de trading unique, de haute qualité et abordable car nous avons incorporé un certain nombre de caractéristiques exclusives et une nouvelle formule. Avec seulement UN graphique, vous pouvez lire la force de la devise pour 28 paires Forex ! Imaginez comment votre trading va s'améliorer parce que vous êtes capable de repérer le point de déclenchement exact d'une nouvelle tendance
SMC Blast Signal with FVG, BOS and trend Breakout The SMC Blast Signal  is a  Precise trading system for Meta Trader 4 that uses Smart Money Concepts (SMC) , including Fair Value Gaps (FVG) and Break of Structure (BOS) , to identify high-probability trades. It incorporates a Trend Filter using a higher timeframe moving average, ensuring trades align with the prevailing market trend. TREND SIGNAL-FVG DETECTION-BOS DETECTION-TRADE CONFIRMED-Precise Signal entries on m15  Best TF-M15 AND ABOVE Be
Entry Points Pro
Yury Orlov
4.62 (172)
Indicateur supérieur pour MT4 fournissant des signaux précis pour entrer dans un trade sans repeindre ! Il peut être appliqué à tous les actifs financiers : forex, cryptocurrencies, métaux, actions, indices.  La version MT5 est ici Il fournira des signaux de trading assez précis et vous dira quand il est préférable d'ouvrir un trade et de le fermer. Regardez la vidéo (6:22) avec un exemple de traitement d'un seul signal qui a rapporté à l'indicateur ! La plupart des traders améliorent leurs
Hidden Cycles
Lev Vladimirovic Marushkin
5 (1)
Black Friday Sale – Limited Time! Grab Hidden Cycles for only $129 (regular price $179 ). This is your chance to boost your strategy with a powerful, easy-to-use cycle-based trading tool. Offer ends soon — don’t miss it! Based on Universal Laws — NOT Some Guy’s Algorithm: Let the market adjust to the Hidden Cycles Geometry — not the other way around. Most indicators are based on a man-made formula. They often lag, fail over time, or need constant re-optimization.  Hidden Cycles is different.
Adaptive Volatility Range [AVR] is a powerful tool for identifying key trend reversal points. AVR accurately reflects the Average True Range (ATR) of volatility, taking into account the Volume-Weighted Average Price (VWAP). The indicator adapts to any market volatility by calculating the average volatility over a specific period, ensuring a stable rate of profitable trades. You receive not just an indicator but a professional automated trading system , AVR-EA . Advantages: Automated Trading Sys
Royal Wave Pro M4
Vahidreza Heidar Gholami
5 (3)
Royal Wave is a Trend-Power oscillator which has been programmed to locate and signal low-risk entry and exit zones. Its core algorithm statistically analyzes the market and generates trading signals for overbought, oversold and low volatile areas. By using a well-designed alerting system, this indicator makes it easier to make proper decisions regarding where to enter and where to exit trades. Features Trend-Power Algorithm Low risk Entry Zones and Exit Zones Predictions for Overbought and Over
RelicusRoad Pro
Relicus LLC
4.63 (106)
Combien de fois avez-vous acheté un indicateur de trading avec de **grands backtests,** une **preuve de performance sur compte réel** avec des chiffres fantastiques et des **statistiques partout**, mais après l'avoir utilisé, vous **finissez par vider votre compte ?** Vous ne devriez pas faire confiance à un signal seul, vous devez savoir pourquoi il est apparu en premier lieu, et c'est ce que RelicusRoad Pro fait de mieux ! Manuel de l'utilisateur + Stratégies + Vidéos de formation + Groupe pr
FX Volume
Daniel Stein
4.62 (37)
FX Volume : Découvrez le Sentiment du Marché tel que perçu par un Courtier Présentation Rapide Vous souhaitez faire passer votre approche de trading au niveau supérieur ? FX Volume vous fournit, en temps réel, des informations sur la manière dont les traders particuliers et les courtiers sont positionnés—bien avant la publication de rapports retardés comme le COT. Que vous visiez des gains réguliers ou recherchiez simplement un avantage plus solide sur les marchés, FX Volume vous aide à repére
CONGESTION BREAKOUT PRO This indicator scans the breakout of congestion zones . This indicator unlike any other congestion indicator you will find in the market right now,  it uses an advanced algorithm not peculiar to most traditional congestion indicators available today . The advanced algorithm used to define the congestions  is greatly responsible for the high rate real congestion zones and low rate fake congestion zones spotted by this product. UNDERSTANDING CONGESTION Congestion are ar
OrderFlow Absorption – Indicateur professionnel de delta et de signaux d’absorption pour MT4 Libérez la puissance de l’analyse réelle du flux d’ordres avec OrderFlow Absorption – l’indicateur ultime d’histogramme delta et de signaux d’absorption pour MetaTrader 4. Conçu pour les traders qui veulent comprendre ce qui se passe réellement derrière chaque mouvement de prix, cet outil révèle la pression d’achat/vente cachée et les événements d’absorption qui font bouger le marché. Fonctionnalités Vis
Extreme Value Sniper is a detrended price indicator  Indicator finds the potential reversal levels by checking value ranges and price cycles. MT5 Version of the product :  https://www.mql5.com/en/market/product/114550 It shows the overbought and oversold levels using the average range. Overbought Levels are between 4 and 10 Oversold levels are bewtween -4 and -10 Those levels can be used as a reversal levels. Extreme Value Sniper look for some special divergence and convergence patterns to c
L'indicateur « Dynamic Scalper System » est conçu pour la méthode de scalping, permettant de trader au sein des vagues de tendance. Testé sur les principales paires de devises et l'or, il est compatible avec d'autres instruments de trading. Fournit des signaux pour l'ouverture de positions à court terme le long de la tendance, avec un support supplémentaire pour les fluctuations de prix. Principe de l'indicateur : De grandes flèches déterminent la direction de la tendance. Un algorithme de gén
PZ Swing Trading
PZ TRADING SLU
5 (3)
Protect against whipsaws: revolutionize your swing trading approach Swing Trading is the first indicator designed to detect swings in the direction of the trend and possible reversal swings. It uses the baseline swing trading approach, widely described in trading literature. The indicator studies several price and time vectors to track the aggregate trend direction and detects situations in which the market is oversold or overbought and ready to correct. [ Installation Guide | Update Guide | Tro
Le système de négociation technique des flèches de renversement de BB a été développé pour prédire les points inversés pour prendre des décisions de vente au détail. La situation actuelle du marché est analysée par l'indicateur et structurée pour plusieurs critères: l'attente des moments d'inversion, des tournants potentiels, des signaux d'achat et de vente. L'indicateur ne contient pas d'informations excédentaires, a une interface visuelle compréhensible, permettant aux commerçants de prendre
Trend Viewer Pro
Raymond Gilmour
5 (4)
SEE THE TREND ON EVERY TIME FRAME. INTELLIGENT INDICATOR READS PRICE ACTION TO SPOT TRUE MARKET CYCLES AND TREND. This advanced multi-currency and multi-time frame indicator, reads trend in real-time so you always know the trends of the markets you want to trade.  ​Trend-Viewer Pro has been specifically designed to read the trend of every time frame and every market , simultaneously, making it much easier for you to find markets with time frame correlation , so you can focus on the best markets
Full Scalping Signal
Leandro Bernardez Camero
FullScalping est un indicateur sans repeinture, sans backpainting , spécialement conçu pour générer des entrées de scalping CONSTANTES sur tous les marchés. Parfait pour les traders agressifs recherchant une action continue ! Rejoignez le canal pour rester informé avec des informations exclusives et des mises à jour : https://www.mql5.com/en/channels/forexnewadvisor Vous remarquerez qu'il donne des signaux sur presque chaque bougie , soit pour confirmer la tendance, soit pour signaler des retr
The price is indicated only for the first   30 copies  ( only      3  copies left ).                                             The next price will be increased to    $150 . The final price will be    $250. Sniper Delta Imbalance is a professional tool for deep delta analysis — the difference between buyer and seller volumes. It takes volume analysis to the next level, allowing traders to see in real time who controls the price — buyers or seller
NAM Order Blocks
NAM TECH GROUP, CORP.
3.67 (3)
MT4 Multi-timeframe Order Blocks detection indicator. Features - Fully customizable on chart control panel, provides complete interaction. - Hide and show control panel wherever you want. - Detect OBs on multiple timeframes. - Select OBs quantity to display. - Different OBs user interface. - Different filters on OBs. - OB proximity alert. - ADR High and Low lines. - Notification service (Screen alerts | Push notifications). Summary Order block is a market behavior that indicates order collection
The Nihilist 5.0 Indicator includes Forexalien and Nihilist Easy Trend trading strategies and systems. It is composed of an MTF Dashboard where you can analyze the different input possibilities of each strategy at a glance. It has an alert system with different types of configurable filters. You can also configure which TF you want to be notified on your Metatrader 4 platform and Mobile application The indicator has the option to view how could be a TP and SL by using ATR or fixed points, even w
Plus de l'auteur
Time Range Separator  is a useful tool to display a separator period on your platform. You could go in the properties of the indicator, select the desired range and that's ALL. We believe it is a useful and necessary that we wish to share with you for free all our followers. Input Values: TimeFrame = Period Separator Separator_Color = Vertical Color Line Separator_Style = Vertical Color Style Separator_Width = Vertical Line Width Good trading to all and see you soon. Same indicator for MT4 here
FREE
Delta Single Volume
Chantal Sala
3.67 (3)
Volume Delta is a very powerful indicator that reads the supply on the Market. It calculates the Delta from movement of the price and the difference of BUY and SELL Tick volumes. Its special structure allows you to get all timeframe values available on the MT4 platform. A good observation of this instrument can suggest great entry points and possible reversal. We are confident that this tool will help you to improve your trading timing. See also for MT5:  https://www.mql5.com/en/market/product/5
Time Range Separator
Chantal Sala
4.83 (6)
Time Range Separator is a useful tool to display a separator period on your platform. You could go in the properties of the indicator, select the desired range and that's ALL. We believe it is a useful and necessary that we wish to share with you for free all our followers. Input Values: TimeFrame Period Separator GMT_Hour (ex. +1 or -1) to move the lines at Period Time +/- tot hours in input Hide_dates to show or hide the datetime on vertical lines VLine_Color = Vertical Color Line VLine_Style
FREE
Delta Single Volume is a very powerful indicator that reads the supply on the Market. It calculates the Delta from movement of the price and the difference of BUY and SELL volumes. Its special structure allows you to get all timeframe values available on the MT5 platform. It works on Tick Volumes and Real Volumes (if avalaibles on your Broker). A good observation of this instrument can suggest great entry points and possible reversal. We are confident that this tool will help you to improve you
This is a utility to copy in Expert Advisor folder. The EA will force the download of your History Center MetaTrader. It will not download new data from your broker but it will aid your MT4 to charge every chart correctly. You can choose the symbols to download. After the launch, the EA will be removed automatically from the chart. After the launch, you can see results under Experts panel on MT4. The log will show you the data charged or not charged. Symbol TF = Number of candles charged. Ex: Su
FREE
Volume Spyke
Chantal Sala
4 (1)
The Volume Spike indicator is a useful tool to identify the directional market's intention. How Does It Work: The Volume Spike indicator identifies the volume peaks and creates a sensitive rectangle equipped with Alert and Warning Pop Up that it suggests the market's direction. This tool has the ability to select the time frame on which to do the analysis of volume and it gives a great visual signal colored into rectangle. The indicator can identify valid market signals but it can also suggest
HLOC
Chantal Sala
5 (3)
High Low Open Close Levels The indicator HLOC is a good ally to correctly identify the appropriate trend of price. The indicator is designed to be minimally invasive and it shows a visual and sound aid in order to take decision on the market. The indicator is equipped with sound alert and window alert in order to have a reminder of the price movements. We suggest you watch the video below to evaluate its operational benefits. Input values: Show Level (true/false) TimeFramePeriod (refer to lines
InfoPanelMarket
Chantal Sala
3.5 (4)
Informational indicator which shows: Swap Price under/upper Open for every Time Frame Spread Time to close the current candle Broker Time Net Change: delta in percentage from Open (MN-W1-D1) Tick Value Volumes Info for every trades open: Lots Breakeven Profit Buy-Profit Sell Equity Symbol Positive values are green and negative values are red (modifiable in input). Inputs: View BE line (enable/disable) View all Symbol (shows the list of symbol) Color (for every text) Line Color (for BE line)
This panel is very simple to use and it is a very ally to manage your positions and orders. Also you can modify your risk, writing in fields directly on Panel. One click on buttons and the operation on market is done! Operations possible: BUY/SELL Break Even Split (close 50% all orders) Close All positions Hedging (opens reverse positions to cover) Close only BUY positions Close only SELL positions Close All pending orders Reverse all positions Please watch the video to verify the very simple u
BreakEven Line is a very useful and easy to use indicator. In case of multiple positions opened on the same instrument, the indicator shows the breakeven point where it is possible to close the positions. Its graphic simplicity makes it an unobtrusive and customizable tool. You can enable/disable a line on a chart, so you can make the indicator invisible. Inputs Show cumulative BE (line on/off) Breakeven line color (to change the line color) Breakeven line style Breakeven line width Show short B
Volume POC
Chantal Sala
5 (2)
Volume POC The Volume POC indicator displays important levels. You can use it as an independent trading system. Warning functions at a candle closing allow you to have some information on the market direction. The graphical display is simple and effective. The levels reported are the result of the study of historical market volumes. These levels give excellent entry points and excellent levels of support and resistance. You can use the indicator also on very low timeframes. It is suitable for t
Open All
Chantal Sala
The Open All indicator uses a simple market information that is "Open Candle". This tool is able to show all the openings of all time frames in order to extract information of strength and trendy. You can display 28 instruments with relative time frame interior for a total of 252 informations. The display is fully customizable, you can choose either the symbol and enable/disable Time Frames. Using it correctly you could get valuable aid to intercept correlations and turning points in the market.
The indicator Net Change is a very useful tool able to extrapolate a percentage in order to have a real reference on the performance of the instrument. This indicator is designed to show the main values: you could monitor the Daily, Weekly, Monthly, Quarterly, Semi-annual and Annual percentages. A necessary tool for those who want to really explore the quantitative logic of the market. Input values SYMBOLS SETTINGS Use_Only_Current_Symbol (true/false): Permits to manage only current symbol on p
Best And Worst
Chantal Sala
5 (1)
The Best and Worst indicator (similar to Net Change Indicator) has the peculiarity of being a dynamic indicator. It seems a very Stock Exchange Indicator. This means that it is able to draw up a list and put in order the best and worst instruments in descending order. You can choose to show the percentage of any Time Frame: 1M, 5M, 15M, 30M, H1, H4 etc ... This instrument could really give great suggestions on your trading in order to center the right time and to have a total view of the markets
Price Trend Light
Chantal Sala
4 (1)
Price Trend Light indicator is a beautiful indicator that shows purchasing areas and sales areas. This indicator is designed to follow the movement of the price which rounds on the opening price. It also provides information of trend follow on the break of the minimum and maximum. The indicator has a very simple graphic but effective, above the opening price you will have a light green color and under the opening price there is a red light. On every Break Out of the minimum or maximum sets in in
The indicator Power Strength creates a virtual display that takes data from all Symbols. It extrapolates all the informations in order to get the strength and / or weakness to take a decision on market. This tool works only on the Forex Market and not processing data on indices, metals ... It is graphically very attractive and its simplified information could give excellent input signals. You can use this indicator to find inputs on daily or short-term operations or scalping. Input Values PANEL
Zoom Price It is a very useful tool that is designed to ZOOM the price positioning on one of the 4 corners of the graph. In addition to display function of the price indicator, Zoom Price is equipped with a check on Bullish or Bearish Breakout Signal that change the label color. Zoom Price is a simple tool that can provide useful informations to improve your operational performance. Input Values: myPeriod - TF to consider for Break Out O Signal LABEL SETTINGS Bullish BreakOut Color Bearish Break
The Price Action Dashboard is an innovative tool to help the trader to control a large number of financial instruments. This tool is designed to automatically suggest signals and price conditions. The Dashboard analyzes all major Time Frame suggesting price action conditions with graphic elements. The Dashboard can suggest you the strength of the trend identifying directional movement, it is an indispensable tool for those who want to open position themselves using market trends identifiers. The
Master Trend Dashboard is a new generation indicator, compact, light and efficient. Each element of this Dashboard is designed to return specific signals as: Price Action, Breakout, Net Change (performance of the instrument), algorithmic studies, correlations and statistical calculations. This tool will change your way of trading allowing you to receive important information. See the Graphic Signals to understand every single signal below: Graphic Signals Symbol name and arrow color Green = Cur
Box Chart
Chantal Sala
5 (1)
The indicator Box Chart is a very useful analysis tool that allows you to know the value of the range in points. The range is written in a label and also it is draw in a rectangle. This indicator works on multi timeframe and you can upload more indicators on same chart to analyze more time frames ranges. The analysis of the range is done following W. G. Gann school. The observation of the range on little time frame returns some good information of trend or reversal. Box Chart is a simple indicat
Navigator FX
Chantal Sala
5 (1)
The Navigator is a next-generation panel very easy to use. Apply this indicator on the chart to navigate very quickly through all the symbol and timeframes listed in input. The arrows manage the zoom and time frames. You can customize both the graphic colors and the list of symbols to display. A quick and easy tool that it will help to analyse the charts. Input Values Show_TF_Panel (true/false) it permits to show/hide panel with TF and Arrows 32 symbols COLORS AND SIZE SETTINGS BUTTON_WIDTH But
Market Pressure is a next-generation display. Its simple and intuitive graphics system allows you to receive directions very easy and fast. This indicator can give three different methods of signals: Scalping, Intraday and Multiday. The logic is based on the price action which combined on multiple time frame. It can give very high quality signals. An indispensable tool for those who want to understand the market pressure and the operating trend. The indicator is customizable for both colors for
OCO News Order Manager in an Expert Advisor to Trading News . The usability makes this tool an excellent ally for FAST operations on NEWS Time. We recommend that you try it on demo account to understand what kind of decimals using your broker to set your input values. The EA is usable on every Markets. On news time the spread could be manage from Broker, please make attention. Main functionalities Open STOP PENDINGS ORDER a number of seconds (in input) before News Time Floating of pending order
Dax Scalping Bracket is a new generation Expert Advisor Panel. This a very professional tool for SCALPING. The usability makes this tool an excellent ally for FAST operations of SCALPING on Index instruments and Forex market. The main feature of this EA is the ability to open multiple operations with a single click. Each position is autonomous and you can set different take profit and stop loss for each position. Special functionalities: STOP MOVE to manage your stop chasing the price BREAK EVEN
Bid Ask Level is a very simple indicator but, at the same time, very powerful . Using the logic of the minimum and maximum of the previous periods is able to intercept the important levels of demand and supply. The indicator permits setting the numbers of history candles to read very important levels in the past and show them in the current chart. You can see these power levels with horizontal lines designed on the chart. The indicator also permits uploading many different levels (of different t
Market Pressure Dashboard is a new generation utility. Its main function is to assist you and give you operational ideas optimizing your analytical work. Using this utility you could monitor a lots of financial instruments (max 28 symbols FOREX) in a very simple way. The Market Pressure indicator allows you to customize the internal list of the symbols to be monitored. The opening function and position management with this panel will be much more comfortable and navigation charts very powerful.
Risk Reward indicator is a very useful tool that allows you to observe in real time the performance risk of a trade. Its use is very simple, just drag it into the chart and see the Risk Reward percentage (for ex: 1:2). We have also included the possibility of extending/reducing the lines in order to observe the important price levels. You can change your levels clicking directly on lines and dragging the level to a new position. The levels will be set very fast with only a click. The indicator k
Open Line
Chantal Sala
3 (1)
The Open Line indicator is a simple indicator that tracks the opening levels of more time sessions. This version allows the user to check the opening levels using different time time frames. It is possible to add on the same chart different Open Lines to have more important horizontal levels. The colors and lines are fully customizable also for the label text. A simple indicator but very powerful to give you a proper orientation for your trading. Input Values TimeFrame (to show the open price t
Swing High Low
Chantal Sala
5 (2)
Swing High Low Pattern Recognition is a great indicator able to fix price levels and analyze the market swings. Swing High Low uses a dynamic approach of analysis that allows you to identify easily the best entry levels. The indicator using the minimum and maximum periods of the previous candles to analyze the impulsive movement and finally it sets the entry levels. The entry levels are: fast, good and best . The best is the last confirm of the swing. For a correct use we advise to wait the comp
Target Geometry
Chantal Sala
4 (4)
Target Geometry is a next-generation indicator that uses the geometric nature of the markets to give high statistical probability levels ( Fibonacci ). This indicator creates a very important map that optimizes the entry points and it optimally defines your own money management. The indicator can be used both in static mode or in dynamic mode, you can use it on any financial instrument. The use in multi timeframe mode is a very good ally to have. The target levels are high statistical probabilit
Filtrer:
elite luis
3483
elite luis 2023.02.28 17:48 
 

L'utilisateur n'a laissé aucun commentaire sur la note

Domingo Tatis
23
Domingo Tatis 2021.09.27 14:22 
 

I have a problem i can,t install other time in my mt4

mastercano
66
mastercano 2020.11.02 17:11 
 

L'utilisateur n'a laissé aucun commentaire sur la note

Yahia Ismail Ibrahim El Mughrabi
971
Yahia Ismail Ibrahim El Mughrabi 2020.08.25 00:19 
 

The indicator deserve 100 STAR, I recommend all people to buy this indicator

Kandasamy Senthil Kumar
338
Kandasamy Senthil Kumar 2020.06.22 10:53 
 

great indicator

[Supprimé] 2019.06.28 03:16 
 

L'utilisateur n'a laissé aucun commentaire sur la note

katototo
1066
katototo 2019.06.19 12:35 
 

Works well . Thanks.

Ronald de Groot
72
Ronald de Groot 2018.09.30 13:33 
 

This is nice live indicator. But seller has to tell clearly what it does, and what the numbers explain. This indicator show volume of current candle. As I see it, it is not like delta volume on futures. Its a nice indicator but explain clear in a video how it works. This can be misleading.

dnldavidek
31
dnldavidek 2018.05.21 16:20 
 

L'utilisateur n'a laissé aucun commentaire sur la note

maharajammr
40
maharajammr 2017.05.05 11:10 
 

HI,

I have pinged in personal message two days back, no response so far. Kindly help in fixing the issue ASAP.

taketnt
64
taketnt 2017.04.25 14:20 
 

L'utilisateur n'a laissé aucun commentaire sur la note

Aravind Kolanupaka
9749
Aravind Kolanupaka 2017.01.20 02:10 
 

Ultimate reliable indicator

Mindaugas Vilcinskas
161
Mindaugas Vilcinskas 2017.01.06 17:23 
 

Nice work !

jeanyves7
61
jeanyves7 2017.01.02 09:25 
 

L'utilisateur n'a laissé aucun commentaire sur la note

gcgipson
496
gcgipson 2016.08.04 18:01 
 

This indicator is simply brilliant! By looking at a single currency across all pairs and all time frames, you can truly get a sense of the direction of a currency pair. Also, there is a hidden bonus in this indicator which even the author doesn't even mention! If your strategy is sensitive to volatility, that is if you need to know if a currency pair is trading frequently or infrequently, the speed at which the numbers change within the indicator will give you a perfect sense of how much volatility is in the market. This is by far my favorite indicator!

Tuanyer De Los Santos
1478
Tuanyer De Los Santos 2016.05.06 20:52 
 

Excelente indicador para entrar y salir del Mercado. Puede ser mejorado colocando, una columna con la senal en colores incluyendo la hora de la senal. Tambien agregar una alarma con mensaje en la pantalla.

Daria Angkadiredja
253
Daria Angkadiredja 2016.04.04 12:09 
 

It's really great tool!!! Just test it and always gave excellent result, Grazie molto! This is indicator what I love because my trading strategy is based on volume and pips range per day and week, make it confluence with support/Resistant always gave excellent entry :) Already a day after I bought it,

this tools is also protect me and warning me to not make reversal this hour although price already in today resistant, I obey the Delta Panel, then yes the price still go up....because indeed in the panel the volume from M1 until W1 shows fresh number (1..2..up)start from green color in an early number are going to grow make rebound....thanks to Delta Panel which avoid me to not make a mistake! Highly recommended! So this tool looks like a must have indicator help another indicator BUy SELL product as we often see in the market which always repaint! :)

163007 Hailey
524
163007 Hailey 2016.03.15 19:03 
 

You can create a good trading plan from just watching the volume numbers in the panel. I use it to find trend reversal scalp trades. Excellent indicator!!!

Ikechukwu Emmanuel Okaro
1003
Ikechukwu Emmanuel Okaro 2015.12.16 23:57 
 

Indicator looks very interesting...

Répondre à l'avis