AngryVolumes
- Indicadores
-
Stanislav Korotky
 Trading is just my hobby. I'm working in IT industry. So developement of experts, indicators, and script is not a problem at all to me. Wide range of technologies are used: MQL4, MQL5, system and applied programming, web-services, neural networks and more.
New: - Versión: 1.2
- Actualizado: 26 abril 2023
Este indicador emula la delta de volumen (operaciones de compra frente a operaciones de venta) basándose en el volumen por vela y la forma de la vela (dirección, tamaño del cuerpo y de las mechas). Los volúmenes de compra y venta separados artificialmente se acumulan durante un número especificado de barras. El indicador muestra un histograma del delta de volumen por barra, así como una suma del delta para el periodo dado.
Y lo que es más importante, el indicador permite combinar las cotizaciones/volúmenes del símbolo actual con las cotizaciones/volúmenes de otros símbolos relacionados (futuros, índices, etc.). De esta manera, el indicador proporciona un análisis más preciso y profundo de la fuerza actual de los símbolos.
Entradas
- DeltaLength - periodo (número de barras) para la acumulación, 14 por defecto;
- RelatedSymbols - lista opcional, separada por comas, de símbolos adicionales (que complementan el símbolo del gráfico actual), que se añadirán a la acumulación de volumen; cada símbolo puede ir precedido del signo "+" o "-" para especificar la dirección del símbolo con respecto al símbolo de trabajo; "+" está implícito y puede omitirse; después de cada nombre de símbolo puede especificar un coeficiente para ponderar sus volúmenes - utilice "*" entre el nombre y el número, por ejemplo: DXY*0,1;
- UserRealVolumes - un indicador para utilizar volúmenes de ticks o volúmenes reales (si están disponibles para todos los símbolos especificados); falso por defecto, es decir, se utilizan volúmenes de ticks;
Uso
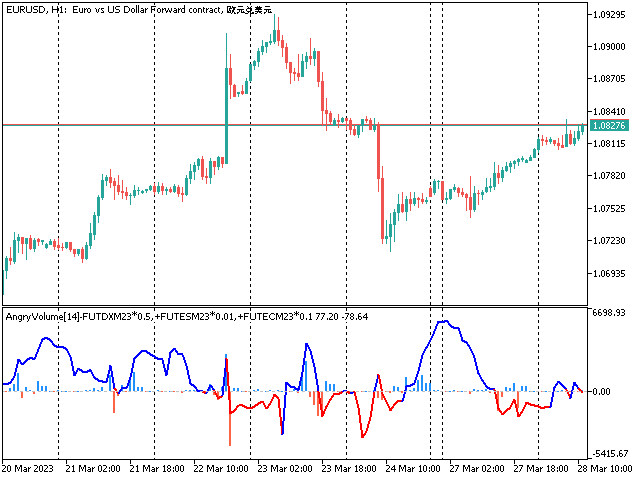
En la siguiente captura de pantalla puede ver el indicador para EURUSD y 3 símbolos adicionales, en volúmenes reales:
- FUTDXM23 - futuros sobre Dollar Index, un valor de USD frente a un conjunto de otras monedas, es decir USD/∑(XYZ);
- FUTESM23 - futuros sobre S&P500 mini, una combinación de tickers nominados en USD, es decir ∑(XYZ)/USD;
- FUTECM23 - futuros sobre EURUSD, una visión alternativa sobre EURUSD;
Por lo tanto, FUTDXM23 se añade con el prefijo "-" (acumulación invertida), y FUTESM23 y FUTECM23 se añaden con el prefijo "+":
Los coeficientes después de '*' hacen que los valores de volumen de estos 3 instrumentos tengan una ponderación más o menos igual (puede que su broker necesite coeficientes diferentes).
Por favor, asegúrese de que el historial de cotizaciones de los símbolos relacionados está precargado de antemano. De lo contrario, el indicador iniciará la descarga del historial y esperará hasta que se realice la actualización. Durante el proceso de descarga, el indicador refresca un comentario en el gráfico, mientras que la subventana permanece vacía (no habrá líneas hasta que se descarguen los datos y se calculen los buffers).