AngryVolumes
- Indikatoren
-
Stanislav Korotky
 Trading is just my hobby. I'm working in IT industry. So developement of experts, indicators, and script is not a problem at all to me. Wide range of technologies are used: MQL4, MQL5, system and applied programming, web-services, neural networks and more.
New: - Version: 1.2
- Aktualisiert: 26 April 2023
Dieser Indikator emuliert das Volumen-Delta (Kauf- und Verkaufsgeschäfte) basierend auf dem Volumen pro Kerze und der Kerzenform (Richtung, Größe des Körpers und der Dochte). Künstlich getrennte Kauf- und Verkaufsvolumina werden dann für eine bestimmte Anzahl von Balken kumuliert. Der Indikator zeigt ein Histogramm des Volumen-Deltas pro Balken sowie eine Summe des Deltas für den gegebenen Zeitraum an.
Was noch wichtiger ist: Der Indikator ermöglicht es Ihnen, die aktuellen Kurse/Volumina des Symbols mit den Kursen/Volumina anderer verwandter Symbole (Futures, Indizes usw.) zu kombinieren. Auf diese Weise bietet der Indikator eine genauere und tiefgreifendere Analyse der aktuellen Symbolstärke.
Eingaben
- DeltaLength - Periode (Anzahl der Balken) für die Akkumulation, standardmäßig 14;
- RelatedSymbols - optionale, durch Komma getrennte Liste zusätzlicher Symbole (die das Symbol des aktuellen Charts ergänzen), die zur Volumenakkumulation hinzugefügt werden sollen; jedem Symbol kann ein '+'- oder '-'-Zeichen vorangestellt werden, um die Richtung des Symbols in Bezug auf das Arbeitssymbol zu spezifizieren; '+' ist implizit und kann weggelassen werden; nach jedem Symbolnamen können Sie einen Koeffizienten zur Gewichtung seines Volumens angeben - verwenden Sie '*' zwischen dem Namen und der Zahl, z.B.: DXY*0.1;
- UserRealVolumes - ein Flag zur Verwendung von Tick-Volumen oder Real-Volumen (falls für alle angegebenen Symbole verfügbar); standardmäßig false, d.h. es werden Tick-Volumen verwendet;
Verwendung
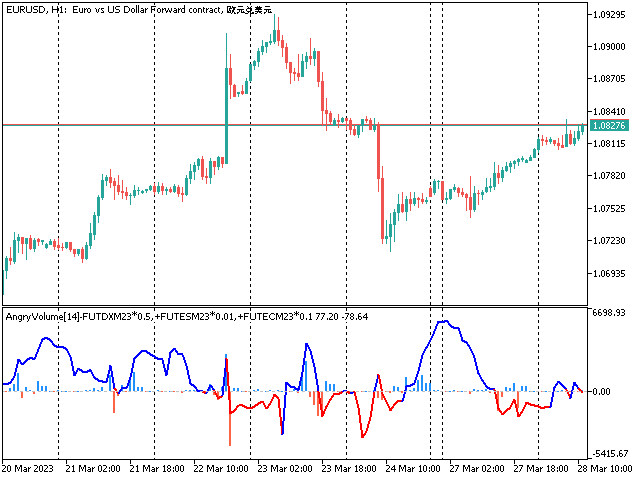
Auf dem Screenshot unten sehen Sie den Indikator für EURUSD und 3 weitere Symbole, die mit realen Volumina arbeiten:
- FUTDXM23 - Futures auf den Dollar-Index, den Wert des USD gegenüber einer Reihe von anderen Währungen, d.h. USD/∑(XYZ);
- FUTESM23 - Futures auf den S&P500 mini, eine Kombination von in USD notierten Tickern, d. h. ∑(XYZ)/USD;
- FUTECM23 - Futures auf EURUSD, eine alternative Sicht auf EURUSD;
FUTDXM23 wird also mit dem Präfix "-" hinzugefügt (umgekehrte Akkumulation), und FUTESM23 und FUTECM23 werden mit dem Präfix "+" hinzugefügt:
Die Koeffizienten nach dem '*' sorgen dafür, dass die Volumenwerte dieser 3 Instrumente mehr oder weniger gleich gewichtet werden (bei Ihrem Broker können andere Koeffizienten erforderlich sein).
Bitte vergewissern Sie sich, dass die Historie der Notierungen von verwandten Symbolen vorher geladen wurde. Andernfalls wird der Indikator den Download der Historie initiieren und warten, bis die Aktualisierung abgeschlossen ist. Während des Downloads aktualisiert der Indikator einen Kommentar auf dem Chart, während das Unterfenster leer bleibt (es werden keine Zeilen angezeigt, bis die Daten heruntergeladen und die Puffer berechnet sind).