Daily Range and ADR Reversal Indicator
- Indicadores
- Versión: 1.0
- Activaciones: 5
El Indicador de Rango Diario y Reversión ADR le muestra dónde está cotizando actualmente el precio en relación con su rango medio diario normal. Recibirá alertas mediante ventanas emergentes cuando el precio supere su rango medio diario. Esta alerta es una señal de un posible retroceso o inversión. Esto le da una ventaja en la identificación y el comercio de retrocesos y retrocesos rápidamente.
El indicador también muestra el rango diario del precio para la sesión actual del mercado, así como para las sesiones anteriores. Le muestra el ATR que es el rango promedio de pips que una vela puede mover en ese marco de tiempo en particular (5M - D1). Yo utilizo el ATR cuando establezco mi Stop Loss (es decir, 1-2 ATRs por encima del Máximo Previo para Ventas o por debajo del Mínimo Previo para Compras).
El Indicador calcula y muestra el porcentaje del ADR y ATR que el precio ha movido en el pasado y en el presente. También puede ver los datos históricos de ADR DR y DR.
Puede cambiar los colores de las Líneas de Nivel del ADR, Ocultar o Mostrar las Líneas de Nivel anteriores y/o actuales y elegir cuánto tiempo atrás desea ver dónde se trazaron las líneas de nivel.
Puede ocultar o mostrar los datos históricos.
---------------------------------- ESTRATEGIA ----------------------------------
Este indicador dibuja líneas horizontales en el gráfico en los extremos del Rango Promedio Diario. Cuando el precio alcanza los extremos, recibirá alertas emergentes instantáneas.
Espere a que el precio cierre fuera del nivel extremo. Cuando el precio cierre fuera del extremo, identifique si el precio está en una Tendencia de Compra (Alcista) o en una Tendencia de Venta (Bajista).
TENDENCIA DE COMPRA
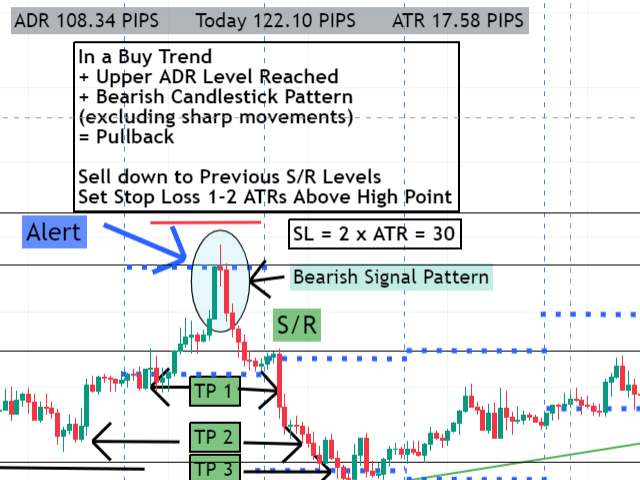
Si está en una Tendencia de Compra y recibió una alerta indicando que se ha alcanzado el Nivel Superior de ADR:
Esta es una señal para un posible Pullback - lo que significa que el precio está buscando caer y luego volver a su punto máximo original.
QUÉ HACER:
Después de recibir la alerta del nivel ADR, espere y asegúrese de que el precio haya cerrado por encima de la línea del nivel ADR superior. Espere a que se cierren 1 ó 2 velas bajistas o un patrón de vela bajista y luego mire hacia la izquierda para encontrar y vender hasta el nivel anterior de soporte/resistencia. Establezca su Stop Loss a 1-2 ATRs por encima del punto más alto de la vela alcista anterior.
Si no pudo vender en el retroceso, o si prefiere no vender en contra de la tendencia de compra, puede esperar hasta que el precio muestre una señal alcista (es decir, un martillo, una vela envolvente alcista) y luego volver a subir hasta el punto máximo original.
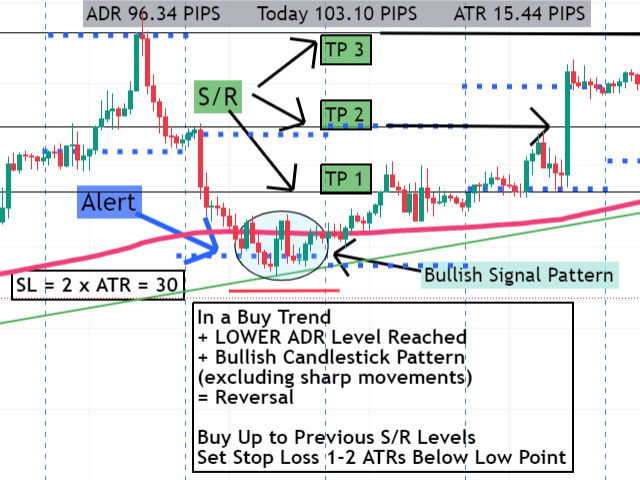
Si está en una Tendencia de Compra y recibió una alerta que indica que se ha alcanzado el Nivel ADR Inferior:
QUÉ HACER:Esta es una señal para una posible reversión, lo que significa que el precio está buscando subir y volver a su punto máximo original desde el que cayó.
Después de recibir la alerta del nivel ADR, espere y asegúrese de que el precio haya cerrado por debajo del nivel ADR bajo. Espere a que se cierren 1-2 velas alcistas o un patrón de vela alcista y luego mire hacia la izquierda para encontrar y comprar hasta el nivel anterior de soporte/resistencia.
TENDENCIA DE VENTA
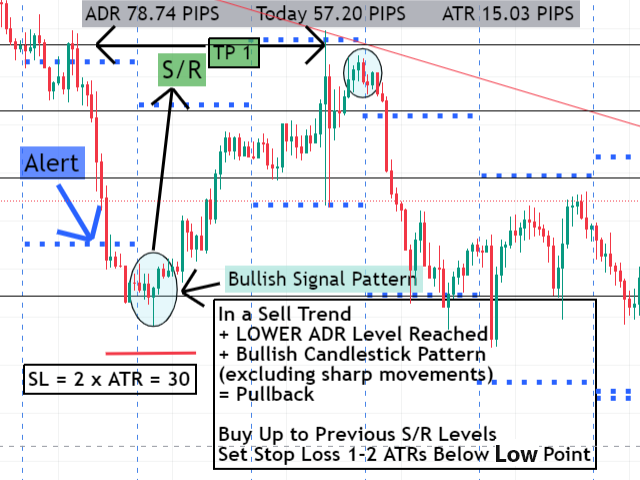
Si está en una Tendencia de Venta y recibió una alerta indicando que se ha alcanzado el Nivel de ADR Inferior:
Esta es una Señal para un posible Pullback, lo que significa que el precio está buscando subir y luego volver a bajar a su punto bajo original.
QUÉ HACER:
Después de recibir la Alerta de Nivel ADR, espere/asegúrese de que el precio haya cerrado por debajo del Nivel ADR y luego espere el cierre de 1 - 2 velas alcistas o patrón de Señal Alcista y luego mire hacia la izquierda y compre hasta el nivel anterior de Soporte/Resistencia. Establezca su Stop Loss a 1-2 ATRs por debajo del punto más bajo de la vela bajista anterior.
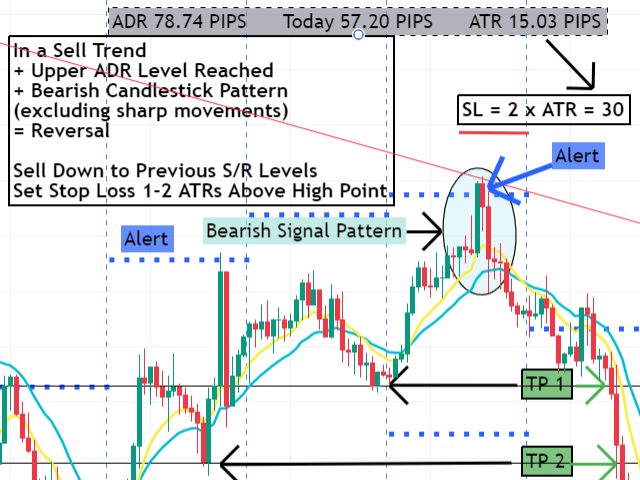
Simplemente invierta el proceso si su nivel superior de ATR fue alcanzado. En una tendencia de venta, esta es una señal de reversión. Cuando se forma un patrón bajista, el precio busca caer.
PRODUCTOS COMPLEMENTARIOS ADICIONALES DISPONIBLES AQUÍ:
TAMBIÉN DISPONIBLE EN MT5 AQUÍ:
Herramienta de retrocesos y extensiones de Fibonacci: https: //www.mql5.com/en/market/product/94303
Alertas de Cruce de Múltiples Medias Móviles:https://www.mql5.com/en/market/product/94369