Nine Lives of PSAR MT4
- Indicadores
- Versión: 3.8
- Actualizado: 24 abril 2020
- Activaciones: 5

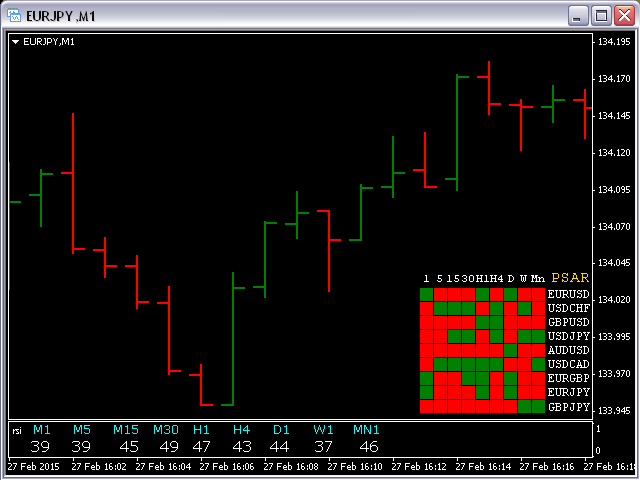
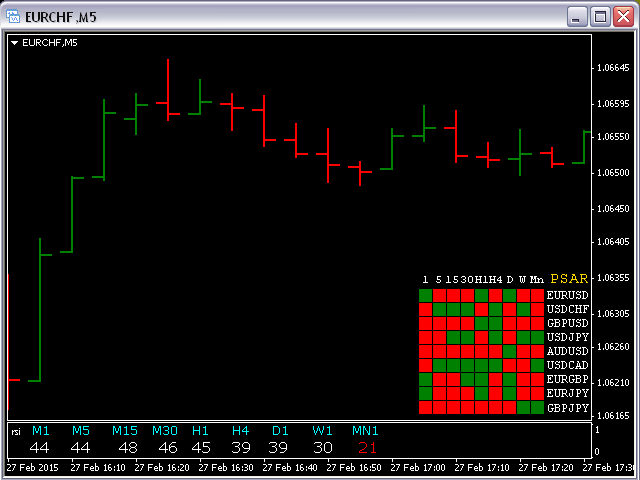
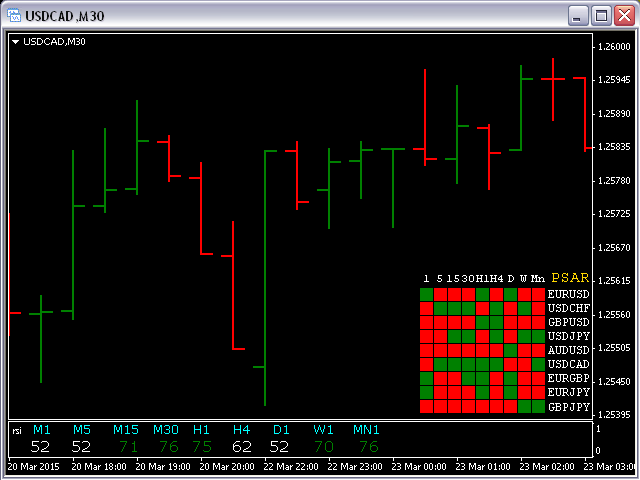
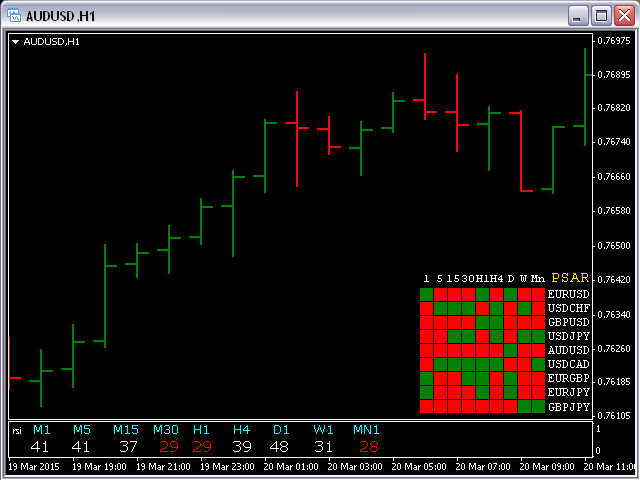
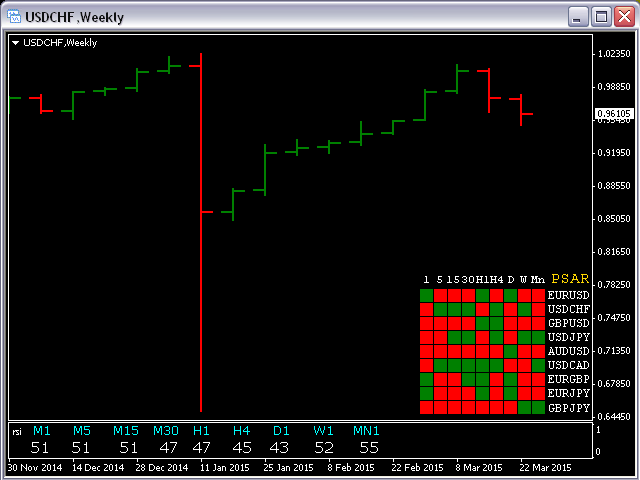
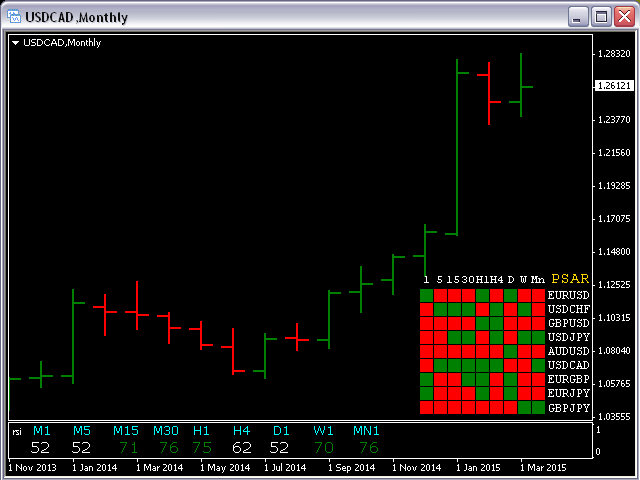
Este indicador muestra una tendencia alcista(cuadrado verde) si el valor del SAR parabólico está por debajo del precio actual, y una tendencia bajista(cuadrado rojo) si el valor del SAR parabólico está por encima del precio actual en todos los marcos temporales para cada par de divisas.
Parámetros de entrada
- de Symb1 a Symb9 - Puede cambiar cualquiera de estos Símbolos a cualquier par de divisas legal existente en su plataforma.
- step=0.0; - Representa el factor de aceleración para el indicador PSAR.
- maximum=0.2; - Valor máximo del factor de aceleración para el indicador PSAR.
- SymbColor=clrWhite; - Puede cambiar el color de todas las etiquetas.
Atención
Antes de utilizar este indicador debe abrir todos los gráficos (todos los TF) para los 9 pares de divisas.