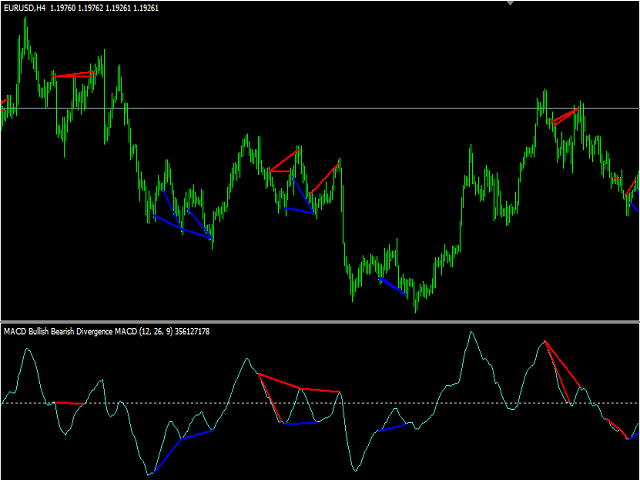
MACD Bullish Bearish Divergence
- Indicadores
- Versión: 1.0
- Activaciones: 5

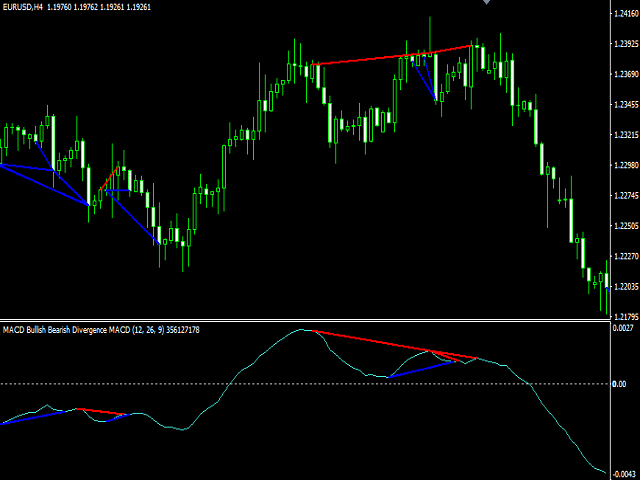
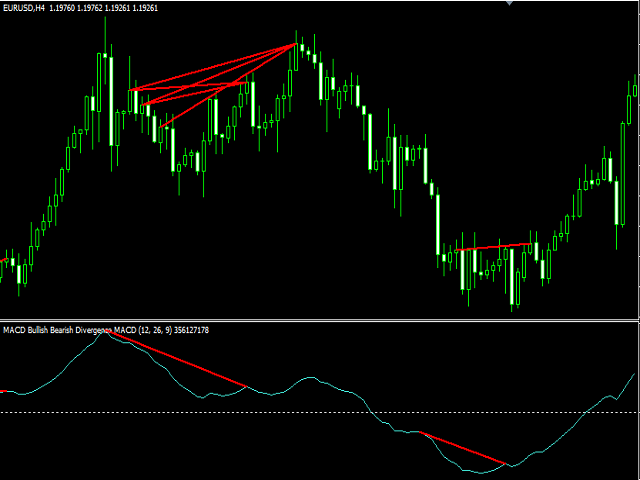
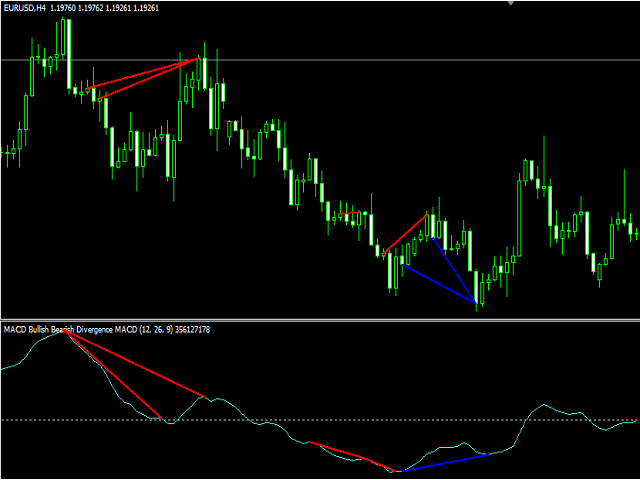
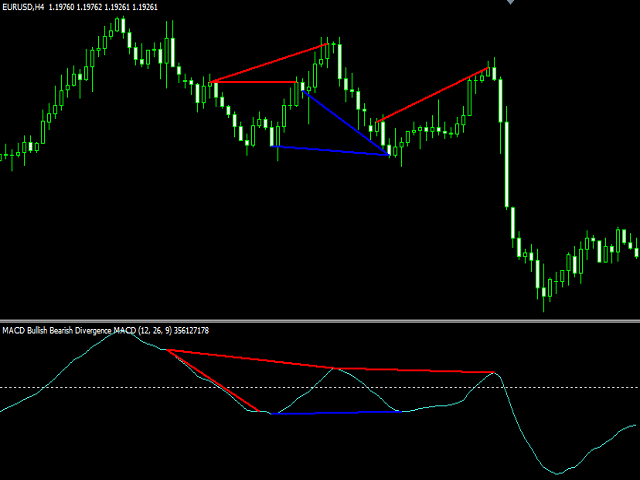
Este indicador está diseñado para encontrar la diferencia entre el precio y el indicador MACD. Este indicador muestra la diferencia entre el precio y el indicador en la pantalla. El usuario es alertado con la función de envío de alertas.
Nuestros Productos Populares
Parámetros
- divergenceDepth - Profundidad de búsqueda del 2º punto de ref.
- Fast ema - Ajuste de Fast ema
- Slow ema- Ajuste de slow ema
- MACD sma - Configuración de macd sma
- indAppliedPrice - Precio aplicado del indicador
- indMAMethod - Método de cálculo de MA
- findExtInterval - Precio ext. al ext. del indicador
- marketAppliedPrice - Precio aplicado del mercado
- Alert - ¿Alerta de divergencia?
- Push - ¿Notificación de divergencia?
- showClassA - Mostrar
- bullsDivAColor - Color de la línea de divergencia bulls
- bearsDivAColor - Color de la línea de divergencia de los osos
- showClassB - Mostrar
- bullsDivBColor- Color de la línea de divergencia de bulls
- bearsDivBColor- Color de la línea de divergencia de los osos
- showClassC - Mostrar
- bullsDivCColor - Color de la línea de divergencia de bulls
- bearsDivCColor- Color de la línea de divergencia de los osos
- showHidden - Mostrar
- bullsDivHColor - Color de la línea de divergencia de bulls
- bearsDivHColor- Color de la línea de divergencia de los osos
- indBarsCount - Número de barras a mostrar

El usuario no ha dejado ningún comentario para su valoración