MACD Alerts MT4
- Indicateurs
-
KEENBASE SOFTWARE SOLUTIONS
 Keenbase Trading développe des indicateurs professionnels et des Expert Advisors pour MetaTrader 4 et MetaTrader 5 afin d'aider les traders à prendre des décisions de trading plus éclairées.
 - Version: 2.0
- Mise à jour: 18 avril 2022
- Activations: 10
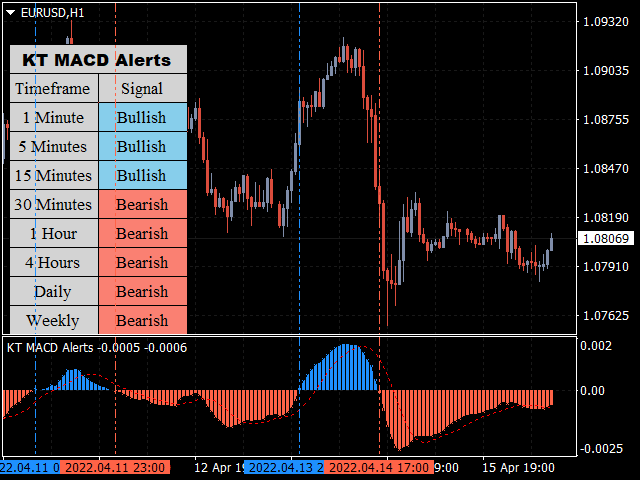
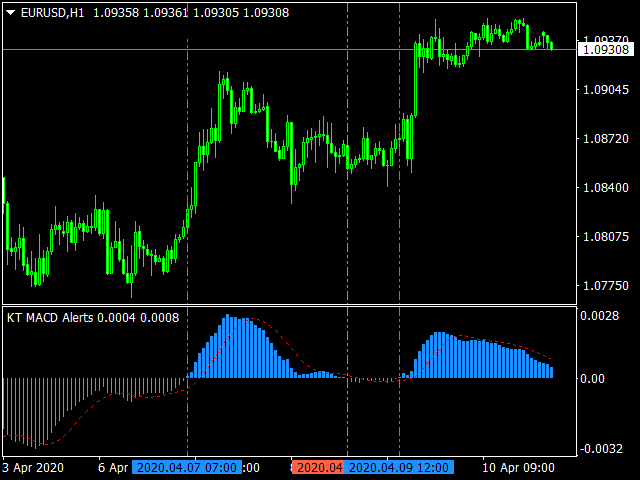
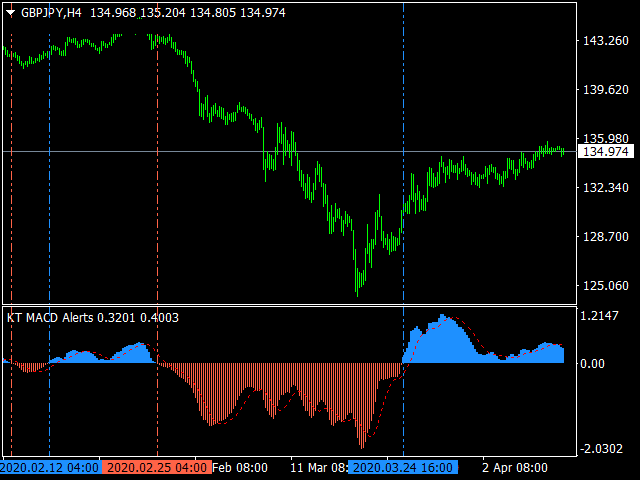
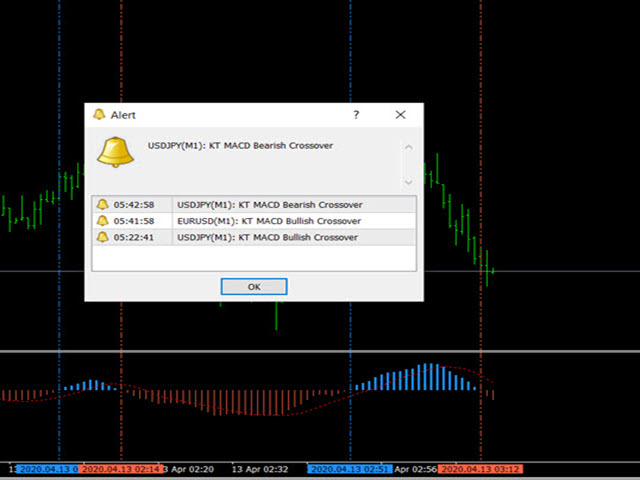
KT MACD Alerts est une version personnalisée de l’indicateur MACD standard disponible sur MetaTrader. Il génère des alertes et trace également des lignes verticales lors des deux événements suivants :
- Lorsque le MACD croise au-dessus de la ligne zéro.
- Lorsque le MACD croise en dessous de la ligne zéro.
Fonctionnalités
- Intègre un scanner MTF (multi-timeframe) qui affiche la direction du MACD sur tous les horizons de temps.
- Parfait pour les traders qui exploitent les croisements du MACD au-dessus ou en dessous de la ligne zéro.
- Trace automatiquement des lignes verticales sur le graphique pour mieux repérer les points de croisement.
- Code léger, optimisé pour ne pas alourdir MetaTrader ou consommer trop de ressources.
- Prend en charge toutes les alertes classiques de MetaTrader : pop-up, sonore, e-mail, notification push, etc.
Histoire du MACD
Le MACD (Moving Average Convergence Divergence) est un indicateur d’analyse technique très utilisé sur les marchés financiers. Il a été inventé par Gerald Appel en 1970. Le MACD permet de détecter les changements dans la force, l’élan (momentum) et la durée d’une tendance. Il reste aujourd’hui un outil essentiel dans de nombreuses stratégies de trading basées sur les tendances.