MACD Alerts MT4
- Göstergeler
- Sürüm: 2.0
- Güncellendi: 18 Nisan 2022
- Etkinleştirmeler: 10

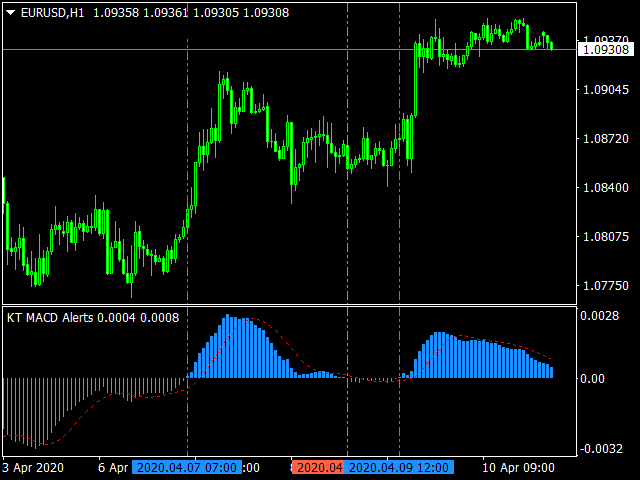
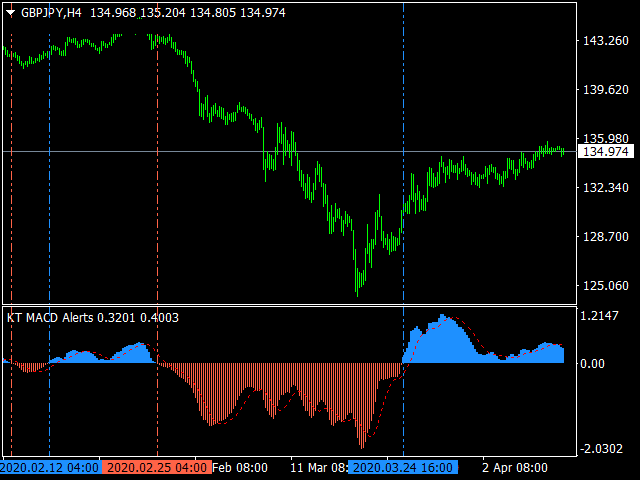
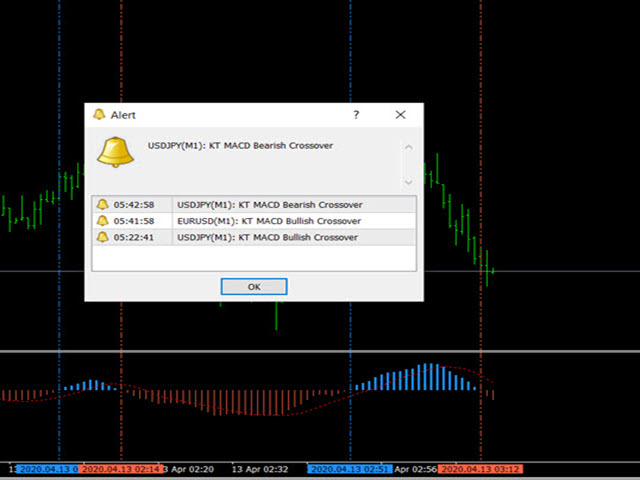
KT MACD Alerts, MetaTrader’da yer alan standart MACD göstergesinin kişiselleştirilmiş bir versiyonudur. Aşağıdaki iki durumda hem uyarı verir hem de dikey çizgiler çizer:
- MACD, sıfır çizgisinin üzerine çıktığında.
- MACD, sıfır çizgisinin altına indiğinde.
Özellikler
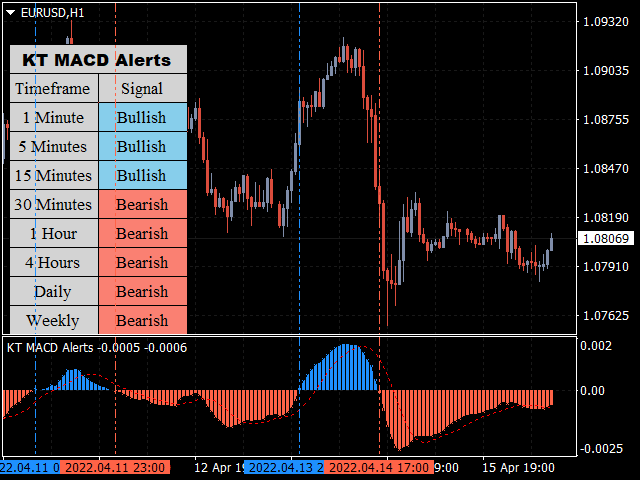
- Tüm zaman dilimlerinde MACD yönünü gösteren dahili bir çoklu zamanlı (MTF) tarayıcı içerir.
- MACD'nin sıfır çizgisi üzerinde/altında yaptığı kesişmelere göre işlem yapan trader’lar için idealdir.
- Uyarıların yanı sıra, kesişmeleri daha kolay tespit etmek için grafik üzerinde dikey çizgiler çizer.
- Sistem kaynaklarını zorlamayan hafif kod yapısıyla tasarlanmıştır.
- MetaTrader’ın tüm uyarı türlerini destekler: pop-up, sesli uyarı, e-posta, mobil bildirimler vb.
MACD’nin Tarihçesi
MACD (Moving Average Convergence Divergence), teknik analizde sıklıkla kullanılan bir göstergedir. 1970 yılında Gerald Appel tarafından geliştirilmiştir. MACD, bir varlığın fiyat trendindeki güç, ivme ve süredeki değişiklikleri görsel olarak ortaya koyar. Trend takibine dayalı birçok stratejinin temel yapı taşlarından biridir.