KT Momentum Arrows MT5
- Indicadores
-
KEENBASE SOFTWARE SOLUTIONS
 Keenbase Trading desarrolla indicadores profesionales y Asesores Expertos (Expert Advisors) para MetaTrader 4 y MetaTrader 5, diseñados para ayudar a los traders a tomar decisiones de trading más informadas.
 - Versión: 3.0
- Actualizado: 19 julio 2022
- Activaciones: 10
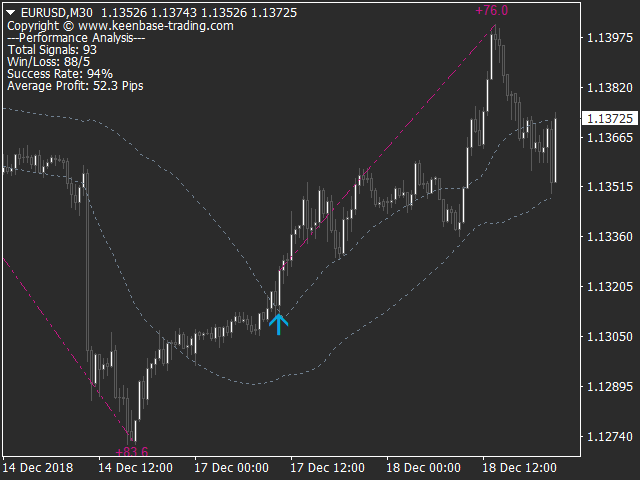
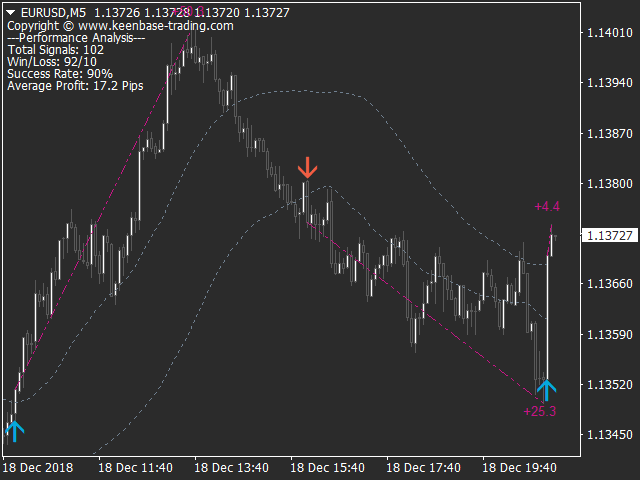
El indicador KT Momentum Arrows se basa en una ruptura momentánea que se calcula mediante la desviación de las bandas y la volatilidad emergente en una dirección determinada.
Se genera una señal de compra cuando el precio cierra por encima de la banda superior y una señal de venta cuando el precio cierra por debajo de la banda inferior.
Se utiliza un coeficiente de magnitud como parámetro de entrada, el cual afecta tanto la desviación de las bandas como la medición de la volatilidad. Este valor debe seleccionarse y analizarse cuidadosamente según el instrumento y el marco temporal.
Características clave
- ¡No repinta!
- Una excelente herramienta de entrada para traders de momentum.
- Incluye análisis de rendimiento: ganancias/pérdidas, tasa de acierto, ganancia promedio, etc.
- Adecuado para Day Traders, Swing Traders y Scalpers.
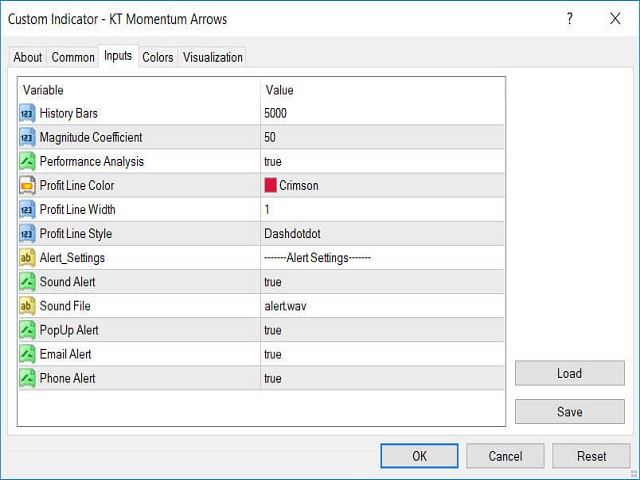
Parámetros de entrada
- Barras de historial: Cantidad de barras utilizadas para el cálculo del indicador.
- Coeficiente de magnitud: Coeficiente que ajusta la desviación de las bandas y la medición de volatilidad.
- Análisis de rendimiento: Muestra/oculta el análisis, incluidas las líneas de tendencia de ganancias.
- Configuración de alertas: Disponibles alertas emergentes, email, push y sonido.
- El resto de parámetros se explican por sí solos.


Best indicator I've ever bought.
Also, the author is very involved.