ACB Trade Filter MT4
- Indicadores
-
KEENBASE SOFTWARE SOLUTIONS
 Keenbase Trading desarrolla indicadores profesionales y Asesores Expertos (Expert Advisors) para MetaTrader 4 y MetaTrader 5, diseñados para ayudar a los traders a tomar decisiones de trading más informadas.
 - Versión: 2.1
- Actualizado: 31 octubre 2018
- Activaciones: 10
El indicador ACB Trade Filter ofrece una solución para filtrar las configuraciones de negociación de baja probabilidad en una estrategia de negociación. El indicador utiliza un sofisticado algoritmo de filtrado basado en el sentimiento y la tendencia del mercado.
Aplicaciones
- Funciona muy bien con nuestro indicador"ACB Breakout Arrows".
- Filtre las señales de baja probabilidad de cualquier indicador.
- Evite el exceso de operaciones y minimice las pérdidas.
- Opere en la dirección del sentimiento del mercado y la tendencia.
- Evita las fluctuaciones del mercado.
Modo de empleo
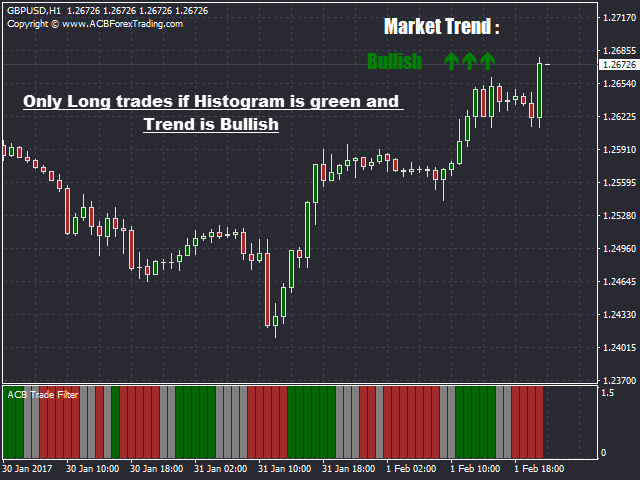
- Sólo operaciones largas si el histograma es verde y la tendencia es alcista.
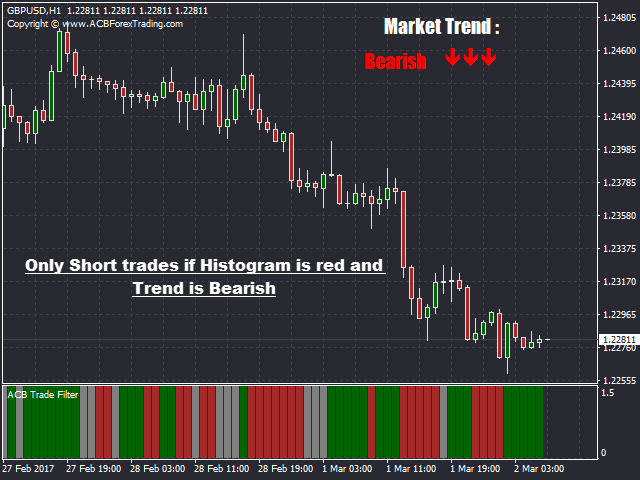
- Sólo operaciones cortas si el histograma es rojo y la tendencia es bajista.
- Evite operar si el histograma es gris o la tendencia es lateral.
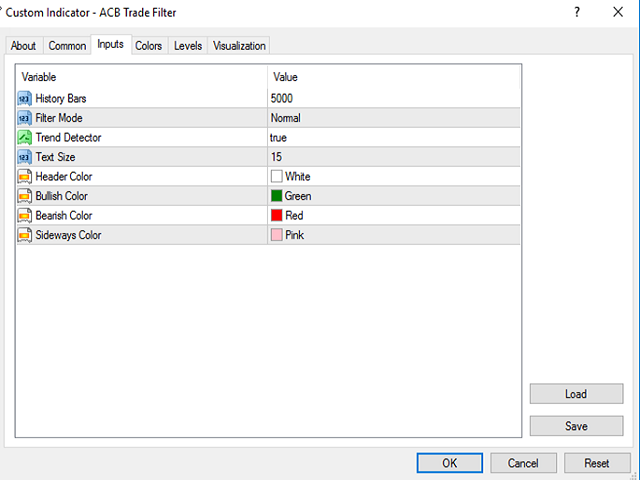
Parámetros de entrada
- Historial de Barras: El número de barras en el gráfico a considerar para los datos y cálculos del indicador.
- Modo de Filtrado: Filtrado normal o Filtrado duro.
- Detector de Tendencia: Muestra/Oculta la dirección de la tendencia.
- Esquina_tendencia: Esquina del gráfico para mostrar la dirección de la tendencia.
Para desarrolladores de EA
Utilice el siguiente código para importar este indicador en su EA.
#define  val 1.5

// Lectura del histograma

if(iCustom(NULL,0,"Market/ACB Trade Filter",0,1)==val) // El histograma es verde
if(iCustom(NULL,0,"Market/ACB Trade Filter",1,1)==val) // El histograma es rojo
if(iCustom(NULL,0,"Market/ACB Trade Filter",2,1)==val) // El histograma es gris

// Lectura de la dirección de la tendencia

if(iCustom(NULL,0,"Market/ACB Trade Filter",3,1)==1) // La tendencia es alcista
if(iCustom(NULL,0,"Market/ACB Trade Filter",3,1)==-1) // La tendencia es bajista
if(iCustom(NULL,0,"Market/ACB Trade Filter",3,1)==0) // La tendencia es lateral


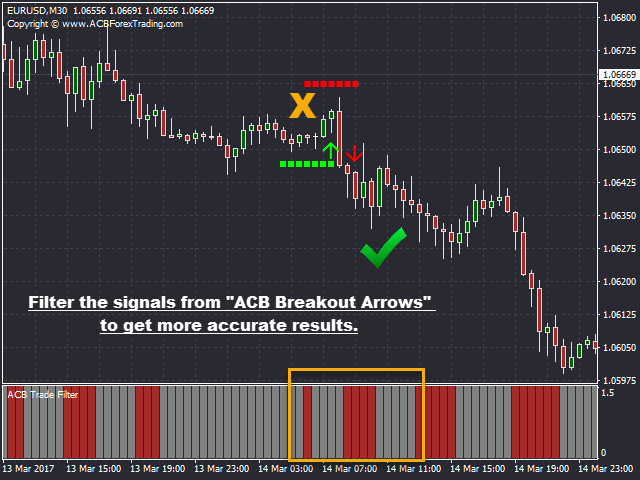


A must have indicator to filter out bad signals from any entry indicator specially the ACB Breakout Arrows.