Fractal Cycles MT5
- Indicadores
-
Navdeep Singh
 The momentum of money is always more potent than the gravity of logic
Free or paid, All tools are coded with intention to help traders
My tools:- - Versión: 1.0
- Activaciones: 10
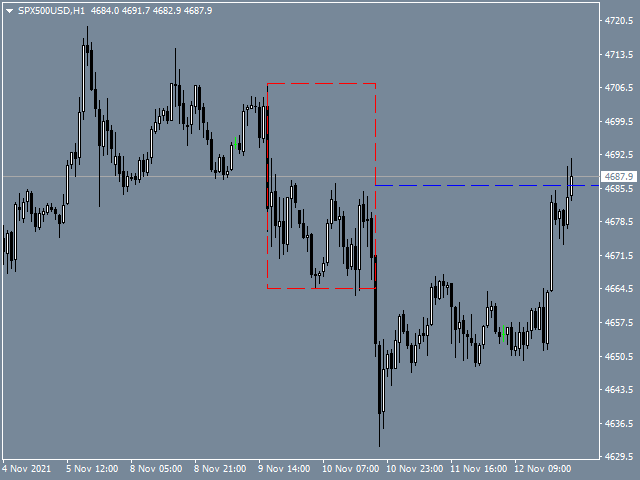
Análisis Fractal del Mercado, Oscilación Fractal, Flujo del Mercado
Los Ciclos Fractales buscan Patrones Similares en el Mercado que se repiten debido a la Naturaleza Fractal del Mercado. Estos patrones se muestran con ayuda de Objetos Gráficos y se pueden recibir Alertas sobre su llegada.
Lea elBlog para más información.
Características
- Auto Detección de Patrones
- Personalización de Color y Estilos de Línea
- Alertas, Emails y Notificaciones Push