Candle Analysis MT5
- Indicadores
-
Navdeep Singh
 The momentum of money is always more potent than the gravity of logic
Free or paid, All tools are coded with intention to help traders
My tools:- - Versión: 1.0
- Activaciones: 10
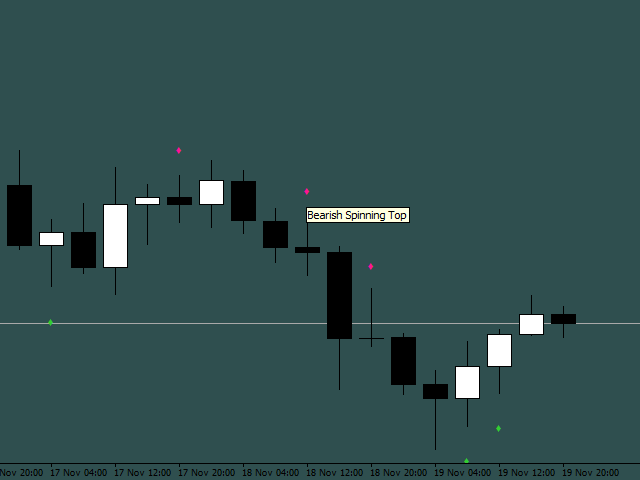
Más de 50 Patrones de Velas, Resultados de Operaciones Simuladas, Cinco Mejores Resultados
El Análisis de Velas amplía el Análisis de Patrones de Velas no sólo identificando Patrones sino también registrando el Rendimiento Pasado de los Patrones.
Qué hace
Identifica y traza los resultados en el gráfico
Muestra los mejores patrones tanto alcistas como bajistas.
El registro se puede imprimir en la pestaña de expertos para ver los resultados de las operaciones simuladas.
Muestra todos los patrones o los seleccionados.
Alertas sobre la formación de patrones
Información más detallada enel Blog