TDI Signals
- Indicadores
-
Navdeep Singh
 The momentum of money is always more potent than the gravity of logic
Free or paid, All tools are coded with intention to help traders
My tools:- - Versión: 1.1
- Actualizado: 12 febrero 2021
- Activaciones: 10
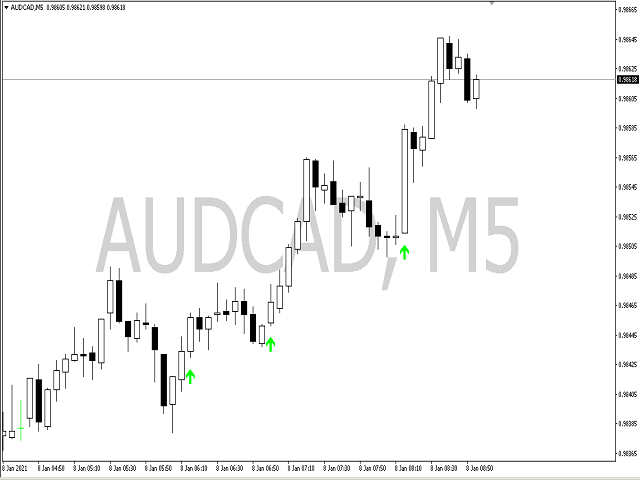
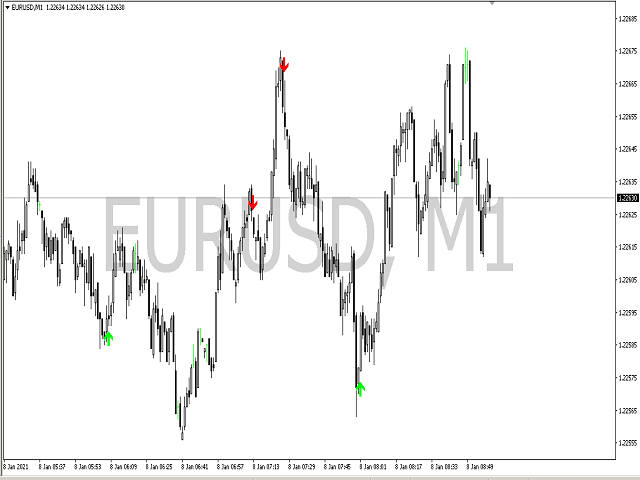
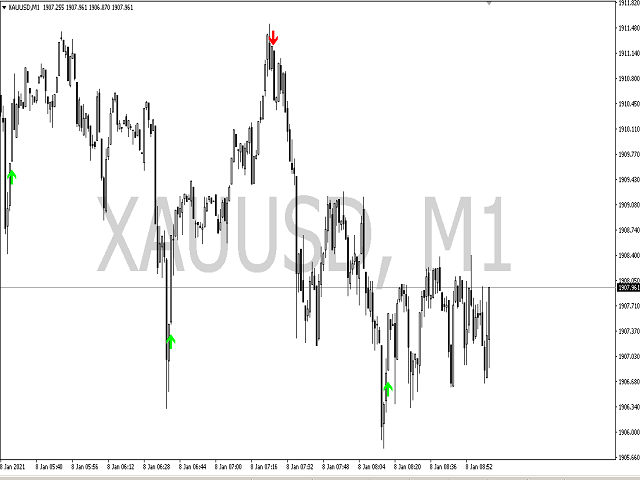
TDI Signals genera flechas de compra y venta basadas en un algoritmo TDI (Traders Dynamic Index). Busca rupturas de precios, continuaciones e inversiones. Por defecto se ejecuta en el modo de tendencia, pero el usuario tiene la opción de cambiar al modo de inversión. El operador puede utilizar el modo que mejor se adapte a su estilo de negociación.
Uso:-
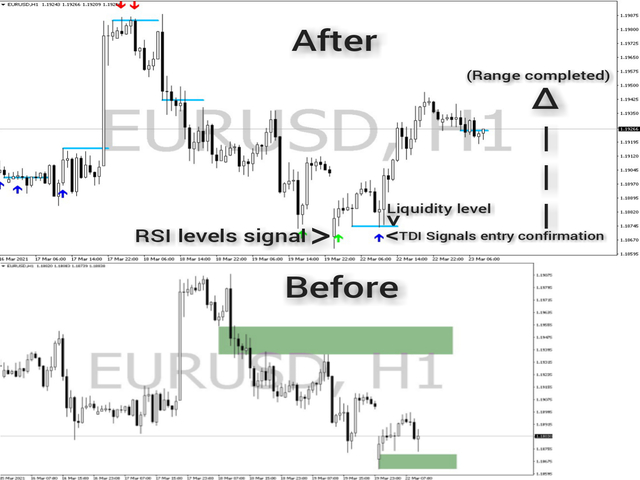
TDI Signals puede ser utilizado como un indicador independiente con contexto o incluso ser añadido a estrategias para hacer confirmaciones más fuertes. El stop loss basado en la volatilidad, el take profit y el dimensionamiento de la posición pueden ser muy útiles cuando se utiliza este algoritmo.
Un ejemplo de uso del indicador en el análisis técnico se muestra en la siguiente captura de pantalla.