Fractal Cycles MT5
- Indicateurs
-
Navdeep Singh
 The momentum of money is always more potent than the gravity of logic
Free or paid, All tools are coded with intention to help traders
My tools:- - Version: 1.0
- Activations: 10
Market Fractal Analysis, Fractal Swing, Market Flow
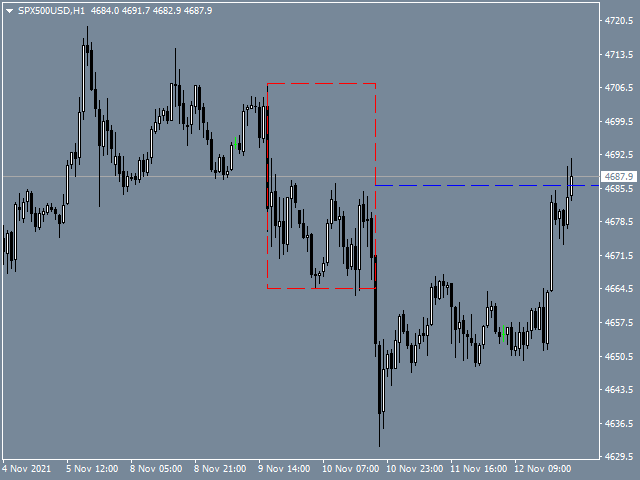
Fractal Cycles looks for Similar Patterns in the Market that repeat themselves because of the Market Fractal Nature. These patterns are displayed with help of Graphical Objects and Alerts can be received on their arrival.
Read the Blog for full information.
Features:-
- Auto Detection of Patterns
- Customization for Color and Line Styles
- Alerts, Emails & Push Notifications