IBB Candles
- Indicadores
-
Navdeep Singh
 The momentum of money is always more potent than the gravity of logic
Free or paid, All tools are coded with intention to help traders
My tools:- - Versión: 1.3
- Actualizado: 2 enero 2022
- Activaciones: 10
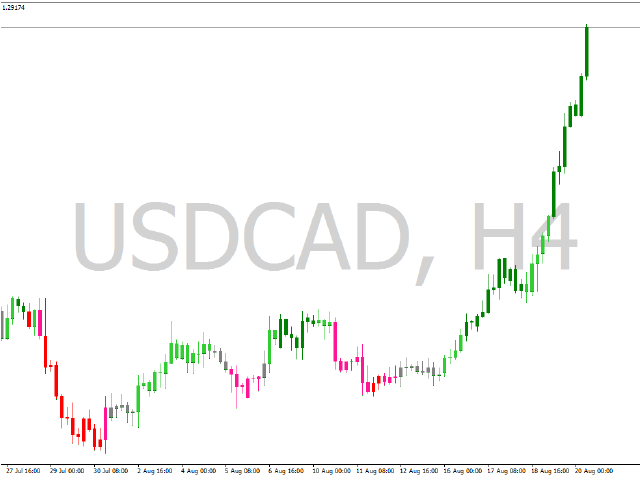
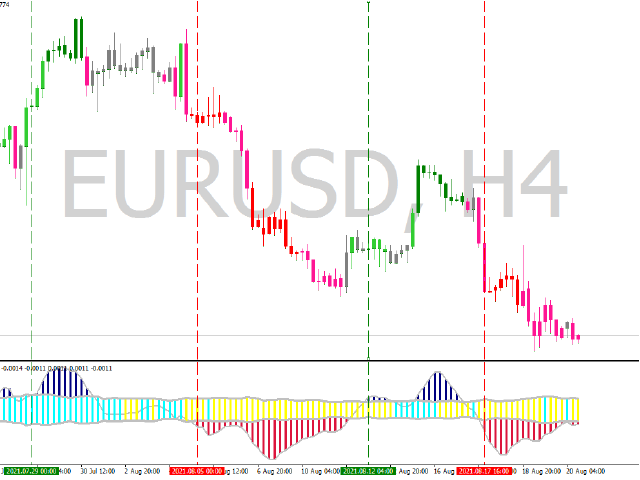
IBB Candles es una herramienta que se basa en el concepto de Bandas de Bollinger Inversas. Compara el precio relativo al estado de las bandas y traza velas con diferentes colores que definen el estado actual del mercado, es decir, rango | tendencia | tendencia fuerte.
Como su nombre indica IBB (Inverse Bollinger Bands) es una técnica que es completamente diferente de las tradicionales bandas de Bollinger y resulta ser mucho más eficaz en el análisis de mercado. Esta implementación personal hace de esta herramienta una opción más fiable.
Características principales
- Señales no repintadas
- Herramienta fácil de entender para principiantes
- Parámetros para la optimización de señales y selección de colores
- Funciona con todos los símbolos
- Funciona en todos los plazos
- Alertas, correo electrónico y notificaciones push
Uso
Los colores muestran la dirección de la tendencia, así como la fuerza de la misma. Un ejemplo de uso de esta herramienta para el análisis técnico se puede ver aquí