Stochastic Force MT5
- Indicadores
-
Navdeep Singh
 The momentum of money is always more potent than the gravity of logic
Free or paid, All tools are coded with intention to help traders
My tools:- - Versión: 1.0
- Activaciones: 10
Stochastic force es una versión avanzada del oscilador estocástico. En lugar de utilizar el precio regular, se proporciona un dato de precio más eficiente como entrada para el oscilador que tiene en cuenta la eficiencia del precio, el volumen y el ruido del mercado. También el precio es pre-filtrado con el tipo de promedio seleccionado y luego post-filtrado por un promedio móvil de casco que proporciona una transición suave del oscilador. Elimina al máximo las señales falsas y tiene el potencial de convertirse en parte integrante de cualquier sistema de negociación técnica.
Características principales
- Capacidad multi-marco de tiempo
- Amplia gama de parámetros para la optimización de señales
- Alertas, correos electrónicos y notificaciones push al móvil
Ventajas
- Indicador fácil de entender para principiantes
- Señales fiables
- Funciona en todos los instrumentos y plazos
- Herramienta que no repinta
- Genera un mínimo de señales falsas
Uso recomendado
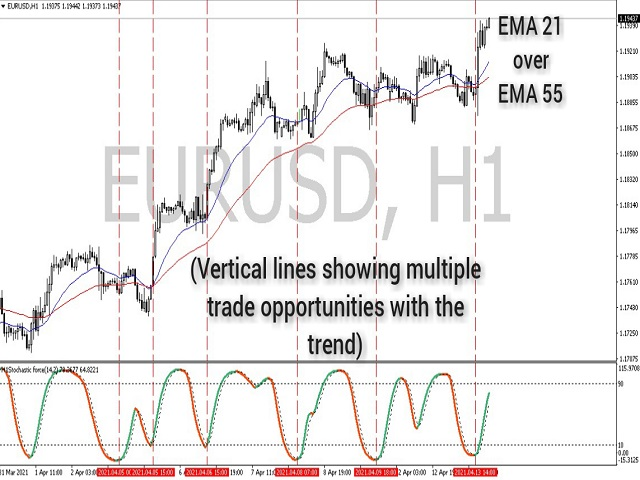
Los operadores pueden utilizar su propia experiencia para implementar esta herramienta en sus sistemas técnicos. Los niveles de sobrecompra y sobreventa se pueden utilizar para cronometrar posibles entradas de operaciones. A continuación se ofrecen ejemplos de algunos métodos fiables que muestran la capacidad de esta herramienta.
- El ejemplo uno muestra el uso de dos EMA para identificar la tendencia y los niveles de sobreventa del indicador para señales de compra. VerCaptura de pantalla 1
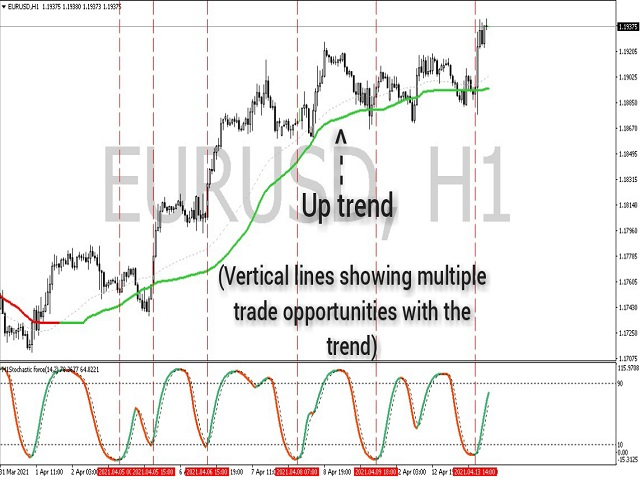
- El ejemplo dos muestra la confluencia de la CMA y la fuerza estocástica para encontrar posibles entradas de operaciones. Ver captura de pantalla 2
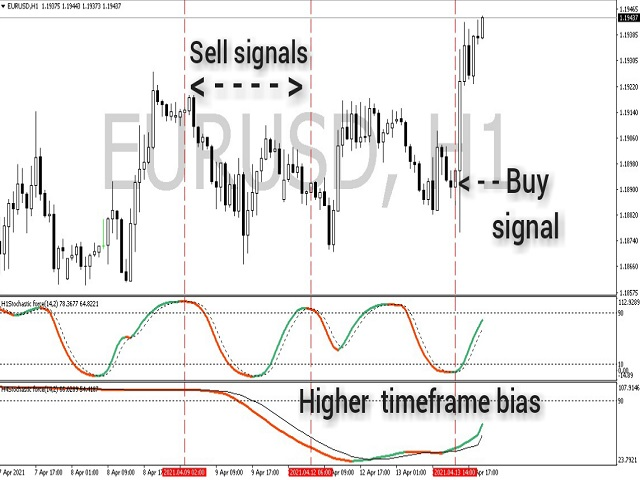
- El ejemplo tres muestra cómo se puede utilizar el sesgo de un marco de tiempo más alto para tomar decisiones seguras. Ver captura de pantalla 3