Reversal Signals
- Indicadores
-
Makarii Gubaydullin
 Asistente de Comercio Multifuncional
MT5: https://www.mql5.com/es/market/product/71145 - Versión: 1.10
- Actualizado: 31 marzo 2022
- Activaciones: 5
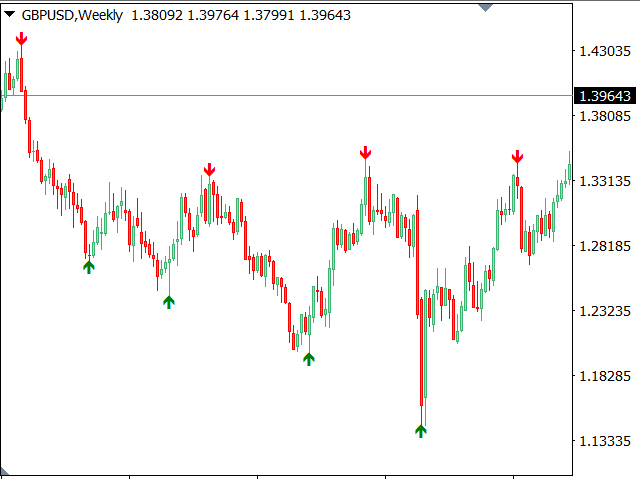
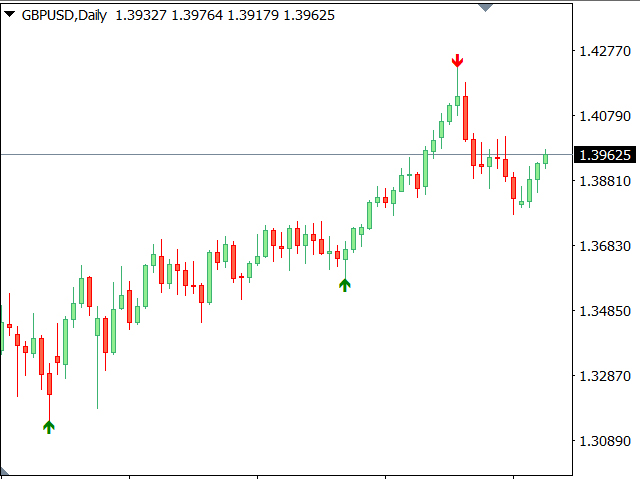
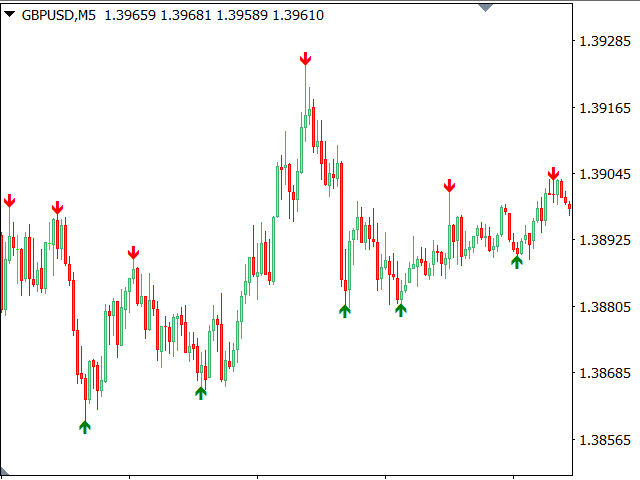
Indicador multimoneda de señales de reversión
Echa un vistazo a Mi #1 Asistente de trading: incluye 66+ funciones e indicadores | Contáctame si tienes alguna pregunta
- Las señales se calculan en base a niveles de sobreventa y sobrecompra.
- El indicador funciona con cualquier instrumento de trading y en cualquier timeframe.
- Las señales se filtran adicionalmente según indicadores de tendencia.
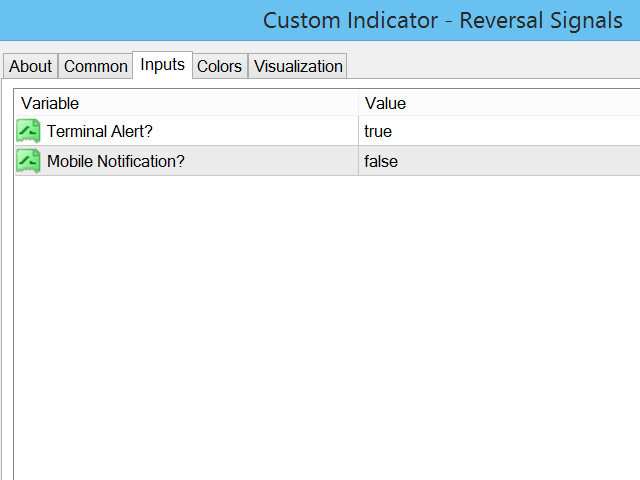
- Los colores de las flechas se pueden ajustar en la configuración de entrada.
- Opciones de notificación: alertas en el terminal y notificaciones push en dispositivos móviles.