Reversal Signals
- Göstergeler
- Sürüm: 1.10
- Güncellendi: 31 Mart 2022
- Etkinleştirmeler: 5

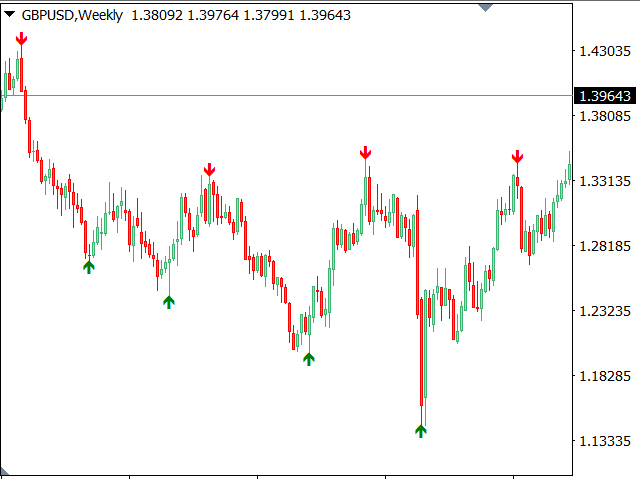
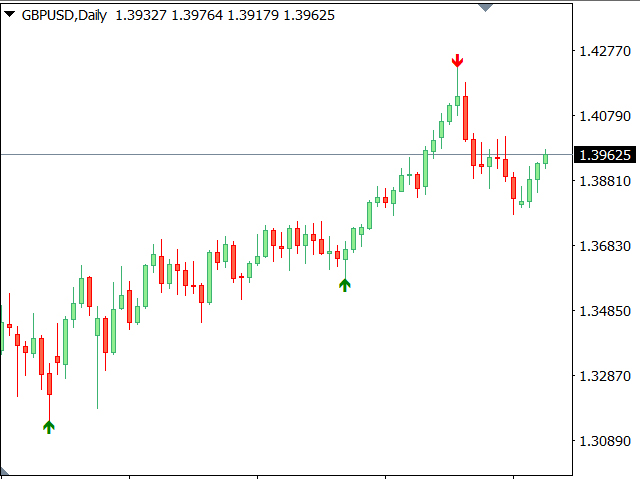
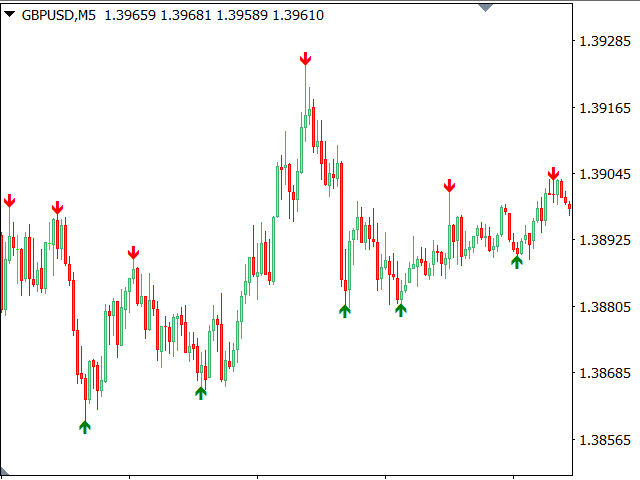
Çoklu para birimi dönüş sinyalleri göstergesi
- Sinyaller aşırı satım ve aşırı alım seviyelerine göre hesaplanır.
- Gösterge tüm enstrümanlar ve zaman dilimlerinde çalışır.
- Sinyaller trend göstergeleriyle ek filtrelemeye tabi tutulur.
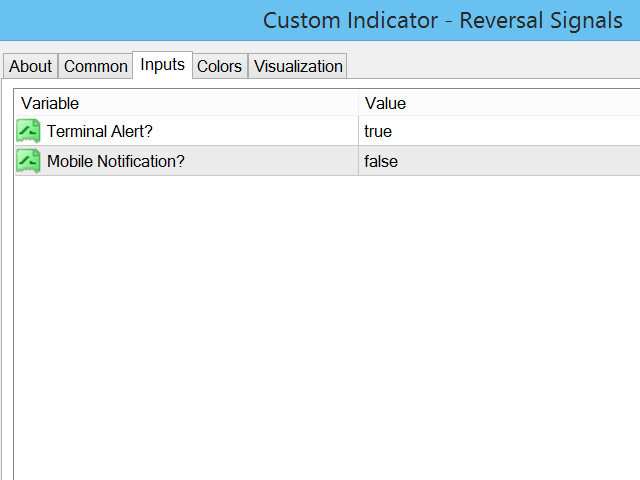
- Ok renkleri giriş ayarlarından değiştirilebilir.
- Bildirim seçenekleri: terminal uyarıları ve mobil cihazlara push bildirimler.